Article Text

Abstract
Objective The aim of this study is to assess the odds of caesarean section (CS) for uninsured women in the USA and understand the underlying mechanisms as well as consequences of lower use.
Study design Systematic review and meta-analysis.
Data sources PubMed, Embase, the Cochrane Library and CINAHL from the first year of records to April 2018.
Eligibility criteria We included studies that reported data to allow the calculation of ORs of CS of uninsured as compared with insured women.
Outcomes The prespecified primary outcome was the adjusted OR of deliveries by CS of uninsured women as compared with privately or publicly insured women. The prespecified secondary outcome was the crude OR of deliveries by CS of uninsured women as compared with insured women.
Results 12 articles describing 16 separate studies involving more than 8.8 million women were included in this study. We found: 0.70 times lower odds of CS in uninsured as compared with privately insured women (95% CI 0.63 to 0.78), with no relevant heterogeneity between studies (τ2=0.01); and 0.92 times lower odds for CS in uninsured as compared with publicly insured women (95% CI 0.80 to 1.07), with no relevant heterogeneity between studies (τ2=0.02). We found 0.70 times lower odds in uninsured as compared with privately and publicly insured women (95% CI 0.69 to 0.72).
Conclusions CSs are less likely to be performed in uninsured women as compared with insured women. While the higher rates for CS among privately insured women can be explained with financial incentives associated with private insurance, the lower odds among uninsured women draw attention at barriers to access for delivery care. In many regions, the rates for uninsured women are above, close or below the benchmarks for appropriate CS rates and could imply both, underuse and overuse.
- caesarean section
- health insurance
- uninsured
- self-pay
- medical practice variation
- underuse
This is an open access article distributed in accordance with the Creative Commons Attribution Non Commercial (CC BY-NC 4.0) license, which permits others to distribute, remix, adapt, build upon this work non-commercially, and license their derivative works on different terms, provided the original work is properly cited, appropriate credit is given, any changes made indicated, and the use is non-commercial. See: http://creativecommons.org/licenses/by-nc/4.0/.
Statistics from Altmetric.com
Strengths and limitations of this study
Extensive literature search, screening and data extraction performed in duplicate, review and analysis of study characteristics as well as thorough quality assessment of included studies.
All studies are from one country, that is, the USA, and this limits the effect of contextual factors.
A major limitation of our study is the variation across studies, in terms of the study populations characteristics, type of data used, types of caesarean section analysed and adjusting variables used in statistical analyses.
The results of this study are driven by the largest study which contains over two-thirds of the population included in this review. Only 5 out of 16 studies included in the review report data after year 2000.
While a population-level caesarean section rate of less than 9%, 10% or 19% suggests underuse, we cannot determine the mix of under, over and appropriate use in a specific population.
Introduction
Introduction of clinical procedures in medical practice has saved and improved the lives of many people worldwide. But with time, these clinical procedures become subject to overuse or underuse.1 Overuse may result in unnecessary harm due to the side effects of the procedures or, in case of underuse, not receiving the care they need.1–3 These adverse effects occur due to differing health systems and other contextual factors.3 4 These factors include financial and non-financial barriers in accessing healthcare, present even in the most advanced economies of the world, such as the USA. Consequently, specific segments of the population may be underserved as healthcare systems are unable to address structural problems that leave patients without the care they need.1
Globally, caesarean section (CS) is an example of overuse and underuse of clinical procedures. Once introduced into clinical practice, it greatly improved maternal and newborn outcomes.5 Presently, many countries have long exceeded the 9%–16% or 10%–15% thresholds or 19% benchmark for CS out of total deliveries, argued to be the ideal rates of CS in terms of improving the health of women and newborns.6–9 CS rates average as high as 40.5% among countries in Latin America and the Caribbean region,10 32.3% in Northern America10 (32.2% in USA),11 while on the other extreme, it is as low as 7.3% in Africa10: 1% in Nepal and Cambodia to 0.6% in Ethiopia and Niger.12 Variations are also observed within countries.5 12 13 For instance, in the USA, a recent study reported a range between 4% and 65% across health markets.14
Insurance coverage is one of the health system factors known to influence the use of medical procedures,15 16 including CS.17–20 While private insurance, for example, seems to increase the odds of having a CS delivery,17 the lack of insurance appears to decrease it.20–22 Millions of people worldwide, as well as in the USA, are not covered by any insurance scheme and are exposed to the hazard of being underserved with clinical procedures,23–27 including perinatal services.28 The USA has a mixed health insurance system dominated by private insurance.24 The Federal Medicare program covers people over 64 years old and/or disabled, which accounts for about 16.7% of the population.24 State Medicaid programs cover children and parents from low-income families as well as partially caring for Medicare beneficiaries with low incomes and, in total, accounts for about 19.4% of the US population.29 Over half of US population is covered with voluntary employer-based private insurance.29 The remaining population is uninsured and can range from 2.5% (Massachusetts) to 16.6% (Texas) according to 2016 estimates.29 For decades, in the USA, there has been an ongoing debate for and against universal health coverage and related topics with limited but substantial progress towards more coverage through the Affordable Care Act.23 30–37 Nonetheless, millions of Americans remain uninsured for various reasons and are not able to access the healthcare they need.23 31 38 The aim of this study is to assess the odds of CS for uninsured women in the USA and understand the underlying mechanisms as well as consequences of lower use in the US context.39
Materials and methods
Search strategy and data sources
Search words referring to CS, such as ‘caesarean section’, ‘caesarean delivery’, caesarean’, were combined with words referring to factors contributing to variation and increase of CS rates, such as ‘insurance’, ‘social class’, ‘socioeconomic’ and words referring to the study design, such as ‘geographical variation’, ‘medical practice variation’ (online supplementary appendix 1). No publication date or language restrictions were applied. We searched PubMed, Embase, the Cochrane Library and CINAHL from the beginning of records to the end of April 2018, when we last updated our search. A manual search was applied on the reference lists of included studies and previous systematic reviews.
Supplementary file 1
Study selection and outcomes
To be included in the analysis, studies had to report OR or data that enabled the calculation of OR of CS comparing uninsured against privately and/or publicly insured women. More specifically, we did not exclude studies based on any population characteristic. Studies had to report normal (vaginal) and CS deliveries with uninsured and privately and/or publicly insured comparisons. In an ideal situation, studies would report adjusted OR of uninsured as compared with privately and/or publicly insured women, but in cases, ORs were not calculated by the authors, we would extract data (rates and regression coefficients) and perform calculations that would allow for the derivation of OR. We did not exclude studies by type of study design, variables used for adjustment or any other study characteristic. Adjusted OR of deliveries by CS of uninsured women in comparison to insured women was the prespecified primary outcome. Crude OR of deliveries by CS of uninsured women in comparison to insured women was the prespecified secondary outcome.
Data extraction
Papers screening and independent data extraction was done by two researchers (IH and MB). Differences were resolved based on consensus. We extracted data on study population, study design, data sources, setting, type of CS analysed, statistical analysis and (primary and secondary) outcome measures (online supplementary appendix 2).
Supplementary file 2
Quality assessment
We used Quality In Prognosis Studies (QUIPS) to assess the risk of bias across six study domains.40 Each study was evaluated independently by two researchers (IH and MB) and any differences among evaluators were discussed and resolved. A single rating was assigned for all studies. As specified in the QUIPS tool, a ‘high’, ‘moderate’ or ‘low’ rating was applied for individual domains and overall rating of a study.40 If a study was rated with a low risk of bias across all the six domains, it would receive an overall rating of low risk of bias.17 If one or more domains of a study were rated with a moderate risk of bias, it would receive an overall moderate risk of bias.17 If one or more domains of a study were rated with a high risk of bias, it would receive an overall high risk of bias.17
Main analysis
Standard inverse-variance random-effects meta-analysis was used to combine the overall ORs. An OR lower than one implies a lower frequency of CS in uninsured than in insured women. We calculated τ2 to measure heterogeneity between studies.41 Prespecified cut-offs of τ2 of 0.04, 0.16 and 0.36 were used to represent low, moderate and high heterogeneity between studies.42 Subgroup analysis by study design, period of data collection, state, type of CS analysed, parity, inclusion of women with previous CS, pregnancy risk of included women and level of (QUIPS) risk of bias was performed to examine between-study heterogeneity and X2 test was used to calculate p values for interaction among subgroups. Test for linear trend was performed in case of more than two ordered strata. All p values were two sided. STATA, release V.13, was used for analyses (StataCorp).
Additional analysis
We calculated CS rates among different insurance subgroups for the studies included in the analysis.
Patient involvement
No patients were involved in this study. We used data from published papers only.
Results
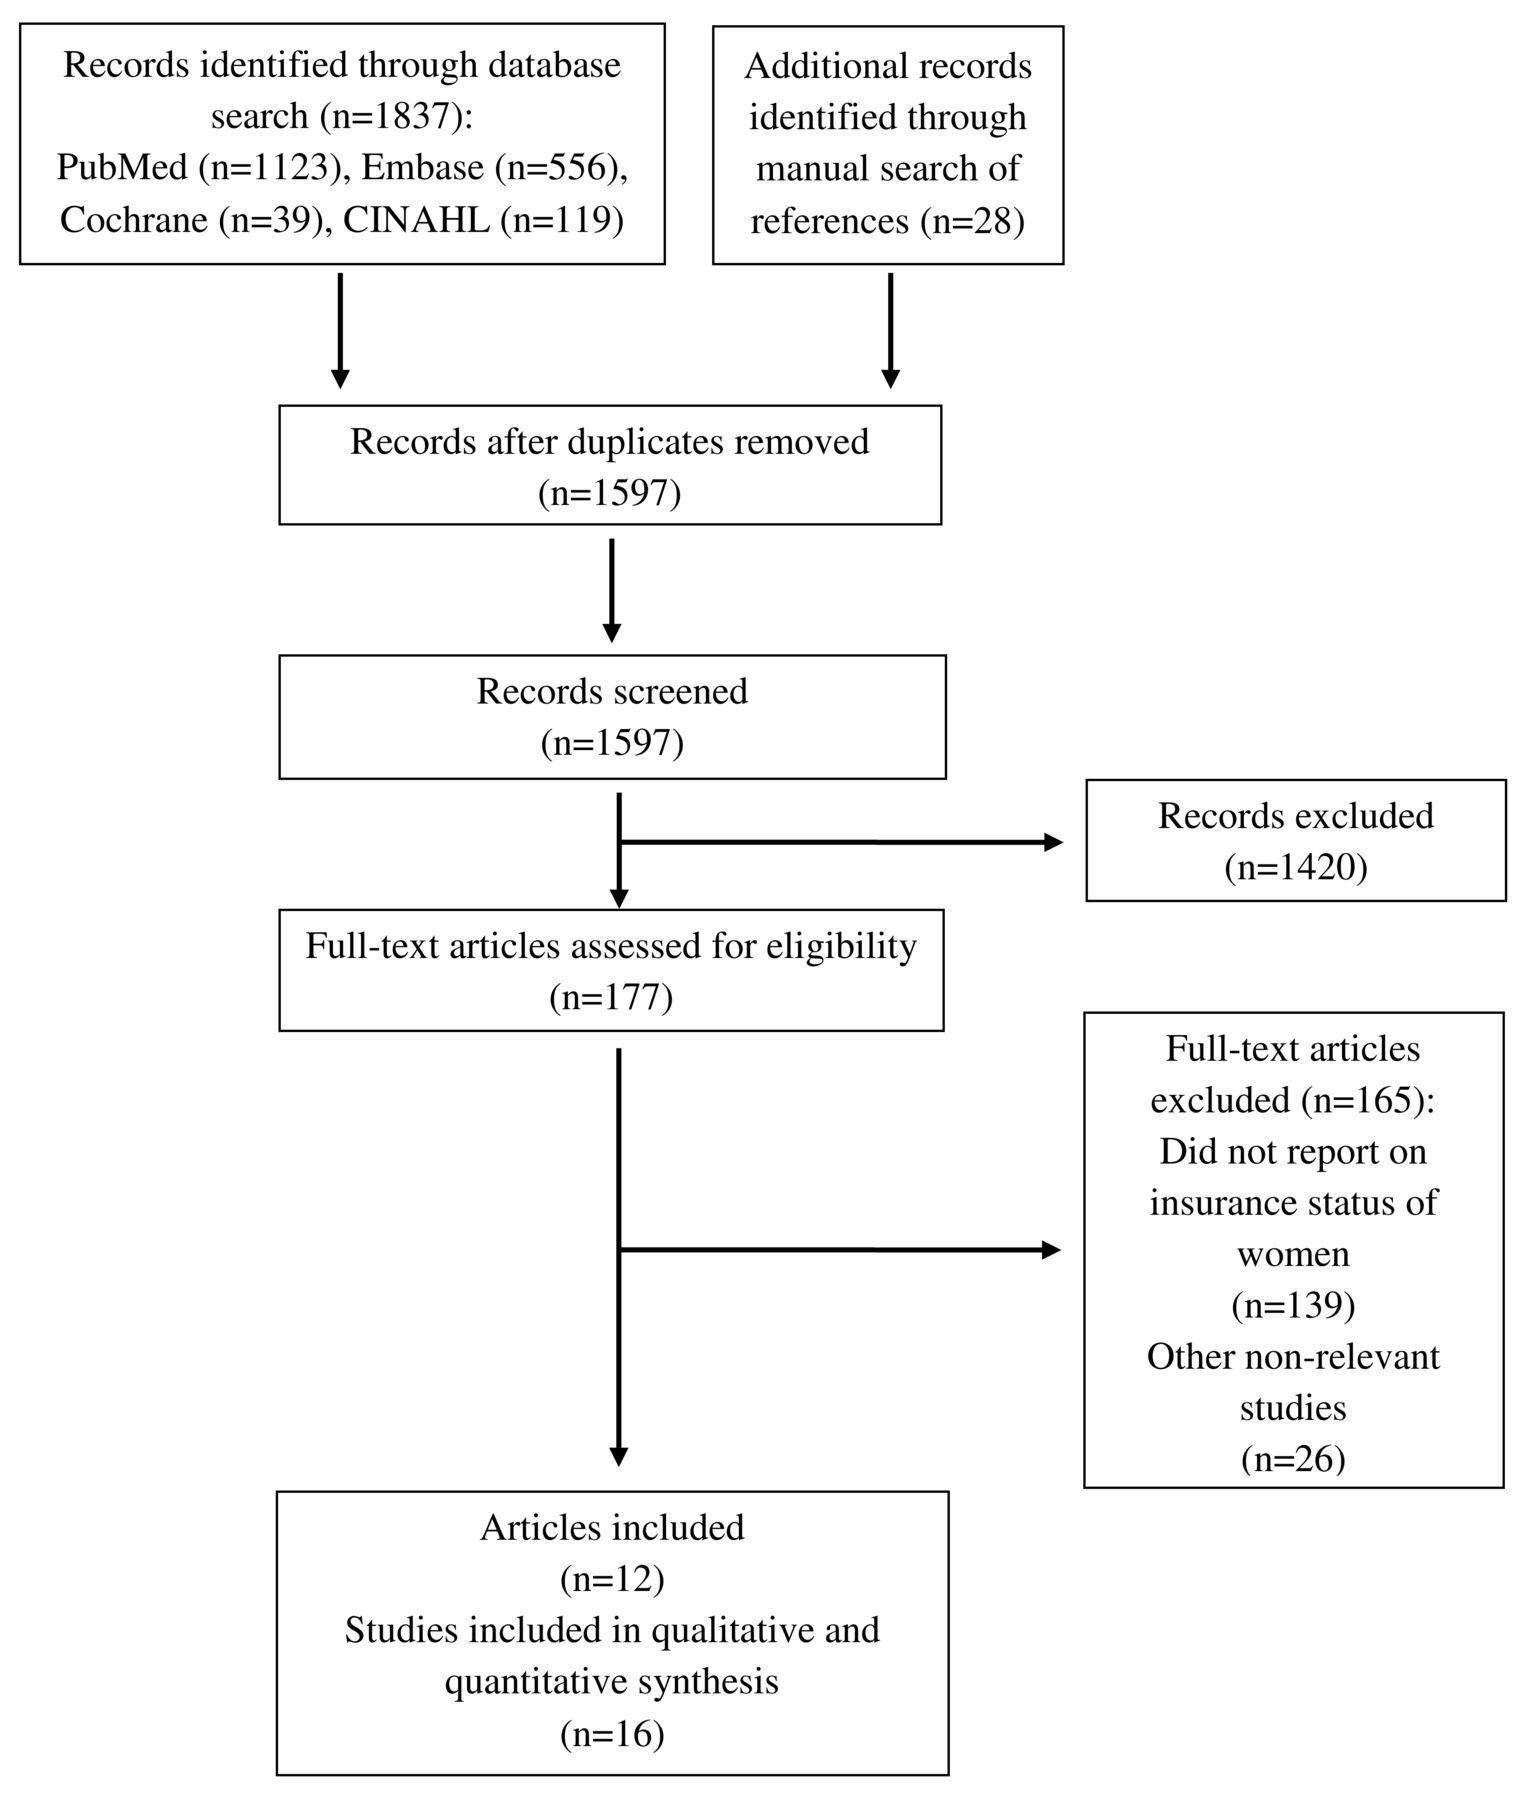
We identified a total of 1837 records: 1123 from PubMed; 556 from Embase; 39 from the Cochrane Library, 119 from CINAHL and 28 from manual search (figure 1). We removed 240 duplicates. A total of 1597 records were screened for eligibility. We performed full-text examination on 177 records. We excluded 139 that did not report insurance status of women43–181 and 26 that were otherwise irrelevant182–207 (online supplementary appendix 3). Finally, 12 records describing 16 separate studies20–22 62 208–215 including more than 8.8 million women were included in the review and meta-analysis.
Supplementary file 3

The flow diagram of review.
Characteristics of studies are presented in table 1 and online supplementary appendix 4–7. All studies were from the USA. Thirteen studies were cross-sectional and three were retrospective cohort studies. Population size of studies ranged from 9017 to 6 717 486 cases. Studies used data from years 1986 to 2011 and most studies used hospital records data (online supplementary appendix 4). Case exclusion criteria varied considerably (online supplementary appendix 5) as well as variables studies used for statistical adjustment (online supplementary appendix 6). Online supplementary appendix 7 reports evaluation of studies using QUIPS risk of bias tool. Four studies were classified with low risk of bias, two studies with moderate risk, and 10 studies with high risk of bias (online supplementary appendix 7).
Supplementary file 4
Supplementary file 5
Supplementary file 6
Supplementary file 7
Characteristics of included studies
Figure 2 presents meta-analyses for primary outcome measure, that is, adjusted ORs of CS in uninsured women as compared with privately or publicly insured. Since there was a positive interaction between uninsured versus privately insured group and uninsured versus publicly insured group (p=0.016), we performed meta-analyses for each group separately. In the meta-analysis comparing uninsured with privately insured women, including seven studies in 556 454 women, we found that the odds of CS were 0.70 times lower in uninsured as compared with privately insured women (95% CI 0.63 to 0.78), with no relevant heterogeneity between studies (τ2=0.01). In meta-analysis comparing uninsured with publicly insured women, including four studies in 510 010 women, we found that the odds of CS were 0.92 times lower in uninsured as compared with publicly insured women (95% CI 0.80 to 1.07), with no relevant heterogeneity between studies (τ2=0.02). An additional study in 6 717 486 women, which did not distinguish between privately and publicly insured women,215 reported that the odds of CS were 0.70 times lower in uninsured as compared with insured women (95% CI 0.69 to 0.72).

Adjusted ORs of caesarean section.
Figure 3 presents results of subgroup analyses of adjusted ORs in uninsured versus privately insured women (Figure 3A) and in uninsured versus publicly insured women (Figure 3B). In the analysis of uninsured versus privately insured women, estimates varied for subgroups state (p for interaction <0.001), type of CS (p for interaction <0.001), parity (p for interaction=0.07), and pregnancy risk (p for interaction <0.001). There was no positive trend in the period of data collection subgroup. In the lower panel, which presents subgroup analyses of adjusted ORs in uninsured versus publicly insured women, estimates varied for subgroups period of data collection (p for interaction=0.03), state (p for interaction=0.004), type of CS (p for interaction=0.03), parity (p for interaction=0.03) and QUIPS risk of bias (p for interaction=0.03).

Subgroup analyses for adjusted estimates. *P for trend. QUIPS, Quality In Prognosis Studies.
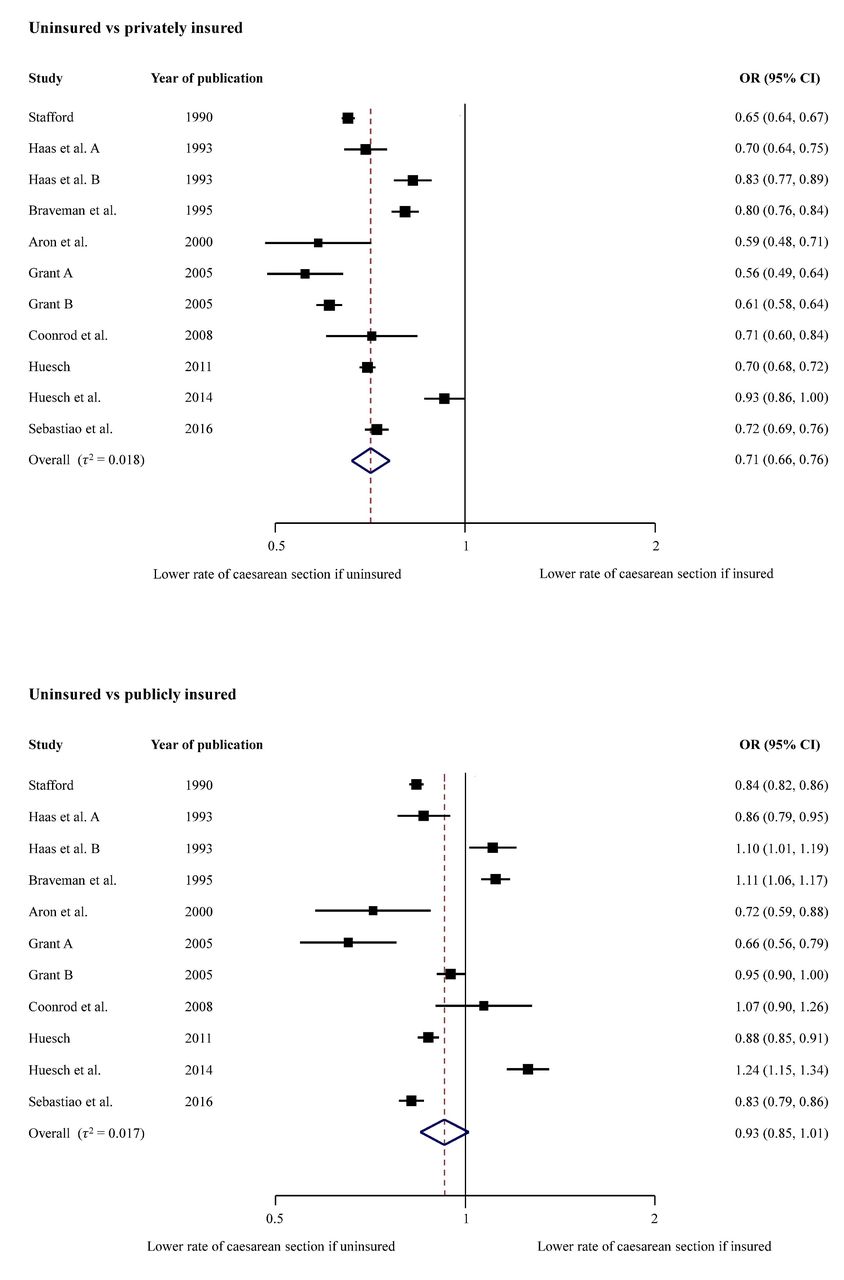
In figure 4, we present meta-analyses for crude ORs of CS in uninsured as compared with privately or publicly insured women as secondary outcome. In the meta-analysis comparing uninsured with privately insured women, including 11 studies in 2 010 483 women, we found that the odds of CS were 0.71 times lower in uninsured as compared with privately insured women (95% CI 0.66 to 0.76), with no relevant heterogeneity between studies (τ2=0.018). In the meta-analysis comparing uninsured with publicly insured women, including 11 studies in 2 010 483 women, we found that the odds of CS were 0.93 times lower in uninsured as compared with publicly insured women (95% CI 0.85 to 1.01), with no relevant heterogeneity between studies (τ2=0.017).
Crude ORs of caesarean section.
Table 2 presents rates of CS among groups with different insurance status for individual studies. Six studies found CS rates for uninsured women below the 19% benchmark. One study found CS rates below the 10% benchmark. The rates of other studies range from 19.3% to 23.0%, close to 19% benchmark.
Caesarean section (CS) rates among groups with different insurance status
Discussion
Our systematic review and meta-analyses estimated that the overall odds of receiving a CS are on average 0.70 times lower for uninsured women as compared with privately insured women (95% CI 0.63 to 0.78), 0.92 times lower for uninsured women as compared with publicly insured women (95% CI 0.80 to 1.07) and 0.70 times lower for uninsured women as compared with privately and publicly insured women (95% CI 0.69 to 0.72). The lower odds were noticed across all subgroups of studies in subgroup analyses as well as in crude analyses.
Context
To our knowledge, this is the first meta-analysis that examines CS rates of uninsured women compared with insured women. Two recently published meta-analyses by our group reported the association of CS with for-profit status of hospitals and type of insurance.17 216 Investigating the association of for-profit versus non-profit status of hospital with the odds of CS, we found that the odds of CS were 1.41 higher in for-profit hospitals as compared with non-profit hospitals (95% CI 1.24 to 1.60).216 The findings were consistent in subgroup analyses.216 Investigating the association of CS with private insurance, we found that the odds of CS were 1.13 times higher for privately insured women compared with women covered with public insurance (95% CI 1.07 to 1.18).17 Again, the increased risk was observed across all subgroups.17
Strengths and limitations
The major strengths of our meta-analysis include an extensive literature search, screening and data extraction performed in duplicate, review and analysis of study characteristics as well as thorough quality assessment of included studies. In addition, all studies are from one country, that is, the USA, and this limits the effect of contextual factors. A major limitation is the variation across studies, in terms of the study populations characteristics (ie, parity, inclusion of women with previous CS, risk for CS), type of data used, types of CS analysed and adjusting variables used in statistical analyses. The results of this study are driven by the largest study which contains over two-thirds of the population included in this review. Only 5 out of 16 studies included in the review report data after year 2000. It should also be taken into consideration, that despite similar features, the uninsured are a diverse group of US citizens.26 27 We considered but could not make use of the Robson criteria to classify studies and analyse CS rates among the studies reviewed. Only 2 out of 16 studies could be classified using the Robson criteria.62 214 While a population-level CS rate of less than 9%, 10% or 19% suggests underuse, we cannot determine the mix of under, over and appropriate use in a specific population.
Mechanism
There are several possible explanations why uninsured women have lower odds of CS when compared with insured women. One likely factor is that financial incentives are stronger with private insurance than in the publicly insured or uninsured.17 18 These incentives result from higher payment for CS by private insurers, reimbursement arrangements that encourage more expensive procedures as means to increase profits, as well as providers’ (hospitals and individual physicians) responses to these incentives.17 70 216 The responses to incentives by hospitals exist in the form of patient scheduling policies that direct privately insured patients to profit inclined physicians.20 216 It is also a known that physicians who have a higher share of privately insured patients will tend to overuse CS.21 22 216 They do so as they perceive patients to have a higher social class, that is, able to pay higher fees or fear malpractice liability.18 111 208 216
Additional reasons are likely reflected in the comparison between uninsured and publicly insured women. A first set of reasons are related to deliberate or forced decisions of uninsured women to keep out-of-pocket payments low.18 The uninsured patients are more likely to seek less expensive care when they face the need for healthcare services.18 In the case of giving birth, this would lead to a greater preference for vaginal delivery. A second set of reasons may be discrimination of providers towards uninsured women. Providers prefer profitable, privately insured patients, a preference commonly referred to as ‘cream skimming’.21 22 216 217
Implications for uninsured women
Most studies included in our meta-analysis, including the most recent studies from California213 and Florida,214 show that rates for CS among uninsured women are below or close to the 10% and 19% benchmarks.6–8 Even in instances where the average state rates are slightly above the 19% benchmark, some hospitals service areas are likely to have CS rates lower than 19% or even 9% for uninsured women because of the well established within state variation in CS rates.5 111 Uninsured women in these areas are highly likely to be underserved with CS during delivery. Uninsured patients generally have higher unmet needs than insured patients due to access barriers.23 24 26 28 218–222 Such barriers encourage inappropriate health seeking behaviours among uninsured.23–25 32 220 223–225 Consequently, uninsured populations face higher health risks and have worse healthcare outcomes.23–26 32 218–221 223 224 226 227
The uninsured also face financial burdens which result from out-of-pocket payments that are more severe/extensive than copayments or premiums that are paid by people that are publicly or privately insured. The uninsured are known to pay higher prices for services as compared with other payers for the same care,27 228 spend a high portion of income to cover medical expenses24 (although they spend less on their health compared with patients who have insurance),26 are frequently charged for full price for healthcare services,24 228 often do not benefit from discounts from providers24 27 and face severe financial difficulties.23 24 Uninsured manage to pay only part of the costs for their care.26 The remaining costs are uncompensated costs23 26 229 230 and most of such costs are covered by the local, state or federal government,26 229 eventually resulting in tax increases.26
Implications for research and policy-making
Future studies should examine the association of a lack of insurance in pregnant women across healthcare markets with varying CS rates and assess if delivery outcomes were correspondingly worse, in the effort to investigate the presence of underuse of CS.
In parallel, policy options that could lead to improvements of insurance coverage for delivering women should be assessed in terms of their ability to address healthcare outcomes while keeping overall costs at minimum. In the past, states have adopted different strategies for covering uninsured people.24 25 39 231 While there are many known benefits to insurance coverage,23 24 32–35 37 221 224 230 232–234 other important policy aspects should be considered. At a time of rising healthcare costs,24 35 234 235 the regulation of financial incentives is crucial. A revision of payment policies should be pursued17 18 24 216 to align financial incentives with proper health outcomes.17 24 216 Reimbursement policies that would pay the same amount for CS and vaginal delivery is one option.216 236
Conclusion
CSs are less likely to be performed in uninsured women as compared with insured women. The lower odds are consistent in all subgroups and in crude analyses. While the higher rates for CS among privately insured women can be explained with financial incentives associated with private insurance, the lower odds among uninsured women draw attention at barriers to access for delivery care. In many regions, the rates for uninsured women are above, close or below the benchmarks for appropriate CS rates and imply both, underuse and overuse. Therefore, efforts to assess the delivery outcomes as well as policy options that could improve insurance coverage for women giving birth are important.
Acknowledgments
We thank Doris Kopp and Beatrice Minder for their valuable help during development of the search strategy, Arjana Shala for her help with literature search and Hossein Meyer-Troeltsch and Rand Engel for their support with editing.
References
- 1.↵
- 2.↵
- 3.↵
- 4.↵
- 5.↵
- 6.↵
- 7.↵
- 8.↵
- 9.↵
- 10.↵
- 11.↵
- 12.↵
- 13.↵
- 14.↵
- 15.↵
- 16.↵
- 17.↵
- 18.↵
- 19.↵
- 20.↵
- 21.↵
- 22.↵
- 23.↵
- 24.↵
- 25.↵
- 26.↵
- 27.↵
- 28.↵
- 29.↵
- 30.↵
- 31.↵
- 32.↵
- 33.↵
- 34.↵
- 35.↵
- 36.↵
- 37.↵
- 38.↵
- 39.↵
- 40.↵
- 41.↵
- 42.↵
- 43.↵
- 44.↵
- 45.↵
- 46.↵
- 47.↵
- 48.↵
- 49.↵
- 50.↵
- 51.↵
- 52.↵
- 53.↵
- 54.↵
- 55.↵
- 56.↵
- 57.↵
- 58.↵
- 59.↵
- 60.↵
- 61.↵
- 62.↵
- 63.↵
- 64.↵
- 65.↵
- 66.↵
- 67.↵
- 68.↵
- 69.↵
- 70.↵
- 71.↵
- 72.↵
- 73.↵
- 74.↵
- 75.↵
- 76.↵
- 77.↵
- 78.↵
- 79.↵
- 80.↵
- 81.↵
- 82.↵
- 83.↵
- 84.↵
- 85.↵
- 86.↵
- 87.↵
- 88.↵
- 89.↵
- 90.↵
- 91.↵
- 92.↵
- 93.↵
- 94.↵
- 95.↵
- 96.↵
- 97.↵
- 98.↵
- 99.↵
- 100.↵
- 101.↵
- 102.↵
- 103.↵
- 104.↵
- 105.↵
- 106.↵
- 107.↵
- 108.↵
- 109.↵
- 110.↵
- 111.↵
- 112.↵
- 113.↵
- 114.↵
- 115.↵
- 116.↵
- 117.↵
- 118.↵
- 119.↵
- 120.↵
- 121.↵
- 122.↵
- 123.↵
- 124.↵
- 125.↵
- 126.↵
- 127.↵
- 128.↵
- 129.↵
- 130.↵
- 131.↵
- 132.↵
- 133.↵
- 134.↵
- 135.↵
- 136.↵
- 137.↵
- 138.↵
- 139.↵
- 140.↵
- 141.↵
- 142.↵
- 143.↵
- 144.↵
- 145.↵
- 146.↵
- 147.↵
- 148.↵
- 149.↵
- 150.↵
- 151.↵
- 152.↵
- 153.↵
- 154.↵
- 155.↵
- 156.↵
- 157.↵
- 158.↵
- 159.↵
- 160.↵
- 161.↵
- 162.↵
- 163.↵
- 164.↵
- 165.↵
- 166.↵
- 167.↵
- 168.↵
- 169.↵
- 170.↵
- 171.↵
- 172.↵
- 173.↵
- 174.↵
- 175.↵
- 176.↵
- 177.↵
- 178.↵
- 179.↵
- 180.↵
- 181.↵
- 182.↵
- 183.↵
- 184.↵
- 185.↵
- 186.↵
- 187.↵
- 188.↵
- 189.↵
- 190.↵
- 191.↵
- 192.↵
- 193.↵
- 194.↵
- 195.↵
- 196.↵
- 197.↵
- 198.↵
- 199.↵
- 200.↵
- 201.↵
- 202.↵
- 203.↵
- 204.↵
- 205.↵
- 206.↵
- 207.↵
- 208.↵
- 209.↵
- 210.↵
- 211.↵
- 212.↵
- 213.↵
- 214.↵
- 215.↵
- 216.↵
- 217.↵
- 218.↵
- 219.↵
- 220.↵
- 221.↵
- 222.↵
- 223.↵
- 224.↵
- 225.↵
- 226.↵
- 227.↵
- 228.↵
- 229.↵
- 230.↵
- 231.↵
- 232.↵
- 233.↵
- 234.↵
- 235.↵
- 236.↵
Footnotes
Contributors IH, DCG and PJ conceived and designed the study. IH and MB performed the data extraction and preparation. IH and LS analysed the data. IH, MB and LS drafted the paper, which was critically reviewed and approved by all authors.
Funding The authors have not declared a specific grant for this research from any funding agency in the public, commercial or not-for-profit sectors.
Competing interests None declared.
Provenance and peer review Not commissioned; externally peer reviewed.
Data sharing statement No additional unpublished data are available from the study.
Patient consent for publication Not required.