Article Text

Abstract
Objectives To assess changes in the frequency of vitamin D testing and detection of moderate/severe vitamin D deficiency (<30 nmol/L) among adults after the introduction of new Medicare Benefits Schedule (MBS) rebate criteria (November 2014), and their relationship to sociodemographic and clinical characteristics.
Design Dynamic (open) cohort study
Setting Primary care
Participants About 1.5 million ‘active’ patients aged 18+ years visiting a general practitioner and included in the National Prescribing Service MedicineInsight database.
Outcome measures The frequency of vitamin D testing (per 1000 consultations) and moderate/severe vitamin D deficiency (%) recorded between October 2013 and March 2016, stratified by the release of the new MBS criteria for rebate.
Results More patients were female (57.7%) and 30.2% were aged 60+ years. Vitamin D testing decreased 47% (from 40.3 to 21.4 tests per 1000 consultations) after the new MBS criteria, while the proportion of tests with no indication for being performed increased from 71.3% to 76.5%. The proportion of patients identified as moderate/severe vitamin D deficient among those tested increased from 5.4% to 6.5%. Practices located in high socioeconomic areas continued to have the highest rates of testing, but moderate/severe vitamin D deficiency detection remained 90% more frequent in practices from low socioeconomic areas after the rebate change. Furthermore, the frequency of individuals being tested was reduced independent of the patients’ sociodemographic or clinical condition, and the gap in the prevalence of vitamin D deficiency detection between those meeting or not meeting the criteria for being tested remained the same. Moderate/severe vitamin D deficiency detection decreased slightly among patients with hyperparathyroidism or chronic renal failure.
Conclusions Although the new criteria for rebate almost halved the frequency of vitamin D testing, it also lessened the frequency of testing among those at higher risk of deficiency, with only a small improvement in vitamin D deficiency detection.
- evidence-based medicine
- vitamin D
- general practice
- diagnostic tests, routine
- medical records
This is an open access article distributed in accordance with the Creative Commons Attribution Non Commercial (CC BY-NC 4.0) license, which permits others to distribute, remix, adapt, build upon this work non-commercially, and license their derivative works on different terms, provided the original work is properly cited, appropriate credit is given, any changes made indicated, and the use is non-commercial. See: http://creativecommons.org/licenses/by-nc/4.0/.
Statistics from Altmetric.com
Strengths and limitations of this study
The study includes information about 1.5 million adult patients and 13 million consultations extracted from electronic medical records in Australian general practice.
We explored not only changes in the frequency of vitamin D testing and the proportion identified as being deficient, but also if the introduction of new national criteria for rebate resulted in increased testing in those at higher risk of vitamin D deficiency.
Data is based on ‘real-world’ information recorded by general practitioners, and the quality or accuracy of recording might be affected by clinician behaviour, the health information system used in each general practice and the algorithms used for data extraction.
Introduction
Vitamin D is a fat-soluble vitamin that mediates intestinal calcium absorption, having a central role in calcium homeostasis and bone mineralisation.1–3 The principal natural source of vitamin D in humans is the skin through exposure to ultraviolet-B, but it can be also obtained from some foods and oral supplements. The principal consequences of vitamin D deficiency are osteomalacia and rickets in children and osteoporosis and fractures in adults. However, vitamin D deficiency has also been linked to an increased risk of non-skeletal conditions, such as diabetes mellitus, cardiovascular disease, depression, respiratory tract infections and cancer.2–5
Given the potential detrimental effects on skeletal and body health, it is of some concern that an estimated 31% of adults in Australia have some level of vitamin D deficiency (levels<50 nmol/L). A similar prevalence has been reported in other high-income countries.4 6 7 However, vitamin D deficiency is more frequent among certain groups, including older individuals, those with darker skin colour, people living at higher latitudes, those who have reduced sun exposure, with a lower socioeconomic position, a chronic condition (eg, malabsorption and chronic renal failure), obesity or using medication that interferes with the metabolism of vitamin D.2–4 6 8–13 These high figures could partially explain the increased number of vitamin D tests reported in several high-income countries.3 In Australia, requests for vitamin D testing increased from 0.4 tests/1000 individuals in 2000 to 36.5/1000 individuals in 2011 (80% of them requested by general practitioners [GPs]).3 14 15 As a consequence, the cost of vitamin D testing to the Australian government increased from $1.0 million to $95.6 million in the same period (0.4% of Australian health expenditure on medical services or 0.07% of total health expenditure in 2011), but with minimal known benefit on health outcomes.3 14 16
Before 2014, multiple guidelines and position statements regarding vitamin D testing were published in Australia: Royal College of Pathologists of Australasia, Royal Australian College of General Practitioners, Australian and New Zealand Bone and Mineral Society, and Endocrine Society of Australia and Osteoporosis Australia.17 However, there was no consensus on the procedures to be followed in clinical practice for testing; although all of them indicated screening was not recommended. With the aim to reduce unnecessary vitamin D testing, a 2014 review published by the Medicare Benefits Schedule (MBS, services subsidised by the Australian government) recommended targeting high-risk patients instead of population screening. The review suggested new, more restrictive, criteria for rebate.10 15 A few months after the introduction of the new MBS criteria for rebate (November 2014), there was a considerable reduction in the number of vitamin D tests ordered (14.4/1000 individuals), representing 42% savings of direct annual health costs (~$39.5 million).15 However, even though this new health policy almost halved health expenditure for vitamin D testing, no study has ‘shed light on the appropriateness of testing’.3
Using a large longitudinal dataset from MedicineInsight (a national general practice data programme developed and managed by the National Prescribing Service [NPS] MedicineWise with funding support from the Australian Government Department of Health),18 we sought to better understand the implications of the new MBS criteria for vitamin D testing. MedicineInsight extracts whole-of-practice de-identified data from the clinical information systems (CIS) of over 650 consenting general practices across Australia including 3.8 million patients. The main aim of our study was to explore how the new MBS criteria affected the frequency of vitamin D testing and the detection of deficiency, the relationship of vitamin D testing to socioeconomic factors and if the policy resulted in increased testing in those at higher risk of vitamin D deficiency.
Methods
Data source
We used data from the NPS MedicineWise MedicineInsight programme (the MedicineInsight programme is described at http://www.nps.org.au/medicine-insight). MedicineInsight extracts de-identified, whole-of-practice data, from a practice’s CIS when it joins MedicineInsight. The extraction tool then collects additional data regularly, creating a longitudinal database in which patients can be tracked over time. MedicineInsight has over 650 consenting general practices, 3300 GPs and data on 3.8 million patients. All Australian states and regions are represented and practices varying in size, billing methods and type of services offered are included. Patients in the database are comparable to the general population as measured by sociodemographic variables and clinical conditions. Details of the data collection process have been published elsewhere.18–20
Routinely collected information includes demographics (gender, ethnicity, indigenous status, year of birth and postcode), clinical information (diagnoses and reasons for consultation), prescribed medications (including reasons for prescription, known allergies or drug reactions), laboratory/pathology test reported results, clinical measurements (temperature, blood pressure, weight, height and waist circumference) and smoking status.
Sample selection
Of the 1 500 360 ‘active’ patients aged ≥18 years, available in the MedicineInsight database for the period October 2013 to March 2016, 2.8% were excluded because neither a diagnosis or reason for encounter had been recorded for that period. ‘Active’ patients were defined as having three or more visits to the practice in the past 2 years. To improve data quality, practices were included in the study if they: were established for two or more years before the end of the analysis period; had no interruptions in data for more than 2 months; had recorded data (history item, reason for encounter or reason for prescription) in at least 10% of encounters and had an average of at least 30 prescriptions per week.21–24 Therefore, this dynamic (open) cohort study included 1 458 350 active adult patients attending 4668 GPs in 329 MedicineInsight participating general practices across Australia.
Patient involvement
Only secondary and de-identified data was used in this study. Therefore, there was no patient involvement in this research.
Outcome
Vitamin D testing (yes/no), vitamin D levels (nmol/L) and date of the test were obtained from the laboratory reported results. Most Australian practices receive these results electronically, which are downloaded directly into the CIS and recorded using Logical Observation Identifiers Names and Codes.18 On the basis of available results, the bone-centric recommendation of serum 25-hydroxyvitamin D (25-OH-D) levels<50 nmol/L (<20 ng/mL) was considered as the threshold for vitamin D deficiency (any deficiency level), while a value <30 nmol/L (<12 ng/mL) was considered as moderate/severe deficiency, following recommendations of the Australian Department of Health, the Australian and New Zealand Bone Mineral Society and the Endocrine Society of Australia and Osteoporosis Australia.3 9 11
Covariates
Practice’s data obtained from the MedicineInsight included state (New South Wales, Victoria [VIC], Queensland, Western Australia, Tasmania [TAS], South Australia [SA], Australian Capital Territory and North Territory [NT]), rurality (major cities, inner regional, outer regional and remote/very remote) and the Index of Relative Socio-Economic Advantage and Disadvantage (IRSAD) quintiles. IRSAD is a macroeconomic indicator of relative economic and social advantage/disadvantage position within an area compared with the rest of the country.25 Therefore, a higher IRSAD quintile indicates the practice is located in a more advantaged area.
Patients’ sociodemographic characteristics included sex (male/female), age (obtained as groups of 10-year categories), rurality (same categories as for the practice data), ethnicity (Aboriginal or Torres Strait Islander [TSI], yes/no), pension (none, pensioner or healthcare card owner, Department of Veterans Affair [DVA]), IRSAD quintiles and smoking status (non-smoker, ex-smoker and current smoker).
Patients who had a recorded medical history that was consistent with the new MBS clinical criteria to assess overall vitamin D status (online supplementary table S1) were identified from the MedicineInsight database using an algorithm that included all medical diagnosis, reasons for encounter with the GP, laboratory test results and prescribed medications. The investigated criteria included (1) a history of osteoporosis/osteomalacia, (2) high alkaline phosphatase with normal liver function tests, (3) hyperparathyroidism, hypocalcaemia, hypercalcaemia or hypophosphataemia, (4) malabsorption, (5) use of medication that interferes with 25(OH)D metabolism or (6) chronic renal failure.10 Furthermore, a previous diagnosis of vitamin D deficiency was also included as an additional criterion, as monitoring 25(OH)D levels is indicated to assess treatment effectiveness.2 9
Supplemental material
For medical diagnosis and reason for encounters, although GPs are encouraged to complete all these fields every time they see a patient using the available medical coding vocabulary at the practice (ie, ‘DOCLE’ and ‘PYEFINCH’), their use is not mandatory and clinicians can enter medical terms as free text.18 For that reason, different synonyms were used to identify positive cases of osteoporosis/osteomalacia, hyperparathyroidism, hypocalcaemia, hypercalcaemia, hypophosphatemia, malabsorption, chronic renal failure, renal transplant or vitamin D deficiency. When the diagnosis or reason for the encounter was recorded as ‘unconfirmed’ (eg, ‘suspected’ or ‘under investigation’) or as a ‘family history’, the individual was considered as negative for that condition.
Laboratory results were used to identify/confirm additional cases (increased alkaline phosphatase with normal liver function tests [liver glutamic oxaloacetic transaminase (GOT) / alanine transaminase (ALT) and glutamic pyruvic transaminase (GPT) / aspartate transaminase (AST)], hyperparathyroidism, hypocalcaemia, hypercalcaemia or hypophosphatemia). A test result 10% higher/lower than the upper/lower limit established by the laboratory was used as the threshold of abnormality, in order to reduce the number of false positives and increase the specificity of the results (ie, a better ‘rule-in’ test).26
Because the new MBS criteria for rebate did not include a list of medications that might decrease 25(OH)D levels,10 we obtained that list from the literature.8 17 It included antiepileptics (eg, phenytoin and carbamazepine), glucocorticoids (eg, prednisolone and dexamethasone), bisphosphonates, antiretrovirals (eg, ritonavir and saquinavir), cytostatic agents (eg, cyclophosphamide and tamoxifen) and antiestrogens drugs (eg, cyproterone acetate). Considering the effects of these drugs on 25(OH)D levels are related to long-term therapies,8 9 we considered a patient as ‘positive’ for medication use when they received a prescription for a period ≥30 days.
Statistical analysis
Two different group of analyses were performed: (1) practice results, which included the number of vitamin D testings per 1000 consultations and the percentage of these tests (%) with a ‘positive’ result for vitamin D insufficiency (<50 nmol/L) or moderate/severe deficiency (<30 nmol/L) and (2) patient results, the prevalence (%) of individuals tested for vitamin D levels and the prevalence of moderate/severe vitamin D deficiency (<30 nmol/L) among those tested. These results were presented graphically by the trimester of the year (October/December 2013 to January/March 2016; release of the new MBS criteria for rebate in November 2014). Findings were also analysed according to the presence, or not, of some of the MBS criteria for vitamin D testing.10
The association between the practice characteristics and the frequency of vitamin D testing (per 1000 consultations) and the percentage with a ‘positive’ result for vitamin D deficiency were assessed using multiple logistic regression (mutual adjustment between state, rurality and IRSAD) and stratified by the date of release of the new MBS criteria for rebate. A similar procedure was used to evaluate the association between patient characteristics (sociodemographic and clinical) and the prevalence of vitamin D testing and deficiency. In this case, sociodemographic variables were mutually adjusted for the practice’s characteristics, and the patient’s length in that practice (as it might affect the frequency of vitamin D testings).27 Smoking and clinical conditions were also mutually adjusted for the above-mentioned variables.
All analyses were performed in STATA V.15.0. Analyses focused on the individual (prevalence) considered the cluster (general practices) and sampling weights (inverse of the individual’s probability of being in the sample=1/average annual number of contacts with the general practice) for data correction.19
Results
The final sample consisted of 1 458 350 adults (57.7% females; 30.2% aged ≥60 years) and 13 169 066 consultations for the specified period (median of 3.0 GP consultations/year per patient; interquartile range 2.0; 9.0). Additionally, 64.9% of participants had visited the GP both before and after the introduction of the new MBS criteria for rebate (November 2014). The percentage of patients with no diagnosis or reason for encounter recorded (2.8% of active patients in the MedicineInsight dataset) was similar in all sociodemographic groups; although a higher frequency of missing data was observed in NT (10.7%).
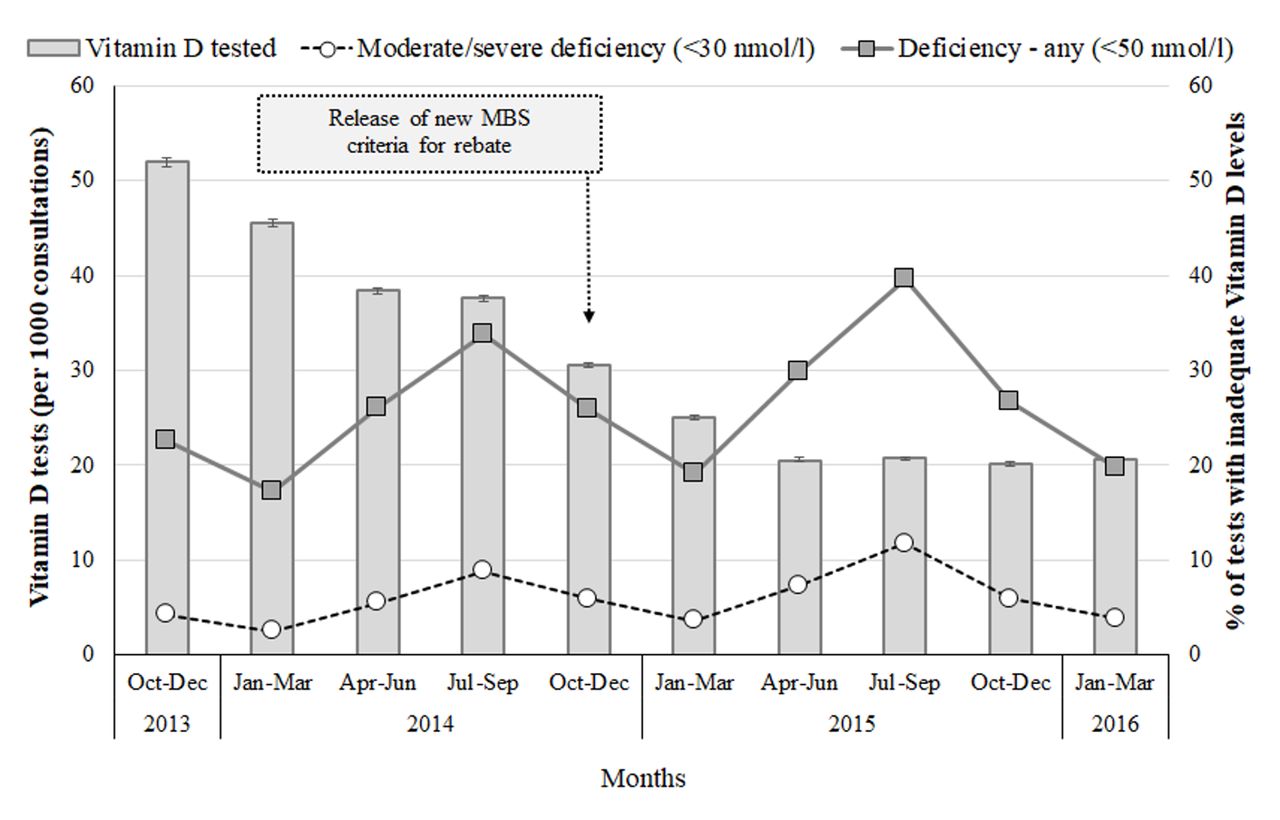
Figure 1 shows that the frequency of vitamin D testing had already decreased from 52.0 per 1000 consultations in October–December 2013 to 30.5 per 1000 consultations by the time the new MBS criteria were released; it then steadied at around 20.5 per 1000 consultations during the following year. However, the pattern of vitamin D deficiency (either <50 nmol or <30 nmol/L) among those tested remained stable over time (a peak in July–September [winter] and a trough in January–March [summer]), with a slight increase (11%–17%) observed in 2015 compared with the same months in 2014.

Frequency of vitamin D testing (per 1000 consultations—columns) and percentage of tests with vitamin D deficiency (%—lines). The n=13 169 066 consultations for 1 458 350 adults (18+ years) who attended one of 329 Australian general practices included in the MedicineInsight database between 2013 and 2016. Vertical lines represent 95% CI.
Therefore, although the overall frequency of vitamin D testing was reduced by 47% after the release of the new MBS criteria for rebate (from 40.3 to 21.4 per 1000 consultations), the proportion of these tests not matching the criteria increased from 71.3% to 76.5% (figure 2). However, the percentage of tests demonstrating vitamin D deficiency or mild/moderate deficiency showed a small increase (from 25.1% to 27.1% and 5.4% to 6.5%, respectively) (table 1, online supplementary tables S2 and S3).

Percentage of tests according to the presence or absence of reasons for routine vitamin D testing. The n=13 169 066 consultations for 1 458 350 adults (18+ years) who attended one of 329 Australian general practices included in the MedicineInsight database between 2013 and 2016. Medicare Benefits Schedule criteria for routine vitamin D testing included a history of osteoporosis/osteomalacia, high alkaline phosphatase, hyperparathyroidism, malabsorption, use of medication that interferes with 25(OH)D metabolism, chronic renal failure and/or a previous diagnosis of vitamin D deficiency.
Frequency of vitamin D testing (×1000 consultations) and vitamin D moderate/severe deficiency (%) by sociodemographic characteristics of the practice, stratified by the date of release of the new MBS criteria for rebate. The n=13 169 066 consultations for 1 458 350 adults (18+ years) who attended one of 329 Australian general practices participating in the MedicineInsight programme between 2013 and 2016
Despite the differences in the frequency of vitamin D testing by practice characteristics (higher in VIC, TAS and NT, major cities and 48% more frequent in the upper than in the lowest socioeconomic quintile), the reduction in the number of tests after the release of the new criteria for rebate was similar across all categories (ranging from 42% to 49%), except for SA and remote/very remote Australia, where the decrease was approximately 60%. TAS and remote Australia had the lowest vitamin D deficiency detection rates and fewer cases were detected after the new criteria for rebate were released. Although practices in the highest socioeconomic quintile continued to request more vitamin D tests, vitamin D deficiency was still 90% more frequent in the lowest quintile after November 2014.
The number of patients being tested for vitamin D deficiency who met the clinical criteria for rebate is shown in figure 3. Vitamin D testing before the new MBS rules was 30%–40% more frequent among those meeting the criteria compared with those who did not, and just 10%–20% more frequent in 2015. However, the gap in the prevalence of vitamin D deficiency (either <50 nmol/L or <30 nmol/L) between those with or without some clinical criteria for being tested remained relatively unchanged over time.

Frequency of vitamin D testing (%—columns) and prevalence of vitamin D deficiency (%—lines) among those tested by the presence or absence of reasons for routine vitamin D testing. Adults (18+ years) who attended one of the 329 Australian general practices participating in the MedicineInsight programme (n=1 458 350) between 2013 and 2016. Medicare Benefits Schedule criteria for routine vitamin D testing included a history of osteoporosis/osteomalacia, high alkaline phosphatase, hyperparathyroidism, malabsorption, use of medication that interferes with 25(OH)D metabolism, chronic renal failure and/or a previous diagnosis of vitamin D deficiency. Vertical lines represent 95% CI.
Table 2 shows the prevalence of vitamin D testing and moderate/severe deficiency detection according to the individuals’ sociodemographic and clinical characteristics. Before the release of the new criteria, vitamin D testing (overall cumulative frequency of 16.3% for the period October 2013 to November 2014) was markedly more frequent in females and the elderly, but the prevalence of moderate/severe vitamin D deficiency detection among those tested (overall prevalence 6.1%) was more frequent in males and the youngest age groups. Differences in the prevalence of vitamin D testing according to other sociodemographic characteristics were less evident, but moderate/severe vitamin D deficiency detection was more frequent among those living in major cities, Aboriginal or TSIs, pensioners, lower socioeconomic or ex-smokers. Vitamin D testing was also more frequent among those with a previous diagnosis of vitamin D deficiency (74.0%), with hyperparathyroidism (44.7%), elevated alkaline phosphatase levels (32.0%) or osteoporosis/osteomalacia (24.6%). Nonetheless, moderate/severe vitamin D deficiency detection among those with osteoporosis/osteomalacia (3.5%), high alkaline phosphatase levels (4.8%) or hyperparathyroidism (5.1%) was even less common than among those without any of the criteria for being tested (5.6%).
Frequency of vitamin D testing (%) and prevalence of moderate/severe deficiency (%) among those tested by individual characteristics, stratified by the date of release of the new MBS criteria for rebate. Adults (18+ years) who attended one of the 329 Australian general practices participating in the MedicineInsight programme (n=1 458 350) between 2013 and 2016
After the release of the new criteria for rebate (period December 2014 to March 2016), there was a 44% reduction in the cumulative percentage of patients being tested for vitamin D (from 16.3% to 9.1%), while there was a small increase in the prevalence of moderate/severe deficiency detection among those tested (from 6.1% to 7.1%). A higher reduction in the percentage of patients being tested was observed among individuals aged 70+ years (>50% reduction), while a lower reduction occurred among those with osteoporosis/osteomalacia, increased alkaline phosphatase or with a previous diagnosis of vitamin D deficiency (~30% reduction). On the other hand, moderate/severe vitamin D deficiency detection remained steady or slightly reduced among individuals aged 20–59 years, Aboriginals or TSIs, DVAs, ex-smokers, with hyperparathyroidism, or chronic renal failure. Moderate/severe vitamin D deficiency detection continued to be about 30% more frequent in individuals from the lowest compared with the highest socioeconomic quintile.
All associations with sociodemographic and clinical conditions, as well as the changes observed after the introduction of the new MBS criteria, were similar when the analyses were replicated considering vitamin D deficiency (<50 nmol/L) as the investigated outcome (online supplementary tables S2 and S3).
Discussion
Our study aimed to investigate whether the introduction of new Australian criteria for rebate, vitamin D tests resulted in less testing, benefited those at a higher risk of vitamin D deficiency or improved detection of deficiency. Five main findings can be highlighted. First, although the number of vitamin D tests almost halved after the introduction of the new MBS criteria, only a small improvement in the detection of deficiency occurred. Second, practices located in the highest socioeconomic quintile continued to have the highest rates of vitamin D testing, but the proportion of deficiency detection remained almost twice as frequent in practices located in the lowest socioeconomic areas. Third, the frequency of patients being tested was reduced among those at higher risk of vitamin D deficiency, which was not the intention of the change. Fourth, despite a small increase in the detection of vitamin D deficiency, the gap between those meeting or not meeting the criteria for being tested remained steady. Finally, detection of vitamin D deficiency decreased in some high-risk groups, including those with a diagnosis of hyperparathyroidism or chronic renal failure. Again, this was an unintended consequence of the new MBS criteria.
Diverse strategies that aimed to tackle the increased number of vitamin D tests and related costs have recently been adopted by Canada, the USA, the UK, France, Italy and Australia.3 15 28–30 As a result, a reduction of up to 25% in the number of vitamin D tests performed have been reported in studies from the USA and Italy.3 10 15 28–30 In Australia, a study conducted in 2016, using MBS data, showed the number of vitamin D tests had almost halved just a few months after the introduction of the new criteria for Medicare rebate, with an expected saving of approximately $64 million annually.15 This result is consistent with our findings using general practice data from the MedicineInsight programme. However, apart from studies showing a reduction in healthcare costs, no one has investigated the impact of such policy changes on the appropriateness of vitamin D testing at a national level.3 15 In fact, our results demonstrate that the proportion of tests without any indication increased after the release of the new MBS criteria. Moreover, there was only a small improvement in the detection of vitamin D deficiency. Socioeconomic disparities continued and the frequency of testing reduced in all groups at risk of vitamin D deficiency, including Aboriginal and TSIs, for whom testing was recommended in the revised criteria.
Although no other national study was found for comparison, the performance of this new Australian health policy in improving the adequacy of vitamin D testing is not surprising. A survey conducted in 2009 of 500 GPs showed that only 20% had read an Australian position statement on sun exposure and vitamin D released the previous year. The survey also found that 68% of GPs said that the information they received, from that or any other source, did not affect their practice.31 A similar figure was observed in the USA, where only a small increase in access to information regarding vitamin D guidelines was observed (from 27.4 times/month to 35.0 times/month; n=1200 clinicians) after new rules for testing were implemented.29
Therefore, it is not surprising that although 31% of adults in Australia have some level of vitamin D deficiency,13 testing was only 21.4 per 1000 consultations after the new MBS criteria, with a cumulative percentage of 9.1% of patients tested, and no substantial improvement in vitamin D deficiency detection, even among those with some clinical indication. Diverse factors may be responsible for the low frequency and adequacy of test requests, including unfamiliarity with current recommendations, physicians’ resistance to change, coexistence of conflicting recommendations and practice guidelines,3 9 11 lack of tools to help with the decision making, as well as patient characteristics (ie, more frequent tests among females, migrants, elder patients and unemployed, with multiple comorbidities) and practice profile.3 11 31–34 As suggested by Australian GPs, patient request is also, anecdotally, a factor.
According to our results, geographic characteristics also influence the frequency of vitamin D testing, as more tests were performed among those living in major cities or in NT, VIC or TAS, either before or after the release of the new MBS criteria. The higher prevalence of vitamin D deficiency at southerner latitudes6 could explain the higher frequency of testing in VIC and TAS. Nonetheless, better performance was observed in SA (another southern Australian state), as the number of tests was reduced by 60% and the detection of moderate/severe vitamin D deficiency increased by 44% after the new MBS criteria were introduced. On the other hand, the highest frequency of vitamin D testing in the NT could be related to the higher proportion of Aboriginal and TSI living there (25.5% compared with the national 2.8%)35 as individuals with darker skin colour are at risk of vitamin D deficiency.2–4 8–10 Nonetheless, this hypothesis is not supported by our results, as the frequency of testing was not more frequent overall in Indigenous than in non-Indigenous people.
Despite all these possible barriers, some successful interventions have been instituted in different practice settings with the aim of improving the appropriateness of vitamin D testing.3 In the USA, the implementation of a decision support tool in an electronic medical record health system led to a 31% reduction in the proportion of inappropriate vitamin D tests (from 43.8% to 30.3%), while appropriate screening tests increased from 56.2% to 69.7%.29 Such computerised clinical decision support systems have been found to modify clinicians test-ordering behaviour, optimise clinical time and improve the adequacy of testing.36 37 Additionally, direct physician feedback (ie, a phone call and computer message when a new vitamin D test was ordered less than 90 days after a similar previous test) and patient and clinician education have been found to be effective in improving the appropriateness of vitamin D testing.3 30 38
Finally, standardisation of current guidelines and procedures regarding vitamin D testing and management could be beneficial in clinical practice.3 In fact, there is emerging evidence suggesting higher vitamin D thresholds should be recommended for optimal health. International standards have suggested levels of at least 75 nmol/L for preventing non-skeletal conditions, such as premature mortality, depression, diabetes or cardiovascular disease, while higher levels have been found to prevent falls, respiratory tract infections and cancer.2 3 Further studies should be undertaken to identify the suitability and effectiveness of such strategies.
Strengths and limitations
This study included a very large sample size of adults (1.5 million and 13 million consultations) and general practices from all Australia. Additionally, multiple strategies were used to improve data quality (ie, different fields used for data extraction, variability of terms and synonyms).39 Furthermore, unlike previous reports, our study investigated not only the frequency of vitamin D testing, but also the prevalence of vitamin D deficiency, the indication for these tests and the association with sociodemographic and clinical characteristics. Nonetheless, our study has some important limitations. First, MedicineInsight data are based on ‘real-world’ information recorded by GPs into a health informatics system for clinical and medicolegal purposes. Therefore, the quality, accuracy and completeness of recording may vary by clinician and CIS used in each general practice (ie, non-mandatory fields, free-text for coding and system coding vocabularies).21–24 40 It is likely that this will result in some under-reporting of clinical information, such as diagnoses, reasons for the encounter or medical history. However, less than 3% of data were excluded due to missing information, and these patients were comparable to the investigated sample according to sex, age, rurality, socioeconomic position or percentage of Aboriginal and TSI. Second, the algorithms used for data extraction have not been validated, which could also affect the accuracy of the information.39 Finally, MedicineInsight uses a non-random sampling process to recruit the practices, and systematic sampling differences between states/territories and regions cannot be ruled out. Even so, the distribution of the sample closely resembles figures from the last Australian census.18 35
Conclusions
Although the new criteria for rebate almost halved the frequency of vitamin D testing, it also lessened the frequency of testing among those at highest risk of deficiency, increased the proportion of tests with no indication for being performed, and resulted in only a small improvement in the detection of vitamin D deficiency. Therefore, despite a marked reduction in healthcare costs, the introduction of the new MBS criteria for rebate resulted in some unintended consequences: the changes did not improve the appropriateness of vitamin D testing, did not provide additional benefits for those at a higher risk of vitamin D deficiency and did not reduce health disparities in Australian general practice. Further studies could explore the ongoing, non-financial, health costs of these changes and develop practice, GP and patient-centric interventions to improve the appropriateness of vitamin D testing.
Supplemental material
Supplemental material
Acknowledgments
The author acknowledges NPS MedicineWise for their support in the development of this research.
References
Footnotes
Contributors DGC and NS were both associated with generating the concept of this study. DGC was responsible for data extraction and analysis, and interpreting and presenting the results. DGC and NS contributed to preparing the publication manuscript. All authors have read and approved the final manuscript.
Funding The authors have not declared a specific grant for this research from any funding agency in the public, commercial or not-for-profit sectors.
Competing interests None declared.
Ethics approval As this study used existing and non-identifiable data, an ethical review was exempted by the Human Research Ethics Committee of the University of Adelaide.
Provenance and peer review Not commissioned; externally peer reviewed.
Data sharing statement No additional data are available, as the original dataset belongs to a third party.
Patient consent for publication Not required.