Article Text

Abstract
Objective To examine the prevalence, costs and trends (2010–2014) for 21 low-value inpatient procedures in a privately insured Australian patient cohort.
Design We developed indicators for 21 low-value procedures from evidence-based lists such as Choosing Wisely, and applied them to a claims data set of hospital admissions. We used narrow and broad indicators where multiple low-value procedure definitions exist.
Setting and participants A cohort of 376 354 patients who claimed for an inpatient service from any of 13 insurance funds in calendar years 2010–2014; approximately 7% of the privately insured Australian population.
Main outcome measures Counts and proportions of low-value procedures in 2014, and relative change between 2010 and 2014. We also report both the Medicare (Australian government) and the private insurance financial contributions to these low-value admissions.
Results Of the 14 662 patients with admissions for at least 1 of the 21 procedures in 2014, 20.8%–32.0% were low-value using the narrow and broad indicators, respectively. Of the 21 procedures, admissions for knee arthroscopy were highest in both the volume and the proportion that were low-value (1607–2956; 44.4%–81.7%).
Seven low-value procedures decreased in use between 2010 and 2014, while admissions for low-value percutaneous coronary interventions and inpatient intravitreal injections increased (51% and 8%, respectively).
For this sample, we estimated 2014 Medicare contributions for admissions with low-value procedures to be between $A1.8 and $A2.9 million, and total charges between $A12.4 and $A22.7 million.
Conclusions The Australian federal government is currently reviewing low-value healthcare covered by Medicare and private health insurers. Estimates from this study can provide crucial baseline data and inform design and assessment of policy strategies within the Australian private healthcare sector aimed at curtailing the high volume and/or proportions of low-value procedures.
- inappropriate care
- low-value care
- quality in health care
- choosing wisely
This is an open access article distributed in accordance with the Creative Commons Attribution Non Commercial (CC BY-NC 4.0) license, which permits others to distribute, remix, adapt, build upon this work non-commercially, and license their derivative works on different terms, provided the original work is properly cited, appropriate credit is given, any changes made indicated, and the use is non-commercial. See: http://creativecommons.org/licenses/by-nc/4.0/.
Statistics from Altmetric.com
Strengths and limitations of this study
We directly measured the prevalence and changes over time of 21 low-value procedures in a private health insurance claims data set.
We labelled low-value procedures based on published, clinical recommendations relevant to and observable in this data set.
We used broad and narrow indicators to estimate an interval of these low-value procedures to account for the trade-off between the sensitivity and specificity of the indicators in claims data.
Our investigation of low-value care is limited to inpatient care reimbursed by a subset of Australian private health insurers.
While these indicators provide baseline results for a broad range of procedures, these indicators have yet to be validated against other data sources.
Introduction
Low-value healthcare, or interventions that confer little or no benefit on patients while incurring avoidable cost,1 is primarily a patient safety concern with economic implications. Campaigns such as Choosing Wisely (CW) are drawing attention to low-value care.2 Despite this, only cursory insights into the scale of the problem are available, and most measurement research to date has focused on the extent of low-value care in routine practice within the USA.3 Understanding the scale of the problem in other countries, including Australia, and identifying which low-value services are most problematic are necessary in formulating actionable remedies. This requires baseline estimates of low-value service use across different healthcare settings.
This study focusses on low-value procedures provided during hospital admissions that are partially funded through private health insurance. While Australia has a government-funded healthcare system providing universal access to procedures in state-run public hospitals, Australians can choose (and are incentivised) to purchase supplementary ‘private health insurance’, which covers care provided by private practitioners during admissions in both private and public hospitals. In June 2014, 47% of Australians were members of a private health fund with hospital coverage.4 Private health insurance funded 57% of elective procedure admissions occurring in all public or private hospitals, which were also partly funded by Medicare (the federal government’s rebate system for medical services provided to private patients).5 The rates of low-value services provided within this large sector of the Australian healthcare system are unknown.
We directly measured low-value inpatient procedures provided within this private healthcare setting by applying definitions of low-value care developed from professionally led campaigns including CW. We adapted a method first developed in the US context6 and report the proportions of patients with admissions where they received these low-value procedures, along with the estimated costs of these procedures and changes in use over time.
Methods
Study population and data sources
Hospital and Medical Benefits System (HAMBS) supplied the claims and Hospital Casemix Protocol data7 on 376 354 patients with at least one hospital admission funded by 1 of 13 health insurance funds during full calendar years 2010–2014. This cohort was 54.7% female, and the mean (±SD) age was 47.5 (±21.6) years. This sample represents approximately 7% of the privately insured Australian population with an inpatient admission during the 5-year study period.4 In 2014, there were 141 244 patients in this cohort with hospital admissions across all Australian states and territories.
The data set uses Australian Classification of Health Interventions8 (ACHI) and/or the Medical Benefits Schedule9 (MBS) item numbers to detail procedures performed during an admission, and the International Classification of Diseases Australian Modification 10th edition (ICD-10-AM)10 to classify primary and secondary diagnoses. The claims data also details the charges to the insurance fund from the hospital and medical providers, as well as the Australian federal government’s contribution towards the medical costs of the admission (charges for privately admitted patients via Medicare), which is claimed using the recorded MBS item numbers.
Patient involvement
Patients were not directly involved in this project. However, patient and other groups have been heavily involved in various international CW campaigns, the recommendations from which are an important input to this study.
Indicators of low-value procedures
We based our low-value indicators on recommendations from the Royal Australasian College of Physicians EVOLVE campaign,11 the Australian CW campaign,2 CW campaigns from the USA, Canada, the UK,12–14 the National Institute of Health and Care Excellence do-not-do recommendations15 and an existing Australian low-value services list.16 The selection of recommendations is described in an associated methods paper.17 In brief, we selected recommendations from these sources if a) the procedures were eligible to be claimed to an Australian health insurance fund and b) the description of low-value procedure use was definable using the procedure and diagnosis codes routinely recorded within the claims data. These constraints precluded a large number of recommendations from our study, which is a common limitation when using direct measures in routinely collected data.18
We translated these recommendations into indicators of low-value procedures (see online supplementary table 1) based on (1) patients who received the procedure and (2) patients for whom the procedure would be likely to be low-value on the basis of their listed characteristics and clinical indication. As described by Schwartz et al,6 low-value service indicators have a sensitivity-specificity trade-off depending on the information in the data set, the interpretation of the low-value service recommendation/s and different recommendations relating to the same service. In cases where this trade-off existed, we applied a broad indicator to capture all potential instances of low-value procedures (ie, high sensitivity) and a narrow indicator to identify more certain instances of low-value procedures (ie, high specificity).
Supplemental material
For example, a vaginal or laparoscopic hysterectomy is usually preferable to an abdominal hysterectomy, the latter deemed a low-value procedure.16 The broad indicator for this low-value procedure was whenever a patient received an abdominal hysterectomy and had no record of a concurrent caesarean section or history of pelvic malignancy, where the abdominal approach may be justified. The narrow (more stringent) indicator also excluded patients with a record of either pelvic peritoneal adhesions or endometriosis.
Two investigators (KC, TB-P) selected relevant MBS, ACHI or ICD-10-AM codes for the indicators, with clinical input from two others (JB, IS). We used diagnosis codes recorded during the admission in which the procedure occurred, or during previously funded admissions (within 12 months of the admission). A more detailed description of how indicators were developed on the basis of expert clinician review can be found in our associated methods paper.17
Analysis
Following the framework on the direct measurement of low-value care described by Chalmers et al,19 here we report the ‘service-centric’ proportions of care (a measure of how many funded services were low-value) for all 21 procedures. Chalmers et al 19 also describe an alternative reporting perspective, the ‘patient-indication’ proportion, representing the proportion of patients with the low-value indication and potentially able to receive the procedure who actually received it. However, the denominator in this equation was not ascertainable for most of the 21 procedures, as not all potential patients would be admitted and recorded within this data set. As a secondary analysis presented in online appendix 1, we report the patient-indication proportions for the four investigated procedures where this was possible.
Supplemental material
Relative change in procedure use
We compared the proportion of low-value procedures in calendar year 2010 with that in 2014, with two exceptions: we reported changes in inpatient intravitreal injections from its introduction as an MBS item (and therefore approved for private health insurance funding) in 2012–2014; and percutaneous coronary interventions from 2011 to 2014 as this indicator required a longer period of look back for diagnoses and indications—more than 12 months before the procedure was undertaken—to determine if it was associated with a low-value indication.6 We used a Poisson general linear model for the number of patients with a low-value procedure, offset by the log of all patients with an admission in that year. We repeated this for the number of patients with the procedure (low-value or not) as a comparator. The 95% CIs for the estimated change in proportions came from 1000 random samples with replacement (bootstrap samples) of the observed data.
Costs of low-value procedure use
We reported total cost estimates for low-value procedures (for both broad and narrow indicators) where more than five patients had the low-value procedure in 2014, and where the procedure was the primary reason for the admission. Costs were estimated based on average admission charges (including charges from the hospital and medical providers, as well as prosthesis charges) to HAMBS funds and, separately, the Medicare benefit (the contribution from the Australian government) for admissions in facilities where the respective procedure was the primary procedure. These average admission charges for each year were supplied by the Australian Health Service Alliance, and we used these as a standardised charge for those admissions associated with a low-value procedure.
We used RStudio for all analyses.20
Results
Extent of low-value procedures in 2014
In 2014, 14 662 (10.4%) of all 141 244 unique patients with a hospital admission received at least one of the 21 procedures. Of these 14 662 patients, between 3044 (20.8%) and 4695 (32.0%) received a low-value procedure based on the narrow and broad indicators respectively (table 1 and figure 1). This equated to between 2.2% and 3.3% of all admitted patients (for any procedure) receiving a low-value procedure.
Low-value (LV) counts and percentage of patients with the LV procedure out of all patients with the procedure, for 21 hospital procedures

Indicators of 21 low-value procedures applied to a data set of health insurance claims. Broad (B) and narrow (N) indicators are used to identify low-value procedures based on differing recommendation/s. Results for procedures were categorised into four different groups depending on the numbers of patients with the procedure (high volume >100 procedures) and the proportion of low-value procedures (high proportion >10%). The Medicare (Australian government) contribution towards admissions with a low-value procedure in 2014 are shown for each category (*abdominal hysterectomy, adenoidectomy and inpatient intravitreal injections were not included in this total; all amounts are in Australian dollars). AU, Australia; CA, Canada; LV, low-value; PCI, percutaneous coronary interventions; pts, patients; UK, United Kingdom; US, United States; yr, year.
Knee arthroscopy revealed both high volumes and high proportions of low-value use (3620 patients; 44.4%–81.7% for narrow and broad indicators, respectively). Other high volume and proportional low-value use include abdominal hysterectomy (30.9%–79.9% of 298 patients), adenoidectomy performed during a tube insertion procedure (28.4% of 303 patients, based on one recommendation15 with only one indicator), spinal fusion for low back pain (1.5%–22.8% of 544 patients) and percutaneous coronary intervention (PCI) for patients with stable coronary disease (12.5%–12.7% of 881 patients). Use and low-value proportion of inpatient intravitreal injections was also high, with 427 (96.8%) of 441 patients in 2014 having an indication for which the procedure could have been safely conducted in an outpatient rather than inpatient setting.
Approximately 10% of endoscopies received by patients younger than 55 years were low-value (501 of 5021 patients), while 3.3% of colonoscopies for patients younger than 50 years were deemed low-value with a diagnosis of constipation (133 of 4017 patients).
Temporal trends in low-value procedures
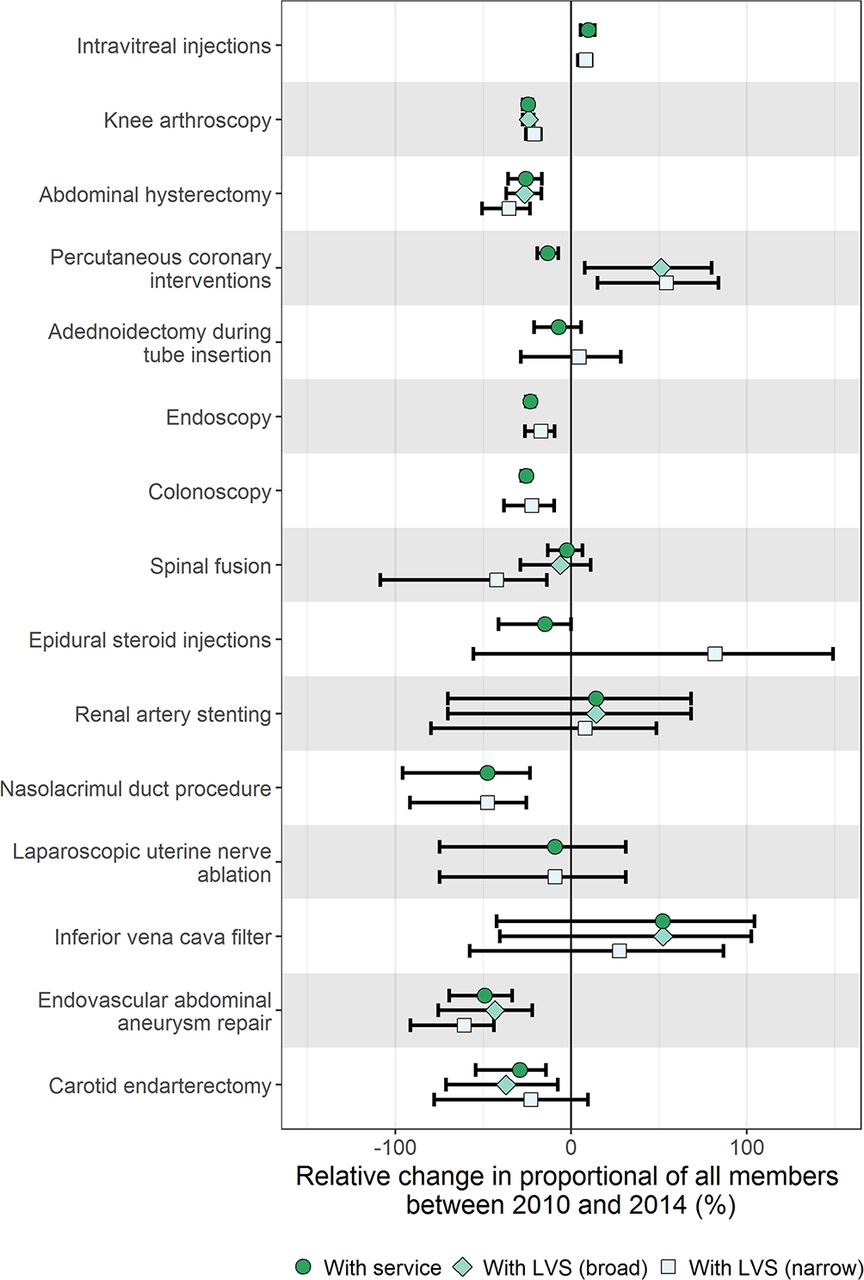
Figure 2 shows the relative change between 2010 and 2014 for low-value procedures with non-negligible counts (≥5 in 2014). There were decreases in both the overall volume of admissions, and for the proportion that were low-value, for knee arthroscopy, abdominal hysterectomy, endoscopy, colonoscopy, nasolacrimal duct procedures in patients 1 year or younger, and endovascular abdominal aneurysm repair or carotid endarterectomy for asymptomatic, high-risk patients.
The relative change between 2010 and 2014 in the proportion of patients with the procedure (circle) and low-value procedure (broad: diamond, narrow: square) out of all patients with an admission; 95% CIs are shown, based on bootstrap samples of 1000 replicates. LVS, low-value service.
One low-value procedure with a substantial increase in those with a low-value indication was PCI. Despite a 13% decrease in admissions for patients with a PCI, those with a low-value indication increased by 50% between 2011 and 2014. Admissions for inpatient intravitreal injections (as opposed to an outpatient setting) also increased by 8% following introduction of the related MBS item and therefore health insurance coverage in 2012.21
Costs of low-value procedures
We estimated costs for 13 low-value procedures without negligible counts in 2014 and were the principal reason for an admission. Total hospital, medical and prostheses charges using narrow and broad low-value indicators were between $A12.4 and $A22.7 million, respectively (table 2). Between 2010 and 2014, the total charges were estimated at $A47.4–$A86.9 million. The Medicare contribution towards the costs of these admissions was estimated at $A1.78–$A2.94 million in 2014, and $A7.5–$A12.4 million over the 5-year period.
The average and total charges of low-value procedures claimed to the insurance funds and Medicare in 2014 and from 2010 to 2014
Discussion
To our knowledge, this is the first large-scale Australian study which directly measures low-value care within a private health insurance setting, and builds on similar international work.6 22–24 We could measure 21 in-hospital procedures, and estimated between 20.8% and 32.0% of patients undergoing at least one of these procedures received a low-value procedure in 2014. This equates to just over 2% of the entire admitted cohort receiving at least one of the investigated low-value procedures. The 2014 Medicare contribution towards low-value admissions was between $A1.8 and $A2.9 million. If the full spectrum of hospital procedures provided to all insured patients could be measured, this estimate might be considerably higher. Additional expenditure (not counted in this analysis) may have been incurred in managing in-hospital complications or other downstream harms and interventions resulting from these low-value procedures.
Comparison to international results
The US6 25 and Canadian24 studies which applied the same method for directly measuring low-value care did so in data sets containing both in-hospital and primary care information. Because Australian private health insurers are principally responsible for care provided only during a hospital admission, we investigated only in-hospital services. Thus, the absence of some population-based screening interventions, and likely differences in the patient populations and data sets, explain the comparatively low proportion of the patient population in this study with a low-value procedure (2%–3% compared with 25%–42% reported by Schwartz et al 6). However, if we focus on the same six in-hospital procedures (knee arthroscopy, carotid endarterectomy, PCI, renal angioplasty, inferior vena cava filters, and vertebroplasty) as investigated in this study and the US studies, then the following proportion of beneficiaries received at least one of these six low-value procedures: 0.8% (narrow) to 1.8% (broad) of US Medicare beneficiaries6; 0.03% (narrow only) of a US commercially insured population25 and 1.2% (narrow) to 2.2% (broad) in our cohort of insured Australian patients with a hospital admission.
The most prevalent and costly low-value procedure we investigated was knee arthroscopy. Several randomised trials published between 2002 and 2013 demonstrated the unlikely clinical benefit of knee arthroscopy compared with conservative management for many patients, and guidelines globally reflected this (the National Institute for Health and Care Excellence do-not-do recommendation was released in 2008).26 Our investigation showed that knee arthroscopy (all procedures and low-value procedures) decreased between 2010 and 2014. A recent study using Swiss health insurance claims also showed a decrease in surgical volume between 2012 and 2015, although the authors also found patients’ type of insurance coverage was associated with undergoing a knee arthroscopy.27 Comparisons between insurance types (particularly public vs privately insured patients) in Australia and low-value procedures have yet to be investigated.
Limitations and implications
Our study carries similar limitations as other reported projects using similar methods based on administrative data.6 22 24 Like any investigation that directly measures low-value care, we were limited by the published recommendations and available definitions of low-value care and the clinical detail recorded within the data set. There are many CW recommendations, for example, that are not measurable within claims data, because the clinical detail required to distinguish potentially inappropriate from appropriate care is not available.17 28
Another limitation is the uncertain representativeness of our sample for all privately insured Australians, as comparisons of patient characteristics between the memberships of different insurance funds were not possible.
Finally, the measures of low-value care we used in this study were derived from recommendations which were mostly issued after 2012 and have not been validated against other data sources, such as detailed clinical chart review, which is again a limitation common to all low-value care measurement studies using routinely collected administrative data.29 However, comparisons of indicators of inappropriate care based on administrative data (like we have done) versus chart reviews suggest the former yield conservative or indicative estimates of low-value care. These comparisons have only been done for a few services and administrative data sets,30–32 and further research and validation work on these indicators would be useful.29
Our study has several important implications for Australian and international policy makers. The decrease over time in the proportion of low-value care for many procedures suggests we have measured procedures amenable to reduction. This decrease may reflect changes in clinical practice due to increasing evidence—and awareness campaigns—about the low-value application of specific procedures. In contrast, the increase in low-value PCI admissions may reflect a perception that, in contrast to the measure of low-value care used in our study (derived from Schwartz et al 6 and which relied on studies that only evaluated bare metal stents), use of new-generation drug-eluting stents (DES) may improve outcomes in patients with stable coronary artery disease.33 However, a recent randomised trial which only used DES and compared PCI against a sham procedure control group re-affirmed no benefit from PCI in such patients.34
Other observations likely reflect alterations in clinical practice due to changes in government reimbursement eligibility and insurance fund coverage, such as the removal of the vertebroplasty item from the MBS in 2011, and the introduction of a funding mechanism to allow intravitreal injections to be performed in inpatient settings in 2012.9 21 However, with respect to the latter, the CW Australia recommendation states that most intravitreal injections can be safely done in an outpatient setting, and:
this cost, initially borne by private health funds, clearly puts pressure on the sustainability of the private health system and contributes to the need to increase health insurance premiums and to reduce benefits for other procedures.2
In summary, the claims-based direct measures used in this study provide estimates of the extent of low-value care within a sizeable cohort of privately insured patients up to 2014 and can be used as baseline estimates in monitoring the impact of campaigns like CW in this and other patient cohorts. Measuring the scale of low-value care is a necessary prerequisite to developing policies which influence clinical decisions and reorientate the healthcare system towards high value care. The measures used in this study will benefit from further refinement as research and clinical experience, both in Australia and internationally, adds to the evidence base of what constitutes low-value care.
Acknowledgments
The authors would also thank the 27 participants in a clinical workshop who reviewed the related methods and indicators used for NSW public hospital data; and Leanne Johnson and Sarah Barras from Australian Health Service Alliance for their advice and contribution to the cost estimates.
References
Footnotes
Contributors KC designed the study, conducted the data analysis and interpretation, and drafted the article. KC and TB-P developed the low-value procedure indicators with contributions from JB and IAS. S-AP and AGE had input into the study design and critical revision of the article. All authors had final approval of the article.
Funding This work was supported by the National Health and Medical Research Council (grant number 1109626); the Capital Markets Cooperative Research Centre under the Health Market Quality Program and their partners Hospital and Medical Benefits Systems and the New South Wales Ministry of Health; and the HCF Research Foundation. JB is funded by an NHMRC Postgraduate Scholarship (APPID: 1094304). AGE receives salary support as the HCF Research Foundation Professorial Fellow. KC and TB-P receive salary support via a doctoral scholarship from the Capital Markets Cooperative Research Centre-Health Market Quality Program. KC also receives support from an Australian Government Research Training Program Scholarship, and TB-P through a University Postgraduate Award from the University of Sydney.
Competing interests KC receives salary support via a doctoral scholarship from the Capital Markets Cooperative Research Centre-Health Market Quality Program, and consulting fees from Queensland Health Department. TB-P receives salary support via a doctoral scholarship from the Capital Markets Cooperative Research Centre-Health Market Quality Program, and consulting fees from Queensland Health Department. AGE receives salary support as the HCF Research Foundation Professorial Research Fellow and is a Ministerial appointee to the Australian Medicare Benefits (MBS) Review Taskforce, receives consulting sitting fees from Cancer Australia, the Capital Markets Cooperative Research Centre-Health Quality Program, NPS MedicineWise (facilitator of Choosing Wisely Australia), The Royal Australasian College of Physicians (facilitator of the EVOLVE programme) and the Australian Commission on Safety and Quality in Health Care, and Queensland Health (state department of health), and is on the advisory board of the NSW Bureau of Health Information; S-AP is a member of the Drug Utilisation Sub-Committee of the Pharmaceutical Benefits Advisory Committee (PBAC) and receives consulting fees from NPS MedicineWise.
Ethics approval The University of Sydney Human Research Ethics Committee (project ID 2015/662) approved the study.
Provenance and peer review Not commissioned; externally peer reviewed.
Data sharing statement The code used in this study is commercial-in-confidence. The data in this study are available from Hospital and Medical Benefits Systems, which were used under licence for the current study, and is not publicly available. Data are available from the authors on reasonable request and with permission from Hospital and Medical Benefits Systems.
Patient consent for publication Not required.