Article Text

Abstract
Objective To evaluate the sustainability of the dietary patterns, according to their effects on health and environment and their affordability.
Design Prospective, ongoing cohort study of university graduates.
Settings The Spanish SUN project (Seguimiento Universidad de Navarra, University of Navarra Follow-up), starting from 1999.
Participants A total of 18 429 participants.
Methods Information from participants is collected every 2 years by validated questionnaires. We assessed three dietary patterns (the Mediterranean, the Western and the Provegetarian dietary patterns). The rate advancement period (RAP) was used to assess the healthiness of each pattern (considering the composite endpoint of all-cause mortality, cardiovascular disease, breast cancer or type 2 diabetes). We also assessed environmental footprints and monetary costs of each dietary pattern.
Results After a median follow-up of 10.1 years, we identified 469 incident cases of the composite endpoint. The Mediterranean dietary pattern exhibited the best RAP (3.10 years gained [95% CI 4.35 to 1.85] for the highest vs the lowest quartile), while the Western pattern was the unhealthiest pattern (1.33 years lost when comparing extreme quartiles). In a scale between 4 and 16 of harmful environmental effects (the lower, the more environmentally friendly), the Provegetarian pattern scored best (8.82 [95% CI 8.75 to 8.88] when comparing extreme quartiles), whereas the Western pattern was the most detrimental pattern (10.80 [95% CI 10.72 to 10.87]). Regarding monetary costs, the Western pattern was the most affordable pattern (€5.87/day [95% CI 5.82 to 5.93], for the upper quartile), while the Mediterranean pattern was the most expensive pattern (€7.52/day [95% CI 7.47 to 7.56]). The Mediterranean dietary pattern was the most overall sustainable option, closely followed by the Provegetarian pattern. The least overall sustainable pattern was the Western dietary pattern.
Conclusion Following plant-based diets, like the Mediterranean or Provegetarian dietary patterns, could be a good option in order to achieve an overall sustainable diet.
Trial registration number NCT02669602; Results.
- epidemiology
- public health
This is an open access article distributed in accordance with the Creative Commons Attribution Non Commercial (CC BY-NC 4.0) license, which permits others to distribute, remix, adapt, build upon this work non-commercially, and license their derivative works on different terms, provided the original work is properly cited, appropriate credit is given, any changes made indicated, and the use is non-commercial. See: http://creativecommons.org/licenses/by-nc/4.0/.
Statistics from Altmetric.com
Strengths and limitations of this study
The novelty of our study was in the assessment simultaneously of three dimensions of an overall sustainable diet (health, environment and monetary cost).
We use a wide range score for food consumption of a large sample size, through a validated questionnaire.
Information about food consumption is self-reported, therefore susceptible to information bias.
The generalisability of our results could be challenged because the sample, all university graduates, is not representative of the general population.
Introduction
Traditionally, nutritionists have been interested in the relationship between food and health outcomes. This association should be preferentially conducted according to complete dietary patterns, not solely by assessing specific food items or their nutrient compositions.1 In general, plant-based diets such as the Mediterranean (MeD) or any other pattern that emphasises the consumption of plant origin food commodities against foods produced from animals are reportedly healthy options.2–4 However, nutrient-poor energy-dense diets, such as the Western dietary pattern (WDP), rich in highly processed and animal-based foods, have a detrimental health impact.5
In 2010, the Food and Agriculture Organization of the United Nations indicated that other aspects of the diet should be taken into account, such as their environmental footprints and affordability, among others.6 The association between dietary patterns and ecosystems was initially studied in the 1980s.7 Environmental footprints (the harmful effects of any activity on the ecosystems) are caused by the use of resources (such as land, water and energy) or environmental degradation (such as greenhouse gas [GHG] emissions, among others). The impact on the environment differs between food items,8 with plant foods being the most eco-friendly and animal products the most adverse for the environment.9–11 It seems plausible that those food patterns mainly based on plant-derived products are more environmentally friendly than others like the WDP, which includes larger amounts of animal commodities.12–14
Data on monetary costs of food products in relation to their consumption were assessed for the first time in the late 1990s.15 Since then, several studies on economic aspects of the dietary patterns have been reported. Mainly, energy-dense elements provide calories at lower monetary costs than other foods like fish, vegetables and fruits, which are healthier.16 Taste and retail prices are important factors for food choices.16 17 However, following a cheaper diet could result in health problems for the consumer due to the decrease in nutritional quality. This may finally lead to an increment in the global societal cost.16 18
Previous investigations have assessed health, environment and monetary cost, separately. However, few studies have focused on these different dietary aspects at the same time.19 20 For this reason, we have assessed the association between the adherence to three different dietary patterns (WDP, MeD and Provegetarian dietary pattern [pVD]) and their repercussions on the three aspects separately and all together.
Subjets and methods
Study population
The Seguimiento Universidad de Navarra/University of Navarra Follow-up (SUN) project is an ongoing cohort composed of Spanish university graduates.21 Starting in 1999, information from participants is collected every 2 years by questionnaires. Voluntary completion of the baseline questionnaire implied informed consent, as participants received detailed information about the whole study. The SUN cohort is registered at clinicaltrials.gov.
Up to March 2014, 22 320 participants were recruited (see online supplementary figure 1). Among them, we excluded 2031 who did not answer any follow-up questionnaires (retention in the cohort: 90.90%), 404 with total energy intake beyond predefined limits (under percentile 1 or over percentile 99), 1286 with chronic disease as cardiovascular disease (CVD), cancer or type 2 diabetes mellitus (T2DM) and 170 who failed to answer 70 or more items of the food frequency questionnaire (FFQ), leaving a total of 18 429 participants.
Supplemental material
Dietary assessment
Usual diet was recorded using a validated semiquantitative FFQ completed at baseline with 136 food items.22–24 We recoded missing FFQ values as no consumption. Daily food intake was estimated by multiplying the frequency of consumption for each item and the typical portion size specified in the FFQ. We used consumption data to test the adherence of our population to three dietary patterns.
The pVD captures a preference for plant origin foods instead of animal ones. To assess it, we followed a previously described method.4 25 Concisely, we adjusted for total energy intake, using the residual method separately for men and women. We also adjusted for the baseline consumption (g/day) of 12 food groups: 7 from plant origin (vegetables [including roasted potatoes and french fries]; fruits [including fruit in syrup or juice and dried fruits] and fruit juices; nuts; legumes; cereals [whole and refined]; plant origin oils; and bakery products) and 5 from animals (dairy products; eggs; meat and meat products; fish and seafood; and animal fats). The residuals (energy-adjusted estimates) were ranked according to quintiles. Quintile values of plant foods and reverse quintile values for animal were summed up in order to evaluate the adherence. Final scores may range from 12 to 60 points (lowest and highest adherence, respectively). Lastly, we categorised the adherence to this dietary pattern into quartiles (Q).
The index proposed by Trichopoulou and colleagues26 was used to measure the adherence to the MeD. A score of 0 or 1 was given to each of these nine components of this index (vegetables, legumes, fruits and nuts, cereals, fish, meat and meat products, fatty dairy products, alcohol and fat intake [as the ratio of monounsaturated lipid to saturated lipid intake]), using the sex-specific median as the cut-off value. Those who consumed below the median of presumed beneficial components (vegetables, legumes, fruits and nuts, cereals, fish and fat ratio) were assigned a value of 0, and participants whose consumption was at or above the median were assigned a value of 1. The other way around, consumption below the median was assigned 1 point assessing a priori detrimental items (meat and meat products and fatty dairy products) and the consumption at or above the median was valued as 0. Consumption of ethanol between 10 g/day and 50 g/day or between 5 g/day and 25 g/day, for men and women, respectively, was given one point. The total index score ranged from 0 to 9 points (minimal to maximal adherence to MeD). Finally, we roughly divided the adherence to this diet into quartiles.
We used principal component analysis in order to establish a WDP in our cohort, because there is no specific a priori definition of the WDP. Food products were grouped into 30 categories, as described by Lopez et al 27 We excluded those food groups whose measure of sampling adequacy was lower than 0.65. Food groups that loaded >0.30 were considered to be making a contribution to the factor. The factor score for the diet was constructed by summing observed consumptions of the component food items weighted by their factor loadings. Thus, each individual received a factor score for each identified pattern.28 The major dietary pattern factor identified was labelled as the WDP, which included fast food, fatty dairy products, red and processed meat, potatoes, industrial bakery, sauces, precooked foods and sugar-sweetened soft drinks (see online supplementary table 1). Participants were also categorised into quartiles according to their adherence to the WDP.
Assessment of other variables
The baseline questionnaire also included sociodemographic, lifestyle and medical history questions. Self-reported data such as physical activity (total metabolic equivalent of tasks [METs] per hour per week), body mass index (BMI) and hypertension had been previously validated.29–31
Outcomes assessment
Health
We estimated the impact of each of the three dietary patterns on health using the metric of the rate advancement period (RAP).32 33 The RAP is a method that measures the time by which a rate of a specific outcome is advanced (positive values for detrimental exposures) or it is postponed (negative values for protective exposures) among exposed subjects compared with unexposed individuals, conditional on being free of that outcome at the baseline age. It is useful to analyse outcomes that uniformly rise with age, as it happens with total mortality and with the incidence of most chronic diseases. In the current analysis, the endpoint was a composite including death, non-fatal CVD (myocardial infarction or stroke), non-fatal breast cancer or T2DM, whichever occurred first (detailed data of the rates [cases/frequency; percentage] assessing specifically each individual health outcome that compose the overall health effect was reported in online supplementary table 2). Time was measured in years from the entrance to the cohort. In order to minimise the bias produced by comparing dietary scores measured using different units, z scores were used. Each z score was calculated as the value of the diet minus the sample mean divided by its SD. Cox regression models adjusted for sex, BMI (including a quadratic term for BMI), physical activity, smoking, time spent in sedentary activities, prevalent hypertension, prevalent hypercholesterolaemia and total energy intake. These Cox models were used to estimate the RAP for each quartile of adherence to the three dietary patterns by dividing the regression coefficient of the z score by the regression coefficient of age; the 95% CIs for the RAP were calculated by using the variance and covariance estimates from the regression coefficients.32
Environmental footprints
Environmental footprints index was assessed as previously described by Fresán et al.34 In brief, the impact of the production of 1 kg of each food product reported in the FFQ on resource use (land, water and energy) and GHG emission was assessed using data previously reported by several institutions and/or research groups. The main data sources of each environmental domain were collected in online supplementary table 3. Those foods that are composed by more than one ingredient were broken down into their main ingredients. The environmental impact of these composed foods were assessed as the sum of the footprints of their individual ingredients, taking into account the proportion of each of them, and the food losses. For example, we took in consideration that 600 g of wheat flour, 180 g of butter, 180 g of sugar and 70 g of eggs were assumed to be necessary to produce 1 kg of cookies. Finally, the environmental impacts embodied in the processing of the ingredients into the final food product were added to the ingredients’ production figures.
The impact on the environment of each participant was estimated considering the amount of every item consumed per day and the specific value of each of them. Total use of land, water and energy, and GHG emission were calculated as the sum of all items values, obtaining the impact on these four footprints according to the daily food consumption of each participant. We classified participants into quartiles of these total values, each of them ranking from 1 to 4 (less to high resource consumption or GHG emission). A total environmental footprints index was created summing the quartile values of all the four footprints: land use, water use, energy use and GHG emission. Therefore, environmental footprints index ranked from 4 to 16 points (from low to high environmental repercussion).
Monetary cost
Monetary cost of food was derived from the Ministry of Industry, Tourism and Commerce of Spain.35 Annual cost of each item was calculated as the monthly reported national average costs, and it was assessed according to the year in which that participant completed their baseline questionnaires in order to control for differences between calendar years in retail prices. Total daily monetary costs were calculated by multiplying the cost per kg (€/kg) of each food item by the reported daily quantity consumed through the FFQ.
Overall sustainable diet index
We designed an index that gathered the impact of the daily diet on all the analysed aspects: health, environmental footprints and monetary costs. In order for all of these three aspects to contribute equally for the overall index, a score from 0 to 3 points was given for each of them. We estimated the RAP, the environmental footprints index and the daily monetary cost of the diet of each participant. Of these values, the less suitable value for health (a specific hazard is advanced more years), environment (more environmental footprints were produced) and economy (the highest daily monetary cost) was given 0 points. However, we assigned 3 points for the healthiest daily diet (a specific hazard is postponed more years), the one that produced less environmental footprints and the cheapest one. Proportional score was given for the rest of values. Summing these three values, the overall sustainable diet index ranked from 0 to 9 points, with 0 being the less suitable diet and 9 being the most appropriate diet.
Statistical analyses
Linear regression models were used to assess the relationship between quartiles of adherence to each dietary pattern and overall sustainable diet index and each of the three components separately (RAP, environmental footprints index and monetary costs). We estimated means and their 95% CI using analyses of covariance for each quartile, adjusting for age, sex and total energy intake. Moreover, we analysed differences in mean values and their 95% CI for each of the three upper quartiles of the respective dietary pattern using the lowest quartile as the reference category. Linear trends across different quartiles were conducted by assigning the medians to each quartile; this variable was treated as continuous.
We conducted sensitivity analyses refitting the models under different assumptions to assess the robustness of our results: excluding participants who had any of the outcomes gathered in the health composite endpoint in the first 2 years of follow-up; including participants with prevalent CVD, cancer or T2DM at baseline (in this case, the model was additionally adjusted for prevalent CVD, cancer and T2DM at baseline); and excluding participants with total energy intake beyond predefined limits (<800 Kcal/day and <500 Kcal/day or >4000 Kcal/day and >3500 Kcal/day in men and women, respectively).
We assessed interactions, through a likelihood ratio test, between the respective dietary pattern and sex, BMI, age and physical activity (assessed as continuous variables).
All p values presented are two tailed; p<0.05 was considered statistically significant. Analyses were performed using STATA/SE V.12.1.
Patient and public involvement
Neither patients nor public were involved in the study.
Results
Our analysis included a total of 18 429 participants (7042 men and 11 387 women). The main baseline characteristics of participants according to adherence (extreme quartiles, Q1 and Q4) to each of the three dietary patterns are presented in table 1.
Distribution of baseline characteristics of participants according to quartiles of adherence to Western, Mediterranean and Provegetarian dietary patterns
Participants with the highest adherence to the WDP (Q4) were more likely to be men, younger, single and current smokers with less advanced studies. They tended to intake more calories. On average, they consumed more animal products, bakery products, fast food and sugared sodas but less fish, plant products and olive oil. The opposite results were obtained for those participants in the Q4 of the MeD, whose consumption of fish and plant origin food was the highest. Dairy products, eggs and meat were consumed less frequently for those who reported the highest pVD adherence. Intake of fats, specifically saturated fatty acids, were higher in the Q4 of the WDP. Fibre was highly consumed by participants of the Q4 of the pVD and MeD, and the Q4 participants of the MeD also reported higher consumption of alcohol.
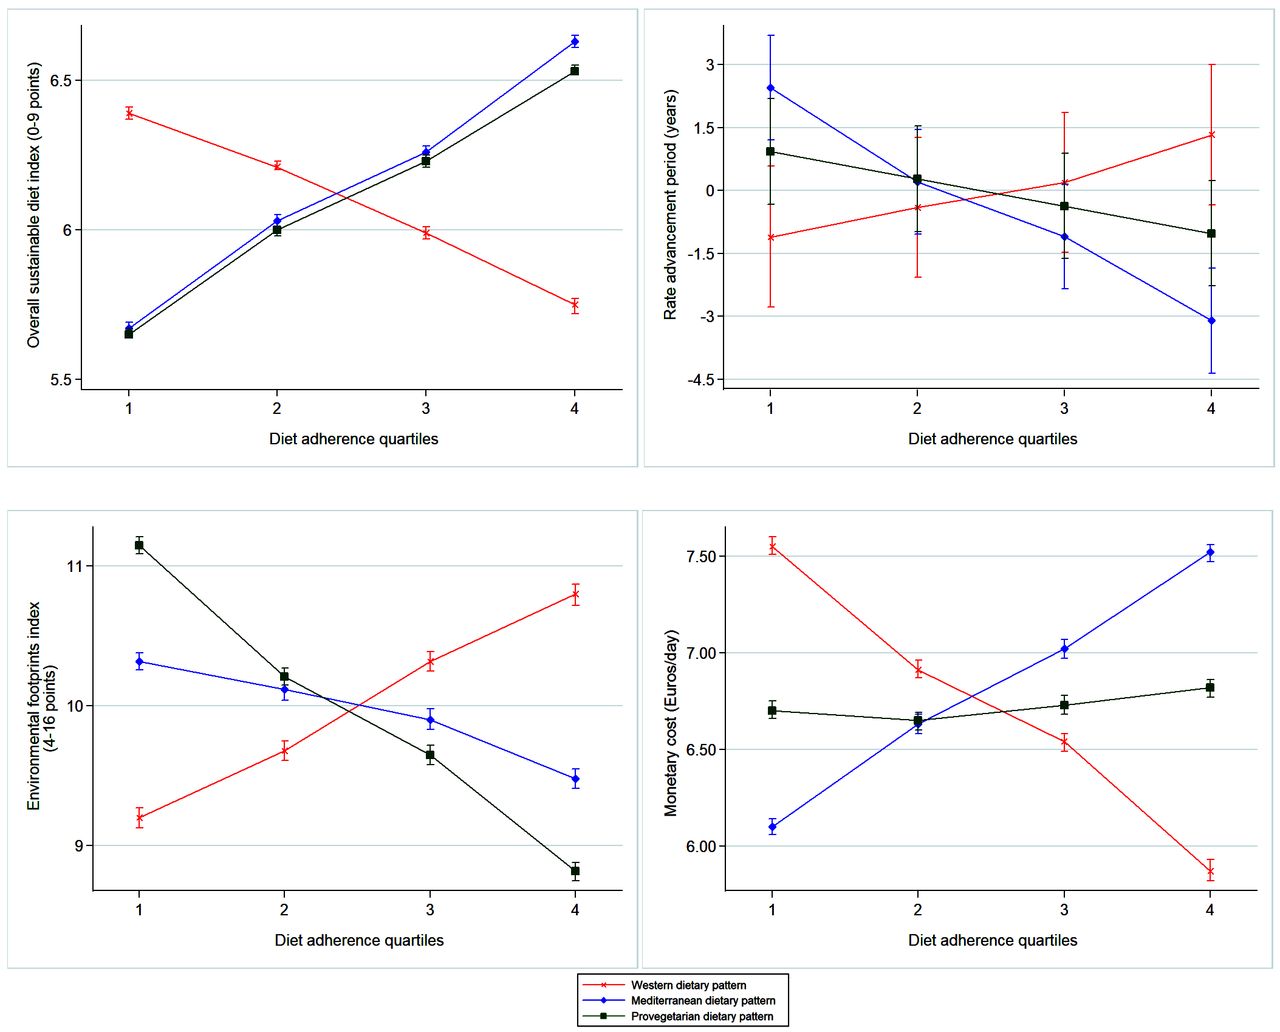
Figure 1 shows how the overall sustainable diet index, and the three elements that composed it (health as captured by the RAP, environmental footprints index and monetary costs) changed across successive quartiles of adherence to each of the three analysed dietary patterns (specific values for means and CIs are shown in online supplementary table 4).

Adjusted means and 95% CIs of overall sustainable diet index, rate advancement period, environmental footprints index and monetary cost, according to quartiles of Western, Mediterranean and Provegetarian dietary patterns adherence. Adjusted for age, sex and total energy intake. Red line, cross: adherence to the Western dietary pattern. Blue line, diamond: adherence to the Mediterranean dietary pattern. Green line, square: adherence to the Provegetarian dietary pattern.
Comparing the dietary patterns of participants in the upper quartile of each dietary pattern, the most overall sustainable pattern was the MeD, followed closely by the pVD. Taking health repercussions into account, after a median follow-up of 10.1 years, and after observing 469 incident cases of the composite endpoint, the healthiest dietary pattern was the MeD, because the hazard of developing the end-point was postponed for more than 3 years when comparing the upper versus the lowest quartile. Assessing the diet of subjects on the pVD and WDP, we noticed a retardation and an advancement of the endpoint, respectively, although both lacked statistical significance. Regarding environmental footprints, the pVD seemed to be the most eco-friendliest option, followed by the MeD. On average, participants in the upper quartile of the MeD spent the highest amount of economic resources, while the upper quartile of the WDP included the most relatively affordable foods.
Adjusted relative mean differences are shown in figure 2, and specific values are presented in online supplementary table 5. In all analyses, there was a statistical linear trend across quartiles (p<0.001).

Adjusted relative means differences and 95% CIIs of overall sustainable diet index, rate advancement period, environmental footprints index and monetary cost, according to quartiles of Western, Mediterranean and Provegetarian dietary patterns adherence, taking as the reference category the first quartile. Adjusted for age, sex and total energy intake. Red line, cross: adherence to the Western dietary pattern. Blue line, diamond: adherence to the Mediterranean dietary pattern. Green line, square: adherence to the Provegetarian dietary pattern.
The main results were consistent in all our sensitivity analyses (see online supplementary tables 6 and 7). Only including those participants who reported a prevalent chronic disease, a higher adherence to the pVD presented a higher overall sustainable diet index than higher adherence to the MeD. However, differences between these two dietary patterns were not statistically significant. We did not observe any statistically significant interaction between the dietary patterns and sex, BMI, age or physical activity (data not shown).
Discussion
The current study showed the MeD dietary pattern as the healthiest option, with relatively low environmental footprints. However, its monetary costs were the highest. The pVD was the most eco-friendliest pattern, relatively healthy and affordable. The WDP was the least recommended pattern according to health criteria and ecosystems consequences, but it was the most affordable food pattern. Considering in conjunction health, environment and monetary costs, the MeD and the pVD would be sustainable dietary patterns, while the WDP would not be a sustainable dietary pattern.
Healthy diets are inversely associated with the risk of diseases like CVD, cancer, T2DM and also all-cause mortality.36 We observed that better conformity to the MeD was the healthiest option, followed closely by the pVD. The high quality of the MeD and other pVD has been reported previously.3 4 Their benefits have been attributed to the high consumption of plant origin foods and the low consumption of animal-based foods.36 In fact, the MeD could be considered as a special case of a pVD. The similarity of these two patterns can be appreciated in the recommendations of high intakes of fruit, vegetables, beans, cereals, nuts and seeds. Olive oil as the main source of fat, moderate to high consumption of fish and other seafood, moderate amounts of red wine with meals as the main source of alcohol and a low intake of meat and dairy products are what specifically define MeD compared with a general pVD. Indeed, the specific suggestion in the MeD of the consumption of olive oil or fish could be one of the reasons why this diet achieved more health benefits.2 37 We have not assessed a ‘pure’ vegetarian/vegan diet because the proportion of participants who followed these patterns was very low in our cohort. pVD is only a gentle and moderate approach. However, our results related to the WDP, and its detrimental health repercussions are in agreement with previous publications.38
Previous research supports that a population shift to a more plant and less animal-rich diet, like the pVD or the MeD, may be positive for the environment.8–10 12–14 39 Conformity to the MeD, and especially to the pVD, implicated a reduction on environmental footprints. The higher impact of the MeD than the pVD could be due to fish consumption, because of the great amount of energy used for fish production than for fruits, vegetables and other plant-derived foods. It is necessary to reinforce fish consumption from sustainable sources, and in the case of wild-caught fish to prevent overfishing.
A direct linear relationship between nutritional adequacy and the monetary costs of a dietary pattern has been suggested.40–42 A recent meta-analysis reported an average increment of $1.48/day if a healthy diet is followed.41 In our cohort, those participants with the highest adherence to the healthiest pattern, the MeD, spent a mean of €1.42/day more in their daily diet that those with the poorest adherence to the MeD. Again, fish consumption could be the main reason for the monotonically increasing monetary costs in parallel with better MeD adherence.27 42 However, it should be noticed that we only took into account the amount of money that people spent to buy their foods. The relevance of this item as part of an overall sustainability index could be discussed. It has been suggested that a full societal cost of diet (ie, healthcare expenditures and loss of productivity) should be addressed when assessing sustainability evaluation.43 Indeed, a recent publication concluded that moving towards plant-based dietary patterns, and specifically the MeD, could save huge amounts of money when the assessment is done from a full societal perspective taking into account all the costs.44 We reran our analyses assessing the overall sustainability of the three dietary patterns without the cost item, and the main results supported the higher benefits associated with following plant-based diets, in particular the MeD (data non-shown).
We observed only a modest magnitude for the differences between the extreme quartiles on the overall sustainable diet index (see online supplementary table 2). This limitation could be due to the method used to construct the overall index according to quartiles of the three dimensions evaluated. This might explain why some of the differences according to dietary patterns were not well captured. In fact, although in the overall sustainability index, the health-related and environmental items seem to have been considered appropriately, their contribution is only qualitative, as their differences between the first and the fourth quartiles are small. This fact may limit the interpretability of the impacts reported here. There would potentially be much greater differences with the inclusion of the true global costs from a societal perspective of the food patterns. Some other limitations of our study include self-reported information and the difficulties to generalise our results to other populations, given that the sample is not representative of the general Spanish population (cohort composed only by university graduates). However, the advantages of using a socially homogenous and well-educated cohort overcome this limitation because this approach removes part of the residual confounding and ensures a higher quality of the self-reported information. Another potential limitation for the external validity of our results is the relatively young age of our cohort that we acknowledge. The IQR for age was 27–45 years. Only 1.53% of participants in the cohort were older than 65 years at baseline. The percentage of women older than 65 years at baseline was especially low (0.5%). These limitations highlight the need for replication of our findings in other independent cohort with older age at baseline. We assumed that foods were prepared and eaten at home, and this approximation may underestimate the effect of the diet. The three dietary patterns were assessed by three different methods. Assessing the adherence to the diets using different cut-offs could give different results. The relevance of the RAP metric for health outcomes in a young people cohort could be questioned. It would be interesting to assess in the future the impact on health using other criteria, for instance, quality-adjusted life-years, which is another common measure used to value health gains. The environmental footprints index does not contemplate other phases of the food chain apart from production and processing. However, production is the most contributive aspect by far.45 46
Some of the strengths of the current study include the simultaneous assessment of the three dimensions of an overall sustainable diet (health, environment and monetary costs). This represents a novelty of our study. We used a wide range of scores for food consumption in a large sample size through a validated questionnaire. We focused on GHG emission and efficiency in using natural resources when assessing the environmental footprints, which is a more holistic approach.
Conclusion
Following plant-based diets, like the MeD or another model of pVD, could be a good option to achieve an overall sustainable diet, according to a concordant high score in three dimensions of an ideally healthy, environmental-friendly and affordable diet. The MeD dietary pattern was the healthiest pattern and relatively environmentally sustainable. However, nowadays, it cannot be presented as an affordable model. Some monetary policies, such as subsidising healthy Mediterranean foods, may contribute to increased adherence to a diet with recognised health benefit. This translates into huge savings from a global societal perspective in terms of making healthier foods more affordable for the general population.
Acknowledgments
We would like to thank the participants of the SUN cohort for their continuous involvement in the project and all members of the SUN study for their support and collaboration, and Cassandra Etzig for her help in revising the English style of the manuscript.
References
Footnotes
Contributors Conception and design: UF, MAM-G and MB-R. Acquisition, analysis and interpretation of data: UF, MAM-G and MB-R. Drafting of the manuscript: UF. Critical revision of the manuscript for important intellectual content: JS, MAM-G and MB-R. Statistical analysis: UF. Supervision: MB-R.
Funding The Seguimiento Universidad de Navarra (SUN) project has received funding from the Spanish Government-Instituto de Salud Carlos III and the European Regional Development Fund (FEDER: MAM-G) (CIBER-OBN [MAM-G], PI10/02293 [MB-R], PI13/00615 [MB-R], PI14/01668 [MB-R] and G03/140 [MAM-G]), the Navarra Regional Government (45/2011 [MB-R], 122/2014 [MB-R]) and the University of Navarra.
Competing interests None declared.
Ethics approval The protocol was approved by the Research Ethics Committee of the University of Navarra.
Provenance and peer review Not commissioned; externally peer reviewed.
Data sharing statement No additional data are available.
Patient consent for publication Not required.