Article Text

Abstract
Objectives The study was designed to evaluate the accuracy of maternally perceived baby birth size assessments as a measure of birth weight and examine factors influencing the accuracy of maternal size assessments.
Study design Cross-sectional study.
Setting The study is based on national data from the 2016 Ethiopian Demographic and Health Survey.
Participants We included 1455 children who had both birth size and birth weight data.
Main outcome measures Predictive accuracy of baby birth size for low birth weight. Level of discordance between maternally perceived birth size and birth weight including factors influencing discordance.
Results Mother-reported baby birth size had low sensitivity (57%) and positive predictive value (41%) to indicate low birth weight but had high specificity (89%) and negative predictive values (94%). The per cent of agreement between birth weight (<2500 g vs ≥2500 g) and maternally perceived birth size (small size vs average or above) was 86% and kappa statistics indicated a moderate level of agreement (kappa=0.41, p<0.001). Maternal age, wealth index quintile, marital status and maternal education were significant predictors of the discordance between birth size and birth weight.
Conclusions Maternal assessment of baby size at birth is an inaccurate proxy indicator of low birth weight in Ethiopia. Therefore, a mother’s recall of birth size should be used as a proxy indicator for low birth weight with caution and should take maternal characteristics into consideration.
- predictive accuracy
- perceived baby size
- birth weight
- Ethiopia
This is an open access article distributed in accordance with the Creative Commons Attribution Non Commercial (CC BY-NC 4.0) license, which permits others to distribute, remix, adapt, build upon this work non-commercially, and license their derivative works on different terms, provided the original work is properly cited, appropriate credit is given, any changes made indicated, and the use is non-commercial. See: http://creativecommons.org/licenses/by-nc/4.0/.
Statistics from Altmetric.com
Strengths and limitations of this study
The study evaluated both aggregate and individual-level concordance between birth size and birth weight.
We compared estimated newborn birth size against birth weight without considering other size dimensions that likely affect a mother’s judgement of birth size.
We also assumed that reported birth weight is correctly measured or recalled to make comparison with maternally perceived baby birth size.
The birth weight data show heaping to certain digits, which might be introduced because of the tendency of enumerators or respondents to report certain digits at the expense of others.
Introduction
Birth weight is a good summary measure of multifaceted public health problems that include long-term maternal malnutrition, poor maternal health and poor maternal healthcare utilisation during pregnancy.1 2 It is also an important indicator of a child’s vulnerability to the risk of childhood illnesses and the child’s chances of survival.3–5 In most instances, low birth weight (LBW), <2500 g, is linked with high morbidity and mortality during the neonatal period and later life.5–7 LBW babies are at higher risk of early growth retardation, infectious diseases, and neurological, neurosensory and developmental delays.7–10
Although every country has a public interest in generating birth weight data, in many low and middle-income countries the majority of newborns are not weighed at birth because of the fact that most childbirths are occurring at home.11 According to the 2011 Ethiopian Demographic and Health Survey (EDHS) report, only 5% of children in Ethiopia are weighed at birth,5 a figure which has grown to 14% in the most recent EDHS report. Thus, information on mothers’ subjective estimates of their babies’ birth sizes is the only means of addressing the birth characteristics of 86% of newborns of unknown birth weight in Ethiopia.1 For this reason, in many large community-based surveys including the Demographic and Health Surveys (DHS), mother-reported birth size data are collected to use it as a proxy indicator of birth weight in low and middle-income countries.1 11
While a mother’s subjective assessment of the size of her baby at birth is still a useful proxy indicator in the absence of measured birth weight,5 it can be influenced by societal and contextual factors. The average size of infants in the community around a newborn and the characteristics of the infant and its parents influence the accuracy of the assessment.12 13 Wide variability is also observed in the distribution of maternal perceptions of baby size at birth between countries.12 Studies evaluating the relationship between maternal perceptions of baby size and actual birth weight concluded that maternal recall of baby size is an imprecise proxy indicator of birth weight.14 15
Although maternal perceptions of baby size at birth are a widely used proxy indicator for birth weight, the extent of agreement between these perceptions and recorded or recalled actual birth weight has not been examined in Ethiopia. This study fills this gap in the literature by evaluating the accuracy of maternal baby size assessments to predict LBWs obtained from record or maternal recall. On top of this, investigating the level of accuracy of maternally perceived birth size as proxy indicator of LBW is very important to inform the health policymakers, healthcare programmers and managers, and responsible others for informed decision. The study also examined the factors influencing the agreement between maternal baby size assessments and recorded or recalled birth weights in Ethiopia.
Methods
Study setting and design
This study was a secondary analysis based on the 2016 EDHS data. The sampling frame used for the 2016 EDHS is based on the 2007 Ethiopia Population and Housing Census conducted by the Ethiopia Central Statistical Agency. Multistage stratified cluster sampling was used to recruit the sample population. The detailed sampling procedure was published in the DHS country report.1
This study was based on a total of 11 023 live births during the 5 years preceding administration of the survey. Only singleton births (10 731) were included in this study. From singleton births, 1455 children who had both birth weight and birth size data were considered for the final analysis (figure 1).

Flow chart showing the study population, EDHS 2016.
Description of variable measurement
A multinomial logistic regression model was used to identify factors influencing discordance between birth size and birth weight.
Explanatory variables
The explanatory variables included were educational status, maternal age, marital status, pregnancy (wanted/unwanted), antenatal care, place of delivery, child’s sex, birth order, child’s survival status, media exposure, place of residence and wealth quintile. Wealth index scores were created based on the number and kinds of consumer goods in a household, ranging from a television to a bicycle or car; housing characteristics such as the source of drinking water and toilet facilities; and flooring materials. Detail on the DHS wealth index construction can be found in Rutstein and Johnson’s16 study and EDHS 2016 report.1
Outcome variables
Baby size: The 2016 EDHS has a question designed to assess maternal perceptions of baby size at birth for all live births occurred during the last 5 years preceding the survey. The mothers were asked to retrospectively classify their babies’ sizes at birth as ‘very large’, ‘larger than average’, ‘average’, ‘smaller than average’ or ‘very small’. Then we recoded into two categories: very large, larger than average and average responses were categorised as ‘average or above average’ category whereas smaller than average and very small responses were categorised as ‘small’.
Birth weight: The 2016 EDHS collects birth weight data in grams from written records or mother’s recall. Then, the birth weight obtained from record or mother’s recall was classified using the WHO cut-off point as ‘LBW’ if birth weight <2500 g or normal birth weight ‘NBW’ if birth weight ≥2500 g.17 Furthermore, the birth weight data were normalised and categorised into five categories based on SD. Thus, the categories were: birth weight greater than +2 SD from the mean taken as ‘very large’, between +2 SD and +1 SD from the mean as ‘larger than average’, between +1 SD and −1 SD from the mean as ‘average’, between −1 SD and −2 SD from the mean as ‘smaller than average’ and less than −2 SD from the mean as ‘very smaller’ categories.12 This statistical categorisation of the measured birth weight into five categories using the SD was done in order to test the agreement of the measured birth weight with mother’s perceived baby size category at birth. Then, we matched to generate new variable with three response categories; if the mother’s response on perceived baby size agrees with the response categories obtained from the birth weight considered as ‘concordant’, and if the responses do not agree further classified as ‘underestimate’ if the mother’s response is smaller than birth weight category, and ‘overestimate’ if it is larger than birth weight category.
In the DHS questionnaire, the questions on birth size and birth weight were ordered in a way that minimises bias. The question which assesses mother’s perceived baby size precedes the question on birth weight to minimise the influence of maternal knowledge about birth weight on assessment of size at birth.
Data analysis
Data were analysed using STATA V.14.0 statistical software package. We used the ‘svy’ command in STATA to weight the survey data.
The Boerma et al’s sensitivity-specificity analysis approach was applied to measure indicator accuracy.18 Sensitivity, specificity, positive predictive value (PPV) and negative predictive value (NPV) were analysed to evaluate maternal perceptions of baby size at birth as an indicator of LBW. In this study, sensitivity is the proportion of actual LBW newborns who are accurately identified as small in size by mothers and specificity is the proportion of actual NBW newborns who are accurately identified as ‘average or above average’ by their mothers. PPV is the proportion of actual LBW babies among those identified as small by their mothers and NPV is the proportion of actual NBW babies whom mothers reported as ‘average or above average’ in size.
Kappa statistics was used to evaluate the extent of agreement between birth weights and birth sizes as a measure of LBW.19 The Landis and Koch benchmark was applied to judge the relative strength of agreement associated with kappa statistics.20 One-way analysis of variance (ANOVA) was also performed to evaluate the presence of significant mean birth weight differences between birth size categories.
Multinomial logistic regression model was used to identify predictor variables as the outcome variable follows a multinomial probability distribution.21 Our outcome variable was categorised as concordant, underestimate or overestimate. Concordant was the base outcome category of the outcome variable. A Wald test was executed to test the significance of the independent variables in the model. Variables with p value lower than 0.25 were selected as candidate variables in the multivariable multinomial logistic regression model.22 An OR with a 95% CI was used to identify the factors associated with underestimate or overestimate responses as compared with concordant responses as indicators. Statistical significance for the explanatory variables was declared at p values lower than 0.05.
The authors followed the Strengthening the Reporting of Observational Studies in Epidemiology guidelines for writing this manuscript (online supplementary table 1).
Supplemental material
Ethical considerations
This study is based on secondary data. The 2016 EDHS data set was accessed after obtaining permission from The DHS Program. The primary data were collected in line with national and international ethical guidelines. Reader can refer the 2016 EDHS report for further reading on the survey protocol.1
Patient and public involvement
We did not involve patients or the public in this work.
Results
Sociodemographic characteristics
From 1455 mothers, 57.8% were in the age group of 20–29 years. About 51.5% mothers were rural residents. More than half (53%) of mothers were from richest wealth quintile. Ninety-two per cent of the mothers were married at the time of the survey and 29% of mothers had no formal education. The mean birth weight with SD was 3332.4 g (±940.3 g); the smallest and largest birth weights were 500 and 6000 g, respectively. About 12% of the babies weigh <2500 g and 40.7% were perceived as average size baby at birth (table 1).
Sociodemographic characteristics of women and index child, EDHS 2016 (n=1455)
Evaluation of birth weight data for potential measurement error
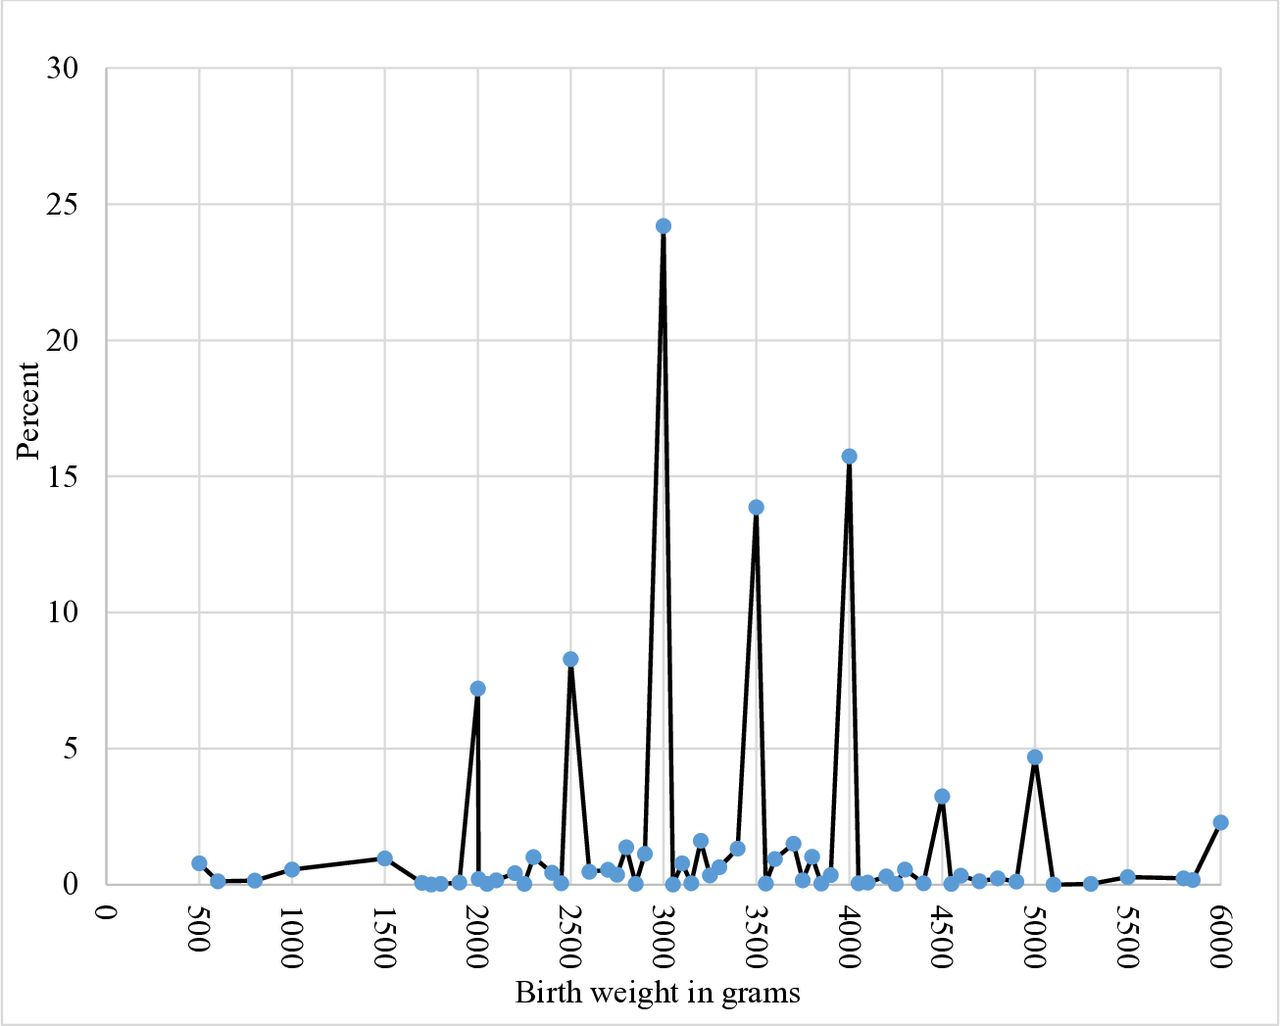
We evaluated the presence of digit preference in the recording of birth weight. Digit preference or also called heaping is a common measurement error that can be introduced into birth weight data because of the tendency of enumerators or respondents to report certain digits at the expense of others.23 24 Eighty-one per cent of the birth weight data had a digit preference to multiple of 500 g and 9% had a digit preference at exactly 2500 g (figure 2). All the birth weight data were heaped to terminal digit ‘0’ or ‘5’. Since we found that majority of the birth weight data were heaped at multiple of 500 g, we examined if there was an association between source of birth weight data and presence of digit preference to multiples of 500 g. The analysis showed that there was no association between digit preference and source of birth weight data, that is, whether obtained from a written card or maternal recall.

Percentage distribution of birth weight data showing digit preference to multiple of 500 g, Ethiopian Demographic and Health Survey (EDHS) 2016.
Accuracy of mothers’ perceived baby size to predict LBW
Maternal perceptions of baby size followed a trend that was similar to that for mean birth weights. As maternally perceived size at birth goes from very large to very small, mean birth weight also consistently goes down from 4057.6 to 2423.5 g (online supplementary table 2). The results obtained from a one-way ANOVA also indicated the presence of significant mean birth weight differences between perceived birth size groups (F=254.4, p<0.001). The post hoc analysis ascertained that the mean differences were significant across all birth size categories (p<0.001) except between small size and very small size categories (p>0.05).
Supplemental material
Sensitivity, PPV, specificity and NPV were determined through comparison of mother-reported baby size at birth with birth weight categories. Maternally perceived birth size responses of ‘very small’ or ‘smaller than average’ were used to measure LBW and the remaining response categories were used to measure NBW. As indicated in table 2, maternal birth size recall correctly identified only 57% (103/180) of actual LBWs and only 41% (103/248) of babies perceived as small by their mothers were actually in the LBW category. Specificity and NPV were nearly 89% (1130/1275) and 94% (1230/1207), respectively, which are higher than sensitivity and PPV.
Accuracy of mothers’ perceived baby birth size to predict low birth weight, EDHS 2016
Babies are categorised into LBW and NBW based on quantitative birth weight data (<2500 g vs ≥2500 g) and maternally perceived birth size (small size vs normal (average or above)). Based on this categorisation, the per cent agreement between maternally perceived baby birth size and birth weight was 86% and kappa statistics indicated a moderate level of agreement (kappa=0.41, p<0.001) (online supplementary table 3).
Supplemental material
Factors influencing concordance of mothers’ perceived baby birth size with birth weight
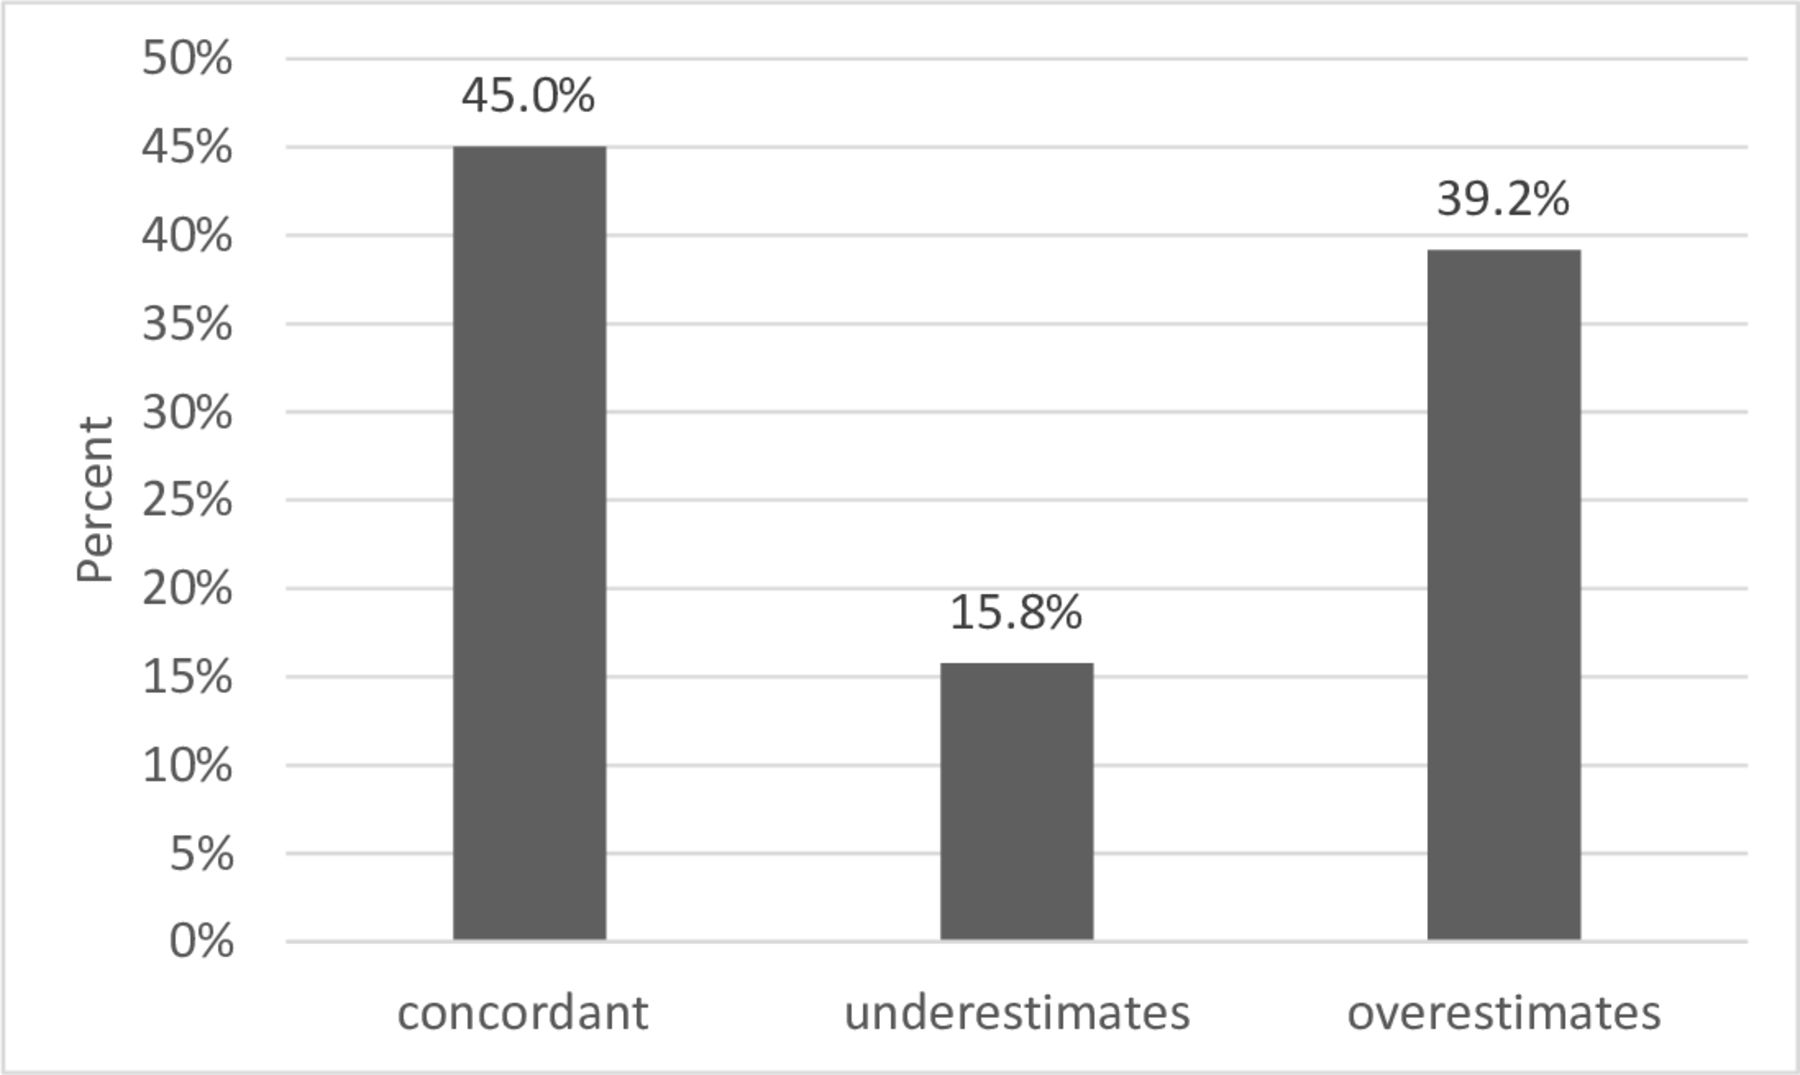
In EDHS data, maternally perceived newborn size was assessed with five ordered categories (‘very large’, ‘larger than average’, ‘average’, ‘smaller than average’ and ‘very small’) while birth weights based on mothers’ self-report or medical record were captured in grams. To compare perceived size and birth weight, the birth weight obtained from card or mother’s recall was normalised and classified into five categories based on SD. Then, matching was done across the categories. Thus, the proportion of concordant responses was 45%. Further classification of the discordant showed that 15.8% of the maternally perceived sizes were underestimates while 39.2% of the maternally perceived sizes were overestimates (figure 3).
Percentage distribution of agreement between birth weight and maternal assessment of baby birth size, Ethiopian Demographic and Health Survey (EDHS) 2016.
We also evaluated the level of agreement between maternal assessments of birth size and birth weight across five ordered categories using kappa statistics. We found concordance between the two measurements of 46%, with the kappa coefficient indicating slight agreement (kappa=0.15, p<0.001) (online supplementary table 3).
A multinomial logistic regression model was fitted to identify factors that influence the incorrect assessment of baby size at birth. Taking ‘concordant’ as the base outcome category, comparisons were made with the remaining response categories. The results indicate that maternal age, household wealth index quintile, marital status and maternal education were significant predictors of discordance (underestimates or overestimates) between birth size and birth weights as compared with concordant responses. Mothers in the 20–29 age group (adjusted OR (AOR) 0.28, 95% CI 0.10 to 0.79) and the 30–39 age group (AOR 0.24, 95% CI 0.08 to 0.72) were less likely to underestimate size than to report concordant size as compared with mothers younger than 20 years of age. Mothers from higher wealth quintile were three times more likely to underestimate baby size at birth compared with mothers from the lowest wealth quintile (AOR 3.11, 95% CI 1.34 to 7.25). Similarly, mothers from higher wealth quintiles were more likely to overestimate baby size at birth compared with mothers from the poorest wealth quintile (AOR 2.34, 95% CI 1.22 to 4.51; table 3).
Factors associated with discordance between mother’s reported baby size and birth weight, EDHS 2016
Mothers who were married at the time of the survey were 68% less likely to underestimate their babies’ sizes at birth than to offer concordant estimates (AOR 0.32, 95% CI 0.17 to 0.61) compared with mothers who had never been married. Mothers who had completed secondary education were less likely than uneducated mothers to overestimate infant size at birth than to offer a concordant estimate (AOR 0.47, 95% CI 0.26 to 0.83; table 3).
Discussion
This study revealed two pertinent findings. First, we found that only 57% of the mothers identified actual LBW implying that a considerable proportion of LBW infants could be misclassified. Second, maternal characteristics were the main factors associated with incorrect estimation of birth size, suggesting that anyone using maternally perceived birth size assessment as a proxy indicator should consider the characteristics of the mothers involved in the study.
This study had limitations that should be considered in the interpretation of the findings. First, we compared estimated newborn birth size against birth weight without considering other size dimensions that likely affect a mother’s judgement of birth size. As Channon13 noted, a mother’s judgement of her newborn’s birth size depends on birth weight and on other size dimensions such as length and subcutaneous fat,13 which were not captured in the DHS data. We also assumed that reported birth weight is correctly measured or recalled. But our analysis suggests digit preferences on birth weight data that could be introduced because of the tendency of enumerators or respondents to report certain digits at the expense of others.24 The level of missing birth weights (85%) might also limit this study because weighed and non-weighed children might have different characteristics. Blanc and Wardlaw revealed that those who were weighed were more likely to have mothers who live in urban areas and who are educated and born in a healthcare facility.11 Moreover, the current analysis included higher proportion of children from the top wealth quintile because of the fact that children with birth weight data were from households with good socioeconomic status.
This study found that mothers’ perceived birth size had low sensitivity and PPV to identify LBW babies in Ethiopia. Ethiopian mothers can correctly identify only 57% of actual LBW newborns (sensitivity=0.57) as small size babies and only 41% of newborns perceived as small size by their mothers were actually LBW babies (PPV=0.41). Maternally perceived baby birth size had high specificity and NPVs to identify NBW babies. This implies that Ethiopian mothers can correctly identify larger newborns as large but they are less likely to identify smaller newborns as small. The high specificity of maternally perceived birth size might contribute to the overall high per cent agreement (86%) between maternally perceived birth size and birth weight in categorising the newborns into LBWand NBW babies. The per cent agreement (46%) between these two measurements was low when evaluated based on five level categories of maternally perceived birth size and birth weight with the kappa coefficient indicating slight agreement (kappa=0.15, p<0.001). Therefore, using maternally perceived birth size as proxy indicator to quantify the prevalence of LBW underestimates the magnitude which might lead to underestimation of the contribution of LBW for child mortality and future health and economic burden. Moreover underestimation of the true LBW prevalence is another reason for LBW newborns not to get priority in nutrition and public health intervention. Our findings are consistent with study done in Cameroon with comparable sensitivity (60%), specificity (93%), NPV (96%) and PPV (44%) scores.25 Our results are also consistent with others11 14 that have noted that maternally perceived small birth size as reported in surveys is not a sensitive indicator of LBW. Studies done in Nepal, Uganda and Colombia found relatively higher sensitivity (66%–76%) than our study.15 26 27
The use of maternal birth size assessment as a proxy indicator of birth weight might be affected by various factors. Our study found that maternal age was significantly associated with accurate estimation of birth size. Older mothers were less likely than younger mothers to underestimate birth size. Previous studies examining the association between maternal age and correct estimation of birth size have reported mixed results.12 Channon reported that, in Malawi, mothers who were younger than 20 years of age were more likely to classify their infants as smaller than their actual correct sizes compared with mothers aged 20–29 years. The same study revealed that older mothers were more likely to overestimate their baby’s sizes in Malawi while in Cambodia mothers were less likely to overestimate their newborns’ birth sizes.12 The association of maternal age and perceived baby size warrants further investigation.
In this study wealth index quintile was significantly associated with misclassification of newborn birth size. As compared with the poorest wealth quintile mothers, being in richer wealth quintile was associated with both underestimation and overestimation of birth size. This may reflect the fact that well-to-do mothers are more likely to perceive their newborns as normal, presumably because of good prenatal care, perhaps in their minds reducing the chance of bearing an LBW newborn. Alternatively, the tendency to misclassify birth size among wealthier mothers in our study could also be due to social desirability bias, as evidenced in Tate et al, who found that mothers with smaller newborn tended to overestimate the babies’ weight while those with larger newborns tended to underestimate the babies’ weight.28 The association of richer wealth quintile with both underestimation and overestimation of the birth size as compared with the poorest wealth quintile might also be attributed to the fact that majority of the women included in this analysis were from the highest wealth quintile. However, still this needs further investigation to characterise which of the mothers from rich wealth quintile underestimate or overestimate the baby birth size.
We found that currently married mothers were less likely to underestimate their newborn’s sizes than never married mothers. Similarly, in Kazakhstan, never married mothers were less likely to correctly assess their babies’ sizes than currently married counterparts.12 We also found that better maternal education was significantly associated with lower odds of overestimation of birth size. Educated mothers had lower odds to overestimate their newborn’s size than uneducated mothers, but underestimation did not associate with maternal educational status. A similar finding was reported from Gabon, Uganda, Cameroon and Nepal which showed that mothers with better educational status were more likely to give accurate estimate than non-educated mothers.12 15 25 26 This might reflect the fact that educated women are well informed about the relationship between newborn size and birth weight, a benchmark which likely influences their ability to estimate correctly. In addition, numerical recall might be better among educated women. For example, a study relating birth weight recall and educational level revealed that fewer years of education were significantly associated with greater birth weight recall bias.27
Conclusions
Maternal assessment of birth size is a less sensitive proxy indicator of LBW in Ethiopia. Hence, estimation of the prevalence of LBW based on maternal assessment of birth size underestimates the magnitude of the actual problem. Maternal characteristics such as age, wealth status, marital status and education were significant predictors of discordant birth size assessments. It is recommended that maternal recall on birth size should be used as a proxy indicator with caution and researchers and healthcare workers should consider differences in maternal characteristics such as age, wealth status, marital status and education.
Checklist and flow diagram for the appropriate reporting
We used the STROBE 2007 (v4) statement—checklist for reporting cross-sectional study.
Acknowledgments
The authors thank ICF Macro International for allowing us to use the 2016 Ethiopian Demographic and Health Survey data set for free. We also thank Patricia Malloy (assistant professor) at the University of Saskatchewan for English language editing.
References
Footnotes
Contributors DN conceived the study, performed the data analysis, contributed in the interpretation of data and drafting the manuscript and critically reviewed the manuscript. DH conceived the study, contributed in the interpretation of data and critically reviewed the manuscript. BG contributed in the interpretation of data, drafted the manuscript and critically reviewed the manuscript. YMT contributed in the interpretation of data and critically reviewed the manuscript. All authors read and approved the final manuscript.
Funding The authors have not declared a specific grant for this research from any funding agency in the public, commercial or not-for-profit sectors.
Disclaimer We used the STROBE 2007 (v4) statement—checklist for reporting cross-sectional study.
Competing interests None declared.
Patient consent for publication Not required.
Provenance and peer review Not commissioned; externally peer reviewed.
Data availability statement Data may be obtained from a third party and are not publicly available.