Article Text

Abstract
Objective Cancer is a leading killer worldwide, including Australia. Cancer diagnosis leads to a substantial burden on the individual, their family and society. The main aim of this study is to understand the trends, determinants and inequalities associated with cancer incidence, hospitalisation, mortality and its burden over the period 1982 to 2014 in Australia.
Settings The study was conducted in Australia.
Study design An incidence-based study design was used.
Methods Data came from the publicly accessible Australian Institute of Health and Welfare database. This contained 2 784 148 registered cancer cases over the study period for all types of cancer. Erreygers’ concentration index was used to examine the magnitude of socioeconomic inequality with regards to cancer outcomes. Furthermore, a generalised linear model was constructed to identify the influential factors on the overall burden of cancer.
Results The results showed that cancer incidence (annual average percentage change, AAPC=1.33%), hospitalisation (AAPC=1.27%), cancer-related mortality (AAPC=0.76%) and burden of cancer (AAPC=0.84%) all increased significantly over the period. The same-day (AAPC=1.35%) and overnight (AAPC=1.19%) hospitalisation rates also showed an increasing trend. Further, the ratio (least-most advantaged economic resources ratio, LMR of mortality (M) and LMR of incidence (I)) was especially high for cervix (M/I=1.802), prostate (M/I=1.514), melanoma (M/I=1.325), non-Hodgkin's lymphoma (M/I=1.325) and breast (M/I=1.318), suggesting that survival inequality was most pronounced for these cancers. Socioeconomically disadvantaged people were more likely to bear an increasing cancer burden in terms of incidence, mortality and death.
Conclusions Significant differences in the burden of cancer persist across socioeconomic strata in Australia. Policymakers should therefore introduce appropriate cancer policies to provide universal cancer care, which could reduce this burden by ensuring curable and preventive cancer care services are made available to all people.
- cancer incidence
- mortality
- cancer burden
- socioeconomic inequalities
- remoteness
This is an open access article distributed in accordance with the Creative Commons Attribution Non Commercial (CC BY-NC 4.0) license, which permits others to distribute, remix, adapt, build upon this work non-commercially, and license their derivative works on different terms, provided the original work is properly cited, appropriate credit is given, any changes made indicated, and the use is non-commercial. See: http://creativecommons.org/licenses/by-nc/4.0/.
Statistics from Altmetric.com
Strengths and limitations of this study
This study examined the trends, determinants and inequality in terms of incidence, mortality, hospitalisation and associated burden of cancer (eg, years life lost, years lost due to disability and disability-adjusted life years) in the Australian context over a 33 year period.
This study was not captured in details inequalities regarding the cancer survivorship in terms of stage, treatment procedures and utilisation of healthcare.
Although we have limited understanding of what is driving these changes in cancer outcomes as reported here they may reflect random variation or changes in unknown risk factors, and therefore highlight the need for more research into the aetiology of cancer.
Background
Non-communicable diseases (NCDs) are accountable for the majority of global deaths.1 Cancer is expected to rank as the most significant global public health problem and a leading cause of death and illness in the world in the 21st century2–6 including Australia.7 In 2019, it is estimated that almost 145 000 new cases of cancer will be diagnosed in Australia, and 35% of these individuals will eventually die from the disease.7 Cancer accounts for the highest burden of disease of any illness, at approximately 18% (19% for males; 17% for females), followed by cardiovascular disease (14%), musculoskeletal (13%) and mental health (12%).8 Approximately 40% of cancer patients are of working age in Australia.7 Among those in employment, 46% are unable to return to work after an episode,9 and 67% return to employment or change their job after being diagnosed.10 The majority of cancer survival patients depend on family, relatives and friends for physical and economical support during their treatment and/or in the last stages of the disease.9–12 Cancer-related illness results in a substantial number of patients experiencing economical hardship due to high out-of-pocket expenses (eg, medicines and treatments, including diagnostics), lost productivity, loss/reduction of household income and other induced expenditure.9 10 12 13 The economic burden of cancer is of growing concern for policymakers, healthcare practitioners, physicians, employers and society overall.10 12 Furthermore, the magnitude of the cancer burden increases significantly with remoteness from treatment sources and those individuals in depressed socioeconomic circumstances.14–16 Considerable progress has been made in recent decades in terms of cancer survival and reduced mortality rates17 18 through several initiatives including introducing primary preventive strategies and effective collaboration with non-government organisations and other stakeholders. Therefore, a reduction of cancer incidence, along with improvements in cancer treatments and therefore survival rates, are essential to reduce the burden of the disease.
Economic disparities between socioeconomically advantaged and disadvantaged individuals and groups are worsened by the increasing burden of cancer in Australia.15 The lack of appropriate services are significantly worse in resource-poor settings, including geographically disadvantaged areas compared with more advantaged people and communities with easier access to a greater range of cancer services, increased knowledge and awareness of cancer prevention and better and more easily accessible health facilities and resources.15 19 20 Other common reasons for such disparities include limited affordability and accessibility of cancer care services for individuals from socioeconomically disadvantaged groups,16 and their inadequate utilisation of healthcare.21 Thus, increased cancer incidence leads to a higher overall burden for the individual, family and society, which is exacerbated for the more disadvantaged.
In the recent past, disparities related to cancer outcomes have become the subject of international focus and new service initiatives.2 6 In 2016, the WHO Executive Board recommendation was to strengthen health systems to ensure early detection and diagnosis, as well as accessible, affordable and appropriate and quality healthcare services for all patients with cancer.22 Only a few studies have focused explicitly on socioeconomic inequality of cancer care and healthcare utilisation in Australia. This study therefore purposes to provide data and analysis on trends in cancer incidence, mortality rates, hospitalisation and associated burden (years life lost, YLL; years lost due to disability, YLD and disability-adjusted life years, DALYs) for the most prevalent malignancies among Australians, by sex, state, remoteness and socioeconomic status, using routinely collected health data for the period of 1982 to 2014.
There is an extensive body of research on the many different dimensions of cancer. In recent decades, the cancer incidence has increased,5 17 23–25 which has been more pronounced among adolescents and young adults,26 and older adults,27 yet cancer-related mortality rates have slightly dropped.28 Some types of cancer in Australia are the highest in the world: melanoma,26 keratinocyte and melanocyte.29 Australia and New Zealand together have the highest rates for Merkel cell carcinoma.30 31 A number of studies have focused on geographical or socioeconomic disparities in cancer care and survival.32–38 These have usually been conducted in small settings at the Australian state level. No previous studies have attempted to measure the trends, associated determinants and magnitude of socioeconomic inequalities of cancer outcomes (eg, incidence, mortality, hospitalisation and burden of cancer - YLL, YLD, DALYs) over time. Therefore, national level trends, the differential socioeconomic inequality of cancer outcomes, as well as influential factors associated with the cancer burden in Australia are unclear.
Furthermore, the study’s findings will provide authorities with national evidence about the trends and magnitude of the inequalities in cancer burden and hopefully assist in developing low-cost interventions to reduce this burden. This study thus aims to examine the trends, associated determinants and magnitude of socioeconomic inequality as related to incidence, mortality, YLL, YLD and DALYs, as a result of cancer.
Methods
Study design
An incidence-based approach was used to examine the trends and socioeconomic inequalities associated with adverse cancer outcomes in Australia. A health system perspective was adopted and cancer-related data were accessed from organisations that are committed to promote, restore or maintain health and well-being.39 40 The study population represented different population subgroups using characteristics such as sex, geographical distribution and economic circumstances.
Australian health system
Australian health system (AHS) provides quality and affordable healthcare services for all Australians. It is operated by three levels of government: federal (financing), state and territory (funding and service delivery) and local (service delivery).41 The foundation of AHS is the publically funded national universal health insurance scheme, Medicare and its predecessor Medibank which commenced in the 1970s to promote universal healthcare by providing safe and affordable healthcare services for Australians. Through Medicare, patients are able to access medical services, treatment in public hospitals free of charge, receive subsidised out of hospital treatment and medicines. Those eligible to access healthcare services through Medicare include: Australian and New Zealand citizens, permanent residents of Australia and individuals who have applied for a permanent visa.42 On the other hand, overseas student health cover is mandatory for all international students, to ensure they and their dependents can access affordable healthcare while living and studying in Australia. Patients are provided a rebate benefit for healthcare services for out of hospital services.
The rebate amount is case dependent. For example, for a consultation with a general practitioner (GP), specialist or consultant physician of at least 10 min duration on a patient with cancer to develop a multidisciplinary treatment plan, the schedule payment is $A81.50 in 2019, and the benefit is 100% of the schedule fee; hyperbaric oxygen therapy associated with treatment of localised non-neurological soft tissue radiation injuries has a schedule fee of $A254.75 and the benefit is 75% of the schedule fee, or $A191.10.42 While public hospitals are free of charge, the majority of out of hospital healthcare services are provided by private health providers. The actual amount of fees for service is set by the providers themselves and are not regulated, meaning that private healthcare providers can make their fees above the schedule payment. Any difference between the amount of the providers fee for a service and the amount of rebate is paid by the patient from their out-of-pocket (OOP). For example, if the actual amount charged of a provider is $A81.50 for a diagonostic (eg, blood) test, Medicare would provide a rebate of $A69.30 (75% of the schedule fee), leaving the patient to pay $A12.20. Medicare has additional policies to protect patients from catatrophic OOP healthcare payments. In this context, healthcare cards are provided to welfare recipients and low income earners, and other eligible patients who pay a lower OOP payment for prescription medicines.43 The ‘Medicare Safety Net’ and ‘Extended Medicare Safety Net’ Programmes also provide higher rebates if an individual or family group reaches a certain level of total expenditure on OOP fees within a calendar year. Any subsequent services or prescriptions will have a higher proportion subsidised for the rest of that calendar year.44 Under the ‘Medicare Safety Net’, once the threshold is reached then 100% of the schedule fee for all healthcare services is rebated; and under the ‘Extended Medicare Safety Net’ 80% of the actual OOP payments are rebated.45
Data sources
Various cancer-related national data sources were accessed. Data on cancer incidence, mortality and hospitalisation were extracted from the publicly accessible Australian Institute of Health and Welfare (AIHW) online database7 and cancer-related published reports.8 46 AIHW accumulates data from the Australian Cancer Database (ACD), National Mortality Database (NMD) and National Hospital Morbidity Database (NHMD). ACD accumulates and manages all sorts of cancer data from each Australian state and territory under legal mandate since 1982. Different types of hospitals (eg, government and non-government), clinics, laboratories other organisations and institutions are required to report all cancer cases to the central cancer registry (CCR). The CCR data is delivered to the AIHW on an annual basis, where it is accumulated into the ACD. The NMD includes information supplied by the registries of births, deaths and marriages and the national coronial information system. These data are then coded by the Australian Bureau of Statistics (ABS) and are incorporated into the NMD. The NHMD is an accumulation of episode-level records of hospitalised patient morbidity data collection systems (eg, all acute and psychiatric hospitals, freestanding day hospital facilities and alcohol and drug treatment centres). Further, cancer burden-related data is collected via the Australian Burden of Disease Study (ABDS). Data were retrieved from the published reports of ABDS-2011 and ABDS-2015, the last two that explicitly included cancer.8 46 Death caused by cancer was considered as the fatal burden (eg, YLL) and this data was sourced from the NMD. The non-fatal cancer burden related data emanated from different administrative sources including NHMD, ACD, NMD and some epidemiological studies. ABDS amassed data on some other parameters from the Global Burden of Disease studies of 2010 and 2013 that covered the standard life table for fatal burden (YLL), health status and disability weights for the non-fatal burden (YLD) and relative risks and the risk factor attribution.8 46 The present study used these national level accumulated data in the analysis.
Study population
A total of 2 784 148 registered cancer cases (male=1 537 882; female=1 246 265) were accessed, based on data from 1982 to 2014 in Australia (table 1). In addition, to revealing the trends of cancer-related mortality over the same period, a total of 1 165 552 cancer-related deaths (male=6 59 105; female=5 06 447) were considered. Due to the paucity and availability of data related to cancer outcomes, a total of 591 631 registered cancer cases during the period from 2008 to 2012 and a total of 217 349 cancer-related deaths during 2010 to 2014 were used to examine inequality in cancer incidence and cancer-related mortality in Australia.
Characteristics of the study parameters
Measurement of cancer parameters
The age-standardised cancer incidence, or mortality rate, was measured using the number of new cases diagnosed or deaths for a specific age group, divided by the mid-year population of the same age group and year. Similarly, cancer incidence or mortality rate was estimated from the total number of new cases diagnosed or deaths across all age groups combined, divided by the mid-year population. These rates were interpreted as the number of new cases of cancer or deaths per 100 000 population. Cancer related burden estimation was undertaken using the burden of disease methodology.8 46 In the ABDS, the burden of cancer was calculated through the DALY by summing up the fatal burden (ie, YLL) due to premature cancer-related mortality and the non-fatal burden (ie, YLD) for patients surviving the condition.
 (1)
(1)
 (2)
(2)
 (3)
(3)
Where, n=number of deaths; L (YLL)=standard life expectancy at the age of death in that year; I=number of people with each type of cancer cases; DW=disability wt; r=discount rate; L (YLD)=duration of disability in years.
Definition of some potential factors
Index of economic resources
The magnitude of inequality in cancer outcomes was examined using an index of relative socioeconomic disadvantage (IRSD). The IRSD was developed by the ABS using potential factors like average household income, education level and unemployment rates.47 It is a geographical area-based estimate of socioeconomic status where small geographical settings of Australia are categorised from economically disadvantaged to wealthy. This index is employed as a proxy for the socioeconomic status of the people living in different geographical settings in Australia. The cut-offs value for each of the quintiles are as follows: Q1 (IRSD ≤927.0), Q2 (927.0> IRSD ≤965.8), Q3 (965.8> IRSD ≤1001.8), Q4 (1001.8> IRSD ≤1056.0) or Q5 (IRSD >1056.0).47 The most disadvantaged socioeconomic quantile (Q1) corresponds to geographical settings covering the 20% of the population with least advantaged socioeconomic areas, and the fifth quintile (Q5) refers to the 20% of the population with the most advantaged socioeconomic areas.
Remoteness
Remote locations exist in each state and territory of Australia and are based on the accessibility to services and Remoteness Index of Australia, which is constructed by the Australian Population and Migration Research Centre at the University of Adelaide.48 Remoteness was classified into six groups: major cities, inner regional, outer regional, remote, very remote and migratory. Migratory was excluded from the current analysis due to the paucity of information. The category of the major cities included Australia’s capital cities, except Darwin and Hobart, which were treated as an inner regional.
Data analysis
Trend analysis
Trend analysis of cancer incidence, cancer-related mortality rates, hospitalisations and burden of cancer were performed using the ACD (from 1982 to 2014), NMD (1982 to 2014), NHMD (2000 to 2015) and ABDS (2011 to 2015) population data sets, respectively. Trend analyses were done across sex, state and socioeconomic status over these periods. To identify changes in cancer parameters trends, joinpoint regression analysis was performed using the Joinpoint Regression Programs, V.4.5.0.1.49 The annual percentage change (APC) in rates between trend-change points (ie, joinpoint segment) was calculated, and it also estimated the average annual percentage change (AAPC) in the whole study period. A negative APC indicates a decreasing trend whereas a positive APC indicates an increasing trend. Furthermore, increased or decreased APC of cancer-related outcomes were examined by the magnitude of cancer’s impact over the period.
To measure the APC, the following model was used:
 (4)
(4)
where, log (Y x ) is the natural logarithm of the rate in year x. Then, the APC from year ‘x’ to year ‘x+1’ was:
 (5)
(5)
Then, AAPC was estimated as a weighted average of the estimated APC in each segment by using the segment lengths as weights.
 (6)
(6)
where, Si=i th segment lengths (i=1, 2, 3, …, n), APCi=i th annual percentage change.
Measuring socioeconomic inequality
Index of Economic Resources (IER) was measured in quintiles, with the first quintile (Q1) representing the lowest 20% of the total population living in the most impoverished socioeconomic areas, and the fifth quintile (Q5) representing the top 20% of the total population living in the most prosperous socioeconomic areas. Inequality analyses were constructed for cancer incidence, cancer-related mortality and DALYs across the different IER quintiles. The absolute and relative differences (eg, least advantaged-most advantaged difference, LMD and least advantaged-most advantaged ratio, LMR) in cancer incidence, cancer-related mortality, YLL, YLD and DALY were calculated to examine the magnitude and direction of the cancer outcomes across different socioeconomic groups. A high value of the LMR and LMD represents a high degree of socioeconomic inequality.16 The ratio of cancer mortality and incidence (M/I) was measured to capture the survival inequality of cancer patients. The measures of the concentration index (CI) (Erreygers’ CI) was used to examine the magnitude of socioeconomic inequality and the trends in adverse cancer outcome changes during the period.50
Multivariate analysis
The fatal cancer burden (eg, YLL) was considered as the outcome variable in the analytical exploration. YLL is characterised by a large cluster of data and a right-skewed distribution, but the zero values were excluded from the analysis. The natural logarithm of YLL was used to reduce the effects of the skewed nature of the burden of cancer data. In the multivariate analysis, natural logged YLL was predicted using different patients’ characteristics related to demographics (eg, sex), state, socioeconomic position and geographical distribution (eg, remoteness). A generalised linear model (GLM) was constructed to examine these associations. The model was tested for sensitivity by including and excluding specific variables and estimating the robust SEs. A series of diagnostic tests were performed, such as tests on the presence of heteroscedasticity, multicollinearity and omitted variables. The Breusch-Pagan/Cook-Weisberg test was used to check the presence of heteroscedasticity in the model. Variance Inflation Factor test was performed to examine the presence of multicollinearity. The Ramsey Ramsey Regression Equation Specification Error Test (RESET) test was to check if there is any omitted variable bias in the model. The outcome of the GLM analysis is presented as adjusted regression coefficients with robust SEs along with 95% CIs. Data management and all statistical analyses were performed using Stata/SE 13.0 (StataCorp, College Station, Texas, USA). A p value <0.05 was considered statistically significant.
Ethics
This study was conducted using the publicly accessible AIHW online data sources and cancer-related published reports. Ethical approval was not required from an institutional review board because the patient information was de-identified.
Patient and public involvement
Patient and public were not involved in the design or planning of this study.
Results
Trends in cancer incidence and cancer-related mortality
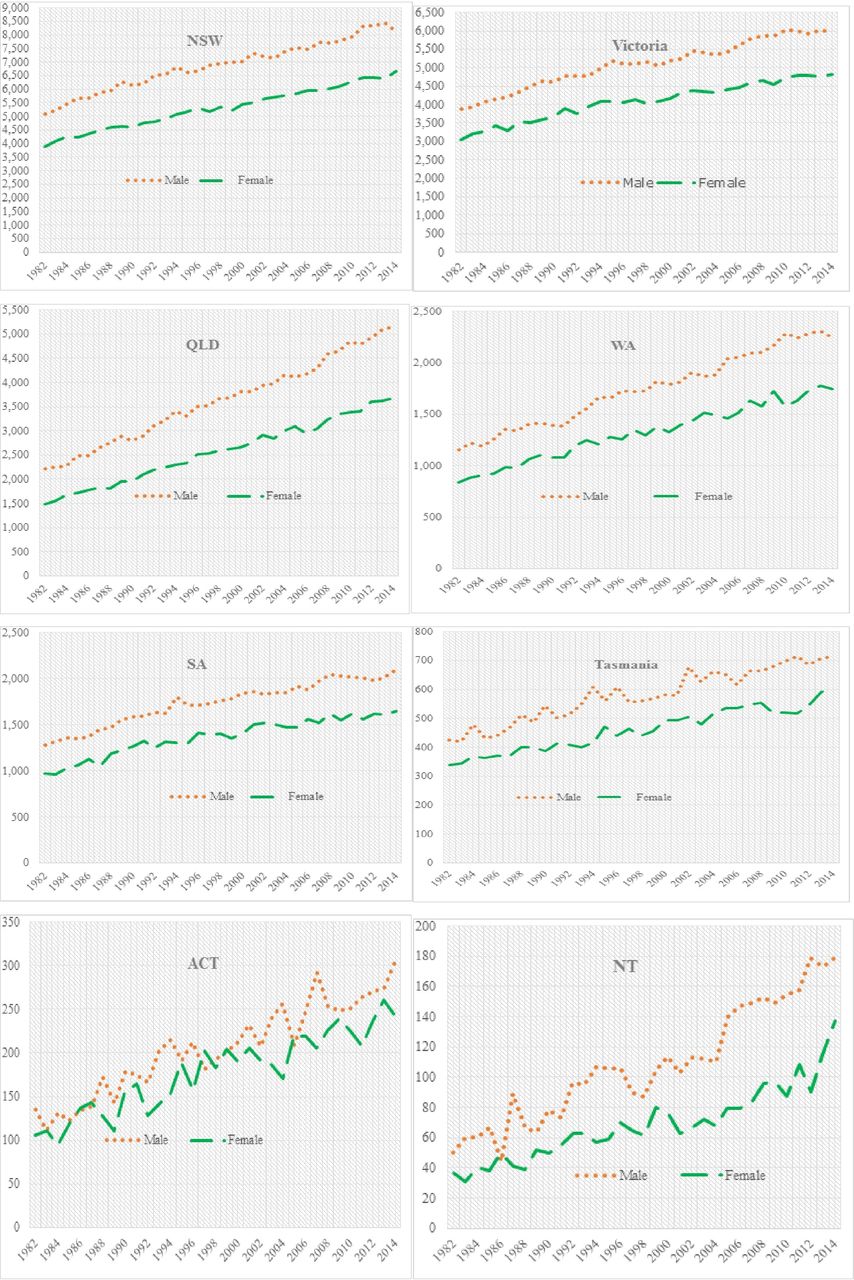
The overall incidence of cancer among males significantly increased from 1982 to 1994, and then increased exponentially until 2014 (figure 1). The rate of cancer incidence among females also showed an increasing trend from 1982 to 2014. The cancer incidence rate increased from 1984 (2507 cases) to 1991 (3896 cases) in South Australia, after which the rate increased slightly during the period 1992 (3994 cases) to 2002 (4127 cases), and then increased again until 2014 (5392 cases). A similar trend was observed for males in New South Wales and Western Australia. A sharp reduction of cancer incidence was seen during 1994 (1333 cases) to 1997 (1100 cases), and the overall rate increased during 1998 to 2008 (1124 cases to 1889 cases) in Tasmania. In the Northern Territory and Australian Capital Territory, the incidence of cancer increased exponentially for both males and females throughout the period. The overall cancer-related mortality rate also increased for both males (eg, 5000 cases in 1982 to 8470 cases in 2014) and females (eg, 3952 cases in 1982 to 6490 cases in 2014) in New South Wales from 1982 to 2014. Further, a similar trend was observed for male and female in Victoria, Queensland, Western Australia, South Australia and Tasmania during the period 1982 to 2014 (figure 2). However, in the Northern Territory and Australian Capital Territory, little change from the trend was observed.

Trends of cancer incidence by sex and state, Australia, 1982 to 2014. ACT,Australian Capital Territory; NSW, New South Wales; NT, Northern Territory;QLD, Queensland; SA, South Australia; WA, Western Australia.
Trends of cancer mortality by sex and state, Australia, 1982 to 2014. ACT,Australian Capital Territory; NSW, New South Wales; NT, Northern Territory;QLD, Queensland; SA, South Australia; WA, Western Australia.
Distribution of average annual percentage change in cancer incidence and cancer-related mortality
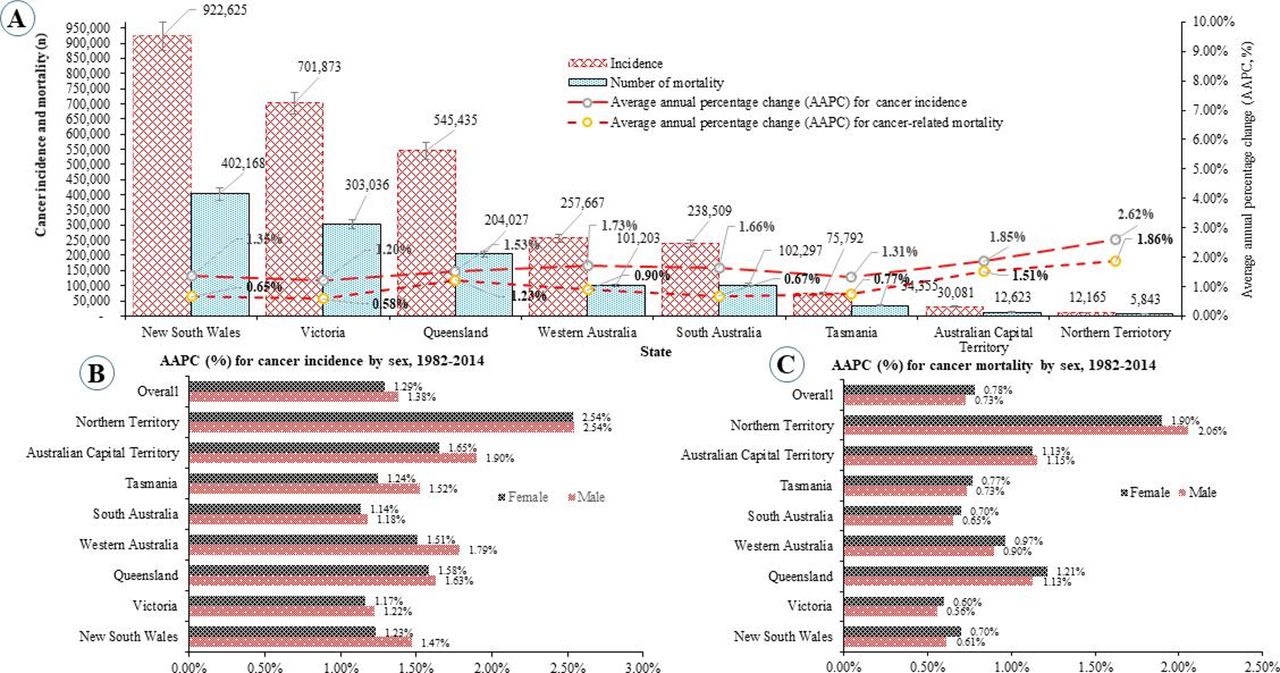
Cancer incidence was measured as an AAPC over the period 1982 to 2014 (figure 3). Cancer incidence increased by an AAPC of 1.33% over the period 1982 to 2014, with the AAPC slightly higher for males 1.38% compared with females 1.29%. The highest AAPC was found in Northern Territory (2.57%), followed by the Australian Capital Territory (1.78%) and Western Australia (1.65%). In New South Wales (NSW), the rate of cancer incidence increased steadily from 1982 to 1994 and then oscillated until 2013. Similarly, the percentage change of cancer incidence rate increased among females over time. Cancer mortality rate rose 0.76% from 1982 to 2014, and the mortality rate among females (0.78%) was slightly higher compared with males (0.73%). In the Northern Territory, cancer-related mortality rate was comparatively very high among males (1.98%), while cancer-related mortality rates were found to be comparatively highest among females in Queensland (1.21%) and Australian Capital Territory (1.13%).

Distribution of cancer outcomes in Australia, 1982 to 2014.
Trends in cancer-related hospitalisation
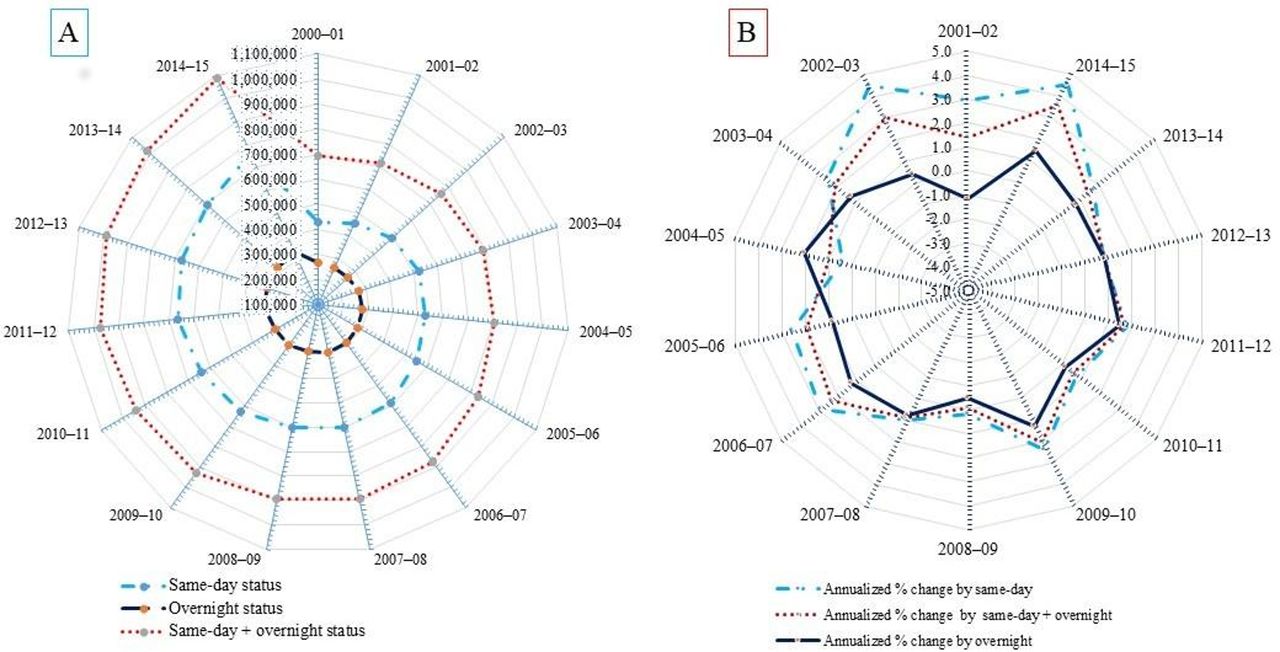
A total of 13 213 340 cancer-related hospitalisation cases were observed, of which 66.91% were for same-day treatment and 33.09% were overnight hospitalisations (figure 4). The AAPC of overall cancer-related hospitalisations increased by 1.27% as a whole, wherein same-day and overnight were 1.35% and 1.19%, respectively, higher over the period. The overnight hospitalisation rate fell over the period with a comparative increase in the same-day hospitalisation rate.

Distribution of cancer-related hospitalisations by same-day and overnight status in Australia, 2000 to 2015. AAPC, average annual percentage change; ACT, AustralianCapital Territory; NSW, New South Wales; NT, Northern Territory; QLD,Queensland; SA, South Australia; TAS, Tasmania; VIC, Victoria; WA, WesternAustralia.
Trends in fatal cancer burden
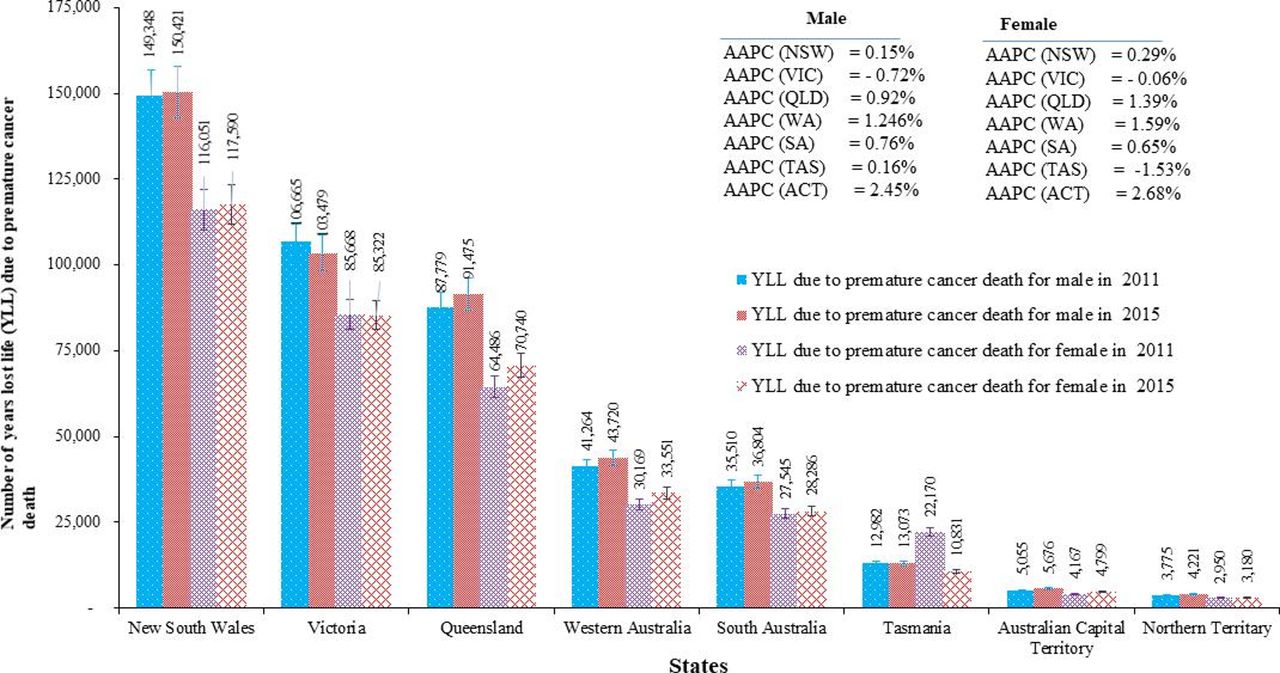
An upward trend of the fatal burden of cancer was observed over the 2011 to 2015 period (figure 5). Males experienced a relatively higher burden (AAPC=0.89%) compared with females (AAPC=0.78%). The magnitude of the burden also varied across the states. For example, the rate of years of life lost increased by 9950 YLL (AAPC=1.16%) in Queensland, 2612 YLL (AAPC=0.22%) in NSW, 5838 YLL (AAPC=1.42%) in Western Australia, 2034 YLL (AAPC=0.63%) in South Australia and 1253 YLL (AAPC=2.57%) in the Australian Capital Territory. A major reduction in the fatal burden of cancer occurred among females (11 339 YLL, AAPC=−1.53%) in Tasmania and for males (3532 YLL, AAPC=−0.72%) in Victoria.

Trends of fatal burden of cancer across states, Australia, 2011 to 2015.
The magnitude of socioeconomic inequality for cancer patients
Cancer incidence was highest among the poorest quintile (table 2). Similarly, the age-specific cancer incidence was marginally highest among the poorest group. Furthermore, the poorest were 1.083 times more likely to be exposed to cancer than the richest and the poor/rich difference amounted to an additional 9873 cases per year. The cancer-related mortality rate difference was even starker with the LMR (1.513 times) and LMD (17 770 cases/100 000 persons). The overall ratio of (LMR of mortality) and (LMR of incidence) was high (M/I=1.276). Again, it has been revealed that nearly 34% more least advantaged group of people experienced cancer-related mortality compared with most advantaged economic resources of people. The overall magnitude of cancer incidence (CI=−0.029, p<0.01) and cancer-related mortality rate (CI=−0.011, p<0.05) were highest in the least advantaged group.
Socioeconomic inequality of cancer incidence and mortality in Australia
This skewed distribution was also true for the individual types or sites of cancer (table 3). The highest contributors to the socioeconomic inequality-mortality gap were colorectal (LMR=1.327 times), pancreas (LMR=1.336 times), lung (LMR=1.965 times), cervix (LMR=1.363 times), kidney (LMR=1.344 times), bladder (LMR=1.433 times) and unknown primary cancer (LMR=1.660 times). Further, the ratio (LMR of mortality) and (LMR of incidence) was especially high for cervix (M/I=1.802), prostate (M/I=1.514), melanoma (M/I=1.325), non-Hodgkin's lymphoma (M/I=1.325) and breast (M/I=1.318), suggesting that survival inequality was most pronounced for these cancers. The high value of the concentration index (CI) of different cancers, such as lung (CI=−0.060), melanoma (CI=−0.087), breast (CI=−0.104), prostate (CI=−0.076) and non-Hodgkin's lymphoma (CI=−0.078), indicates that cancer incidence was disproportionately distributed in the least economic resources quintile. In addition, a high degree of inequality in cancer related-mortality occurred across the different economic resources quintiles. Significant negative CI of mortality by different types of cancer, such as lung (CI=−0.066), melanoma (CI=−0.034), breast (CI=−0.048), cervix (CI=−0.095) and unknown primary cancer (CI=−0.043), reflected that mortality due to these types of cancers was more highly concentrated among the least advantaged economic resources group. Likewise, the number of deaths related to all types of cancer was highest among the least advantaged group. As a result, LMR is more than 1, and LMD is positive for all types of cancer-related mortality.
Distribution of cancer cases (2008 to 2012) and cancer-related mortality (2010 to 2014) by cancer site/type and socioeconomic status in Australia
The magnitude of the fatal burden of cancer increases with a decline of the socioeconomic status of cancer patients (table 4). A notable difference was observed in the distribution of the fatal burden of cancer between the least advantaged and most advantaged quintiles. In 2011, people in the least advantaged quintile experienced high YLL (LMR=1.50 times, LMD=62.00 YLL/1000 persons) compared with the richest quintile, and it had increased again slightly by 2015 (LMR=1.57 times, LMD=66.00 YLL/1,000 persons). The annual rate of years of life lost declined constantly (AAPC=−0.87%) across different quintiles over the period, and the rate of reduction was greatest in the most advantaged quintile (AAPC=−1.69%) compared with the least advantaged quintile (AAPC=−0.63%). The fatal burden of all cancers was found to be highest in the least advantaged quintile (table 5). The annual reduction rate of cancer burden was highest in the most advantaged quintile compared with the least advantaged quintile. People diagnosed with cancer from the least advantaged economic resources areas bear a significant share of the total fatal burden (25%) compared with people from the most advantaged quintile (15%) (online supplementary appendix figure A1). However, a reduction in the share of fatal burden of cancer has been observed across all quintiles except the second quintile (AAPC=0.65% for Q2).
Supplemental material
Burden of cancer (YLL, YLD and DALY/1000) across socioeconomic groups, 2011 to 2015
Trends in socioeconomic inequality of fatal cancer burden (years lost life/1000) by cancer type, 2011 to 2015
Factors influencing the fatal burden of cancer
The regression coefficients were interpreted as the effect of a 1% change in the characteristics of cancer patients on the 1% change in YLL (table 6). These results show that a 1% increase in the proportion of male cancer patients slightly increased the YLL from 3.87% to 4.19%. In very remote areas the YLL increased by 32.05% in 2011 but reduced in 2015 by 22.75%.
Association of fatal cancer burden (natural logged of years of life lost) with sex, remoteness, location and socioeconomic resources
However, the cancer burden was significantly increased for those who lived in remote, inner or outer regional areas during the period. In terms of geographical distribution, patients from New South Wales (32%) experienced a significantly higher burden, followed by Victoria (30%) and Queensland (25%), but the changes were stable during this period. In Western Australia and Tasmania, the burden of cancer significantly increased, by 15.72% to 20.80% and 6.29% to 7.90%, respectively. However, the burden of cancer declined for others, including the Northern Territory from 3.77% to 2.43%, and South Australia from 18.65% to 16.65%. Similarly, the magnitude of the cancer burden increased for those in the least advantaged economic resource quintiles.
Discussion
This study aimed to reveal the trends in cancer incidence, related mortality and cancer burden, as well as measure the magnitude of inequality in cancer mortality, incidence and DALYs during the period of 1982 to 2014 in Australia. The study design was an incidence-based on from a health system perspective. Overall incidence and mortality showed an upward trend over the period and the highest average increase in incidence was found in the Northern Territory, Australian Capital Territory and Western Australia. Also, the proportion of cancer-related hospitalisation has increased and is dominated by same-day hospitalisations. Further, the survival inequality in terms of LMR of mortality and LMR of incidence was especially high for prostate, cervix, melanoma, non-Hodgkin's lymphoma and breast, suggesting that survival inequality was most pronounced for these cancers. Overall, the fatal burden of cancer exhibited an increasing trend over the period.
The study’s findings support a growing body of research evidence that has found the incidence of cancer and cancer-related mortality to be increasing in other country settings.14 51–54 These increasing trends have been pronounced in the last couple of decades globally.6 52 53 The WHO55 and the Sustainable Development Goals56 have outlined the increasing burden of non-communicable diseases that include cancer, and have promoted initiatives to control and prevent future increases through action plans. Still, the burden of cancer has been growing in Australia over the last decades.24 Four driving forces have contributed to this: first, increased exposure to risk factors (for example, unbalanced and industrialised-type diets)57 as well as a high prevalence of obesity58 59; second, improved health outcomes (eg, life expectancy)4 and demographic transition (eg, ageing and growth of population)5 has reduced death rates compared with other causes of death; third, widespread urbanisation (responsible for the change in lifestyles),60 exposure to smoking61 and alcohol consumption60 are contributing to developing higher cancer risk60 62 and fourth, overdiagnosis is considered another potential driving force for increasing cancer incidence and related mortality. It is evident from past studies that overdiagnosis has played a significant role in increasing the burden of cancer63 but that the rising magnitude of cancer burden among Australians may not be entirely explained by overdiagnosis.64 Therefore, further research that explores the potential risk factors may contribute to a deeper understanding of the reasons behind the increasing burden of cancer in Australia.
This study found that survival inequality was most pronounced for prostate cancers and consistent with previous studies.65 66 Evidence about underlying causes to explain inequalities in prostate cancer. Some possible explanations can be considered such as factors associated with the tumour (eg, stage at diagnosis, biological characteristics), the patient (comorbidity, health behaviour, psychosocial factors) and the healthcare (treatment, medical expertise, screening).65–67 Furthermore, the utilisation rate of screening services is lower among prostate cancer patients with disadvantaged socioeconomic status.68 69 Moreover, patient factors as comorbidity or health behaviour can interact with treatment modalities or disease stage and additionally have a potential impact on inequalities in survival.70 71 Further, an increased likelihood of surveillance as treatment among patients with severe comorbidity while radical prostatectomy was significantly less likely to be offered.65 66 69 70 Some studies conducted in England,72 Australia73 and the USA74 also revealed that socioeconomically disadvantaged patients have a reduced likelihood of having radical prostatectomy compared with patients with disadvantaged socioeconomic status who utilised more regularly hormone therapy, active surveillance, watchful waiting and partly radiation. There is an ongoing debate regarding the significant role of healthcare management as a contributing factor to inequalities in survival among prostate cancer patients.67
The results show that the overall incidence, cancer-related mortality and cancer burden (eg, YLL, YLD and DALYs) were significantly higher among the least advantaged group compared with the most advantaged. It was also found that the least advantaged quintile on average experienced 34% more cancer-related mortality than their most advantaged counterparts. Similarly, patients in the least advantaged group experienced a significantly higher burden of cancer in terms of YLL (6.50% to 7.57%) compared with the richest (1.11%) from 2011 to 2015. Previous studies have also reported similar inequalities in YLL,75 76 whereas, a high proportion of patients in the most-deprived groups experienced very high years loss of life. Even though survival rates after cancer diagnosis have improved in recent years,7 disparities in cancer outcomes between the least-deprived and the most-deprived groups continue to persist. The magnitude of the cancer burden is negatively associated with socioeconomic status.77–80 For example, adverse health outcomes (eg, worse health status and shorter life expectancy) are disproportionately found in poorer people compared with those in higher quintiles.77–80 Some reasons that have contributed to the high rate of cancer burden among the poorest groups includes smoking exposure,51 77 poverty and economic burden,61 81 increased psychological pressure,3 lack of health education and awareness82 and lower access to competent and effective public health interventions.82 There are several factors which lead to increased breast cancer incidence and cancer-related mortality. These can be classified into patients, tumour and treatment characteristics.83–85 These characteristics include patient age, ethnicity, tumour type, size, grade, stage, hormone receptor status, type of surgery and the use of adjuvant therapies.83–85 A recent review study demonstrated that treatment‐related factors and socioeconomic disadvantage are also responsible for high cancer burden in Australia.84
Moreover, low productivity, loss/reduction of household income and increased expenditure due to illness result in reduced earnings and higher expenditure that further disadvantage the poorest. Growing socioeconomic inequalities of cancer outcomes need the attention of governments, health systems and decision-makers. These initiatives should aim for universal cancer care in all states. A sustained reduction of socioeconomic inequalities, which concerns poverty, gender, education and health, should promote universal equality in health and well-being and further enhance both socioeconomic and human development.
The present study has also identified that the fatal burden of cancer was high in 2011 among patients in very remote areas, but it was reduced by 2015. Similarly, the burden of cancer was high in New South Wales, Victoria and Queensland; however, the magnitude of fatal burden was unchanged during 2011 to 2015. Some previous studies have shown consistent findings, which have confirmed that the proportion of life lost for patients in geographical disadvantaged or low-resource settings had a higher cancer burden than their more advantaged counterparts.75 76 Socioeconomic inequalities in terms of poorer survival for geographically isolated patients was observed in cancer types in Australia including breast and colorectal cancer.86 Several issues might be associated with a high burden of cancer among patients in regional and remote Australia, including a lack of appropriate skills among health professionals and a lack of adequate resources being available in remote and smaller cities.15 33 87 A recent study conducted in regional Australia identified that there was a paucity of medical professionals with expertise and appropriate cancer training in regional areas.68 The study also confirmed that a lack of communication and coordination persisted between different medical professionals (such as oncologists and GPs) and across geographical locations (major vs regional centres).
Difficulty in service accessibility and availability of appropriate cancer care services is faced by residents of rural, remote communities in Australia.87 However, only 30% of the population lives outside the major cities.88 The federal government has committed to improving the cancer infrastructure by building a network of new and enhanced regional cancer centres in regional Australia.89 Furthermore, innovative cancer care models, including mobile clinics incorporating video conference and tele-oncology, have been introduced in order to address the challenges of distance. Advanced technology-based services such as tele-oncology have been implemented in Western Australia and North Queensland, allowing regional cancer patients to use the latest treatments including specialist consultations and chemotherapy treatments.90 91 These models have also been implemented in the USA and Canada to ensure maximum access to services among people in limited resources settings, with high levels of satisfaction and acceptance of services.90–94
This study contributes to the existing literature by providing first-hand evidence on the trends of incidence, mortality and burden of cancer, using Australian nationally representative population-based data. This study has used large national level data sets covering all states over the past 33 years. Due to paucity of survival data, this study has not captured in details inequalities regarding the cancer survivorship. However, there is a limited understanding of what is driving these changes of cancer outcomes reported here which may reflect random variation or changes in unknown risk factors, and therefore highlight the need for more research into the aetiology of cancer.
Conclusions
The overall burden of cancer is substantial in Australia across all socioeconomic strata and geographical regions. Compared with socioeconomically advantaged people, disadvantaged people had a substantially higher risk of cancer incidence and cancer-related mortality. Those living in remote areas also bear a higher burden than those in urban areas who are closer to prevention and treatment services. The findings of this study can inform efforts by healthcare policymakers and those involved in healthcare systems to improve cancer survival in Australia. This work also suggests that the provision of universal cancer care can reduce the burden by ensuring curable and preventive cancer care services are accessible for all people regardless of socioeconomic status or location.
Acknowledgments
The study is part of the first author’s PhD research. The PhD program was funded by the University of Southern Queensland, Australia. We would also like to thank the Australian Institute of Health and Welfare, Central Cancer Registry, Australian Bureau of Statistics and Australian Burden of Disease Study. We would like to gratefully acknowledge the reviewers and editors of our manuscript.
References
Footnotes
Contributors Conceptualised the study: RAM. Contributed data extraction and analyses: RAM, under the guidance of KA and JG. Result interpretation: RAM, under the guidance of KA and JG. Prepared the first draft: RAM. Contributed during the conceptualisation and interpretation of results and substantial revision: RAM, KA, JG and JD. Revised and finalised the final draft manuscript: RAM, KA, JD and JG. All authors read and approved the final version of the manuscript.
Funding The authors have not declared a specific grant for this research from any funding agency in the public, commercial or not-for-profit sectors.
Competing interests None declared.
Patient consent for publication Not required.
Provenance and peer review Not commissioned; externally peer reviewed.
Data availability statement Data were extracted from the publicly accessible Australian Institute of Health and Welfare (AIHW) online sources (https://www.aihw.gov.au/reports-data/health-conditions-disability-deaths/cancer/data).