Article Text

Abstract
Objectives This is the first attempt to provide estimates on the prevalence of hypertension at the national, state and district level, a prerequisite for designing effective interventions. Besides, the study aims to identify the risk factors of hypertension.
Design We analysed cross-sectional survey data from the fourth round (2015–2016) of National Family Health Survey (NFHS). NFHS was conducted between January 2015 and December 2016, gathering information on a range of indicators including blood pressure. The age adjusted prevalence of hypertension was calculated for state comparison, while multilevel logistic regression analysis was done to assess the correlates of hypertension.
Setting and participants India (2015–2016; n=811 917) aged 15–49.
Primary and secondary outcome measures The primary outcome is hypertension, which has been defined as systolic blood pressure ≥140 mm Hg and/or diastolic blood pressure ≥90 mm Hg.
Results The age-adjusted prevalence of hypertension in India was 11.3% (95% CI 11.16% to 11.43%) among persons aged between 15 and 49 and was four percentage points higher among males 13.8% (95% CI 13.46% to 14.19%) than among females 10.9% (95% CI 10.79% to 11.06%). Persons in the urban location (12.5%, 95% CI 12.25% to 12.80%) had a marginally higher prevalence than persons in rural location (10.6%, 95% CI 10.50% to 10.78%). The proportion of population suffering from hypertension varied greatly between states, with a prevalence of 8.2% (95% CI 7.58% to 8.85%) in Kerala to 20.3% (95% CI 18.81% to 21.77%) in Sikkim. Advancing age, obesity/overweight, male sex, socioeconomic status and consumption of alcohol were found to be the major predictors of hypertension.
Conclusions Hypertension prevalence is now becoming more concentrated among the poor. Policy measures should be taken to improve the hazardous working conditions and growing social pressures of survival responsible for ‘life-style’ changes such as consumption of high calorie food and alcohol.
- hypertension
- prevalence
- factors
- India
- district
- state
This is an open access article distributed in accordance with the Creative Commons Attribution Non Commercial (CC BY-NC 4.0) license, which permits others to distribute, remix, adapt, build upon this work non-commercially, and license their derivative works on different terms, provided the original work is properly cited, appropriate credit is given, any changes made indicated, and the use is non-commercial. See: http://creativecommons.org/licenses/by-nc/4.0/.
Statistics from Altmetric.com
Strengths and limitations of this study
First epidemiological study to provide estimates on prevalence of hypertension at national, state and district level.
Multivariate analysis identified the key drivers of hypertension.
The use of cross-sectional data that does not allow for exploration of causal pathways underlying the reported associations.
The role of behavioural risk factors such as low fruit and vegetable intake and physical inactivity could not be explored in this analysis.
Findings are limited to the persons aged between 15 and 49.
Introduction
Hypertension is the single largest contributor to the avoidable deaths and diseases in India. It is a leading risk factor for cardiovascular disease, which accounted for 23% of total deaths and 32% of adult deaths in 2010–2013.1 India has committed to take an array of actions to meet the Sustainable Development Goals (SDG) target of reducing premature mortality from non-communicable diseases (NCDs) by one-third by 2030. However, much of the success in meeting this target hinges on its ability to check the rise of hypertension. The Global Burden of Hypertension study has highlighted that of the global burden of 212 million Disability-Adjusted Life Years (DALYs) related to hypertension, 18% occurred in India in 2015.2 The burden of hypertension in India is expected to rise considerably in the coming years due to rapid environmental and ‘life-style’ changes that emanate from hazardous working conditions and growing social pressures of survival.3 4
Monitoring and evaluation for SDG
It is, therefore, imperative that blood pressure trends are monitored to evaluate the progress that the country makes vis-à-vis the SDG goal of reduction in NCD mortality. To do that, data on hypertension are needed so that stakeholders can design appropriate interventions and evaluate national programmes aimed at effectively addressing hypertension and associated NCDs. But there was a paucity of reliable information on the status of hypertension in India. As a result, to assess the magnitude of this problem, policy makers had to rely on community studies or surveys that provided self-reported data on hypertension.5–8 Further, data from small studies were extrapolated to obtain national level estimate on hypertension.9 Although these studies were helpful and used as a key resource in the arsenal of health policy makers, in the absence of active surveillance or data from population based surveys, policy makers are unable to determine the true burden of hypertension in India.
The recent health surveys have measured blood pressure, providing an opportunity to explore the trends in prevalence of hypertension both at the national, sub-national (state) and district level. Given the heterogeneity in the demographic and socioeconomic conditions across states in India, it is very likely that there would be considerable inter-state variations in hypertension prevalence.9 Moreover, the socioeconomic disparities are widespread even within the state. Hence, estimates at the state and district levels are required for policy formulation, setting intervention priorities and to evaluate national programmes. This study is the first in India to provide estimates on the prevalence of hypertension at the national level and for each state, district, and by rural and urban areas and individual characteristics such as age, sex and economic status using the most recent large-scale survey data. Aside from providing estimates on hypertension prevalence, an attempt was also made to identify the correlates of hypertension.
Methods
Data
This study is based on the data from the fourth wave of National Family Health Survey (NFHS), which is the Indian version of Demographic and Health Survey carried out periodically in over 90 countries across the globe. NFHS 4 was conducted under the stewardship of the Ministry of Health and Family Welfare (MOH&FW) and led by International Institute for Population Sciences. The survey was a collaborative effort of 14 research organisations, including three Population Research Centres (under MOH&FW). ICF International provided technical assistance at all stages of NFHS project. NFHS 4 began on 20 January 2015 and ended on 4 December 2016. The survey was conducted across all 29 states and 7 union territories (UTs) in India. The survey is representative not only at the national and state level but also at the district level.
NFHS adopted a 2-stage stratified random sampling approach by selecting primary sampling units (PSUs) (villages in rural areas and census enumeration blocks in urban areas) with probability proportional to population size at the first stage and subsequently, picking the same number of households from each of selected PSUs through systematic random sampling. Both male and female interviewers were recruited by field agencies to interview respondents of the same sex. The data collection team made up to three visits in case no body was present in the chosen household or any eligible member was not available at the time of the household visit.
The household-level questionnaire of NFHS covered the details on possession of 33 assets and access to certain utilities. The information on assets and utilisation of utilities were used for constructing wealth index, which reflects the standard of living of households. The wealth index categorises households into five wealth quintiles: ‘poorest’, ‘poor’, ‘middle’, ‘rich’ and richest. In NFHS, the Biomarker Questionnaire collected details on height, weight and haemoglobin for children, and measurements of height, weight, haemoglobin, blood pressure and random blood glucose for women aged 15–49 and men aged 15–54. The different age ranges for men and women were chosen, considering the average spousal age gap of 5 years in India. The survey used same questionnaires, field procedures and procedures for biomarker measurements across the country to ensure comparability across states and to ensure the highest possible data quality. The response rate for BP measurements was 97% among women and 92% among men. Apart from taking BP measurements, all participants irrespective of their BP were asked, ‘Were you told on two or more different occasions by a doctor or other health professional that you had hypertension or high blood pressure?’ If they responded in the affirmative, they faced a follow-on question, ‘To lower your blood pressure, are you taking a prescribed medicine?’
The analysis was restricted to women and men aged 15–49, after excluding men aged 49–54 (n=8618) to ensure an equal age range among women and men. Missing values (n=32 268) were also excluded from the analysis. Data were weighted prior to analysis.
Ethics approval
The study is based on an anonymous publicly available data set with no identifiable information on the survey participants; therefore, no ethics statement is required for this work.
Statistical analysis
Hypertension was considered as the outcome variable of this study. Three blood pressure readings were taken in NFHS. The first measurement was discarded and then, based on the average of second and third readings of blood pressure, it was decided whether a participant was hypertensive or not. Hypertension was defined as systolic blood pressure of at least 140 mm Hg or diastolic blood pressure of at least 90 mm Hg. The definition was based on the criteria given by WHO and American Heart Association.10 In addition, an individual is classified as having hypertension if she/he is currently taking antihypertensive medication to lower his or her blood pressure. To make the prevalence of hypertension comparable, age adjusted prevalence rates were calculated for all states, UTs and districts using the direct standardisation method. The national population, as per 2011 Census, was used as a reference population for carrying out the standardisation technique. To understand how hypertension prevalence varies by socioeconomic status (SES), the wealth index was converted into a dichotomous variable; where the bottom 60% that is, ‘poorest’, ‘poor’ and ‘middle’ were combined into one group (low SES), the remaining two categories were clubbed into the other category (high SES). Besides conducting bivariate analyses, multilevel (first level: individual; second level: district; third level: state) logistic regression model with random intercepts and fixed slopes was employed to calculate multilevel ORs with corresponding 95% CI.
Dependent variable
Hypertension for persons aged between 15 and 49. The dichotomous variable, hypertension, was defined as 1=hypertensive, else=0.
Explanatory variables
Predictors were selected based on their effects on hypertension.
Sociodemographic variables
Age, sex, marital status, caste (Indian society is mainly divided into four castes within the framework of the Hindu caste system. The castes used to be classified according to occupation. Historically, many sub-castes have faced discrimination, deprivation and social exclusion on account of their assigned ‘low-status’. Recognising the marginalisation of certain communities and socioeconomic differences among different population groups, the constitution of India categorised the Indian population into four major groups: scheduled tribe (ST), scheduled caste (SC), other backward class (OBC) and General. ST is the most socio-economically disadvantaged group, followed by the SC and OBC and together they comprise 69% of India’s population, with SC at 19.7%, ST at 8.5% and OBC at 41.1%), education, place of residence, wealth status. Besides sociodemographic variables, we included body mass index, tobacco use and alcohol consumption as proxy for behavioural risk factors. The education categories are defined based on number of years of education completed by an individual: 0 year as ‘no education’; 1–5 years as ‘primary education’; 6–12 years as ‘secondary education’; and more than 12 years of educational attainment categorised as ‘higher studies’.
All statistical analyses were performed using STATA V.14.
Patient and public involvement
No patients or public were involved in the conception, design and planning of this study.
Results
Sample characteristics
As seen in table 1, of the total 779 649 persons who participated in the survey, a little more than half of them (51.3%) were aged between 15 and 29 years. It is worth noting that as per India’s census, the median age was 24 years in 2011. Nearly 13% of men and 27% of women never went to school. Further, 13% of both sexes attended school only up to primary level. Almost 64% of men and 73% of women were currently married. A third of the study population were urban residents and a quarter of them were either overweight or obese. Around 48% of men were users of some form of tobacco as compared with 10% of women. The gap between men’s and women’s tobacco use is not unusual. It is in consonance with results of other nationally representative household surveys. For instance, as per Global Adult Tobacco Survey (2016–2017), 19% of men and 2% of women smoke tobacco in India.11 It may be pointed out that traditionally tobacco usage is significantly higher in males than in females in the Indian sub-continent. This could be attributed to cultural disapproval, prohibiting women from smoking in India. Under-reporting of tobacco use by women is also partly responsible.
Characteristics of sample population by gender, National Family Health Survey, India, 2015–2016
Like tobacco use, a significantly greater proportion of men (nearly 31%) reported consuming alcohol either almost every day, about once a week or less than once a week as compared with 2.5% among women.
Prevalence of hypertension at national, state and district level
Table 2 shows crude and age-adjusted prevalence of hypertension among persons aged 15–49 for the year 2015–2016. The data reveal that the age-adjusted prevalence of hypertension in India was 11.3% and the prevalence was four percentage points higher in men (13.8%) than in women (10.9%). Hypertension prevalence was 12.5% in urban, compared with 10.6% in rural location.
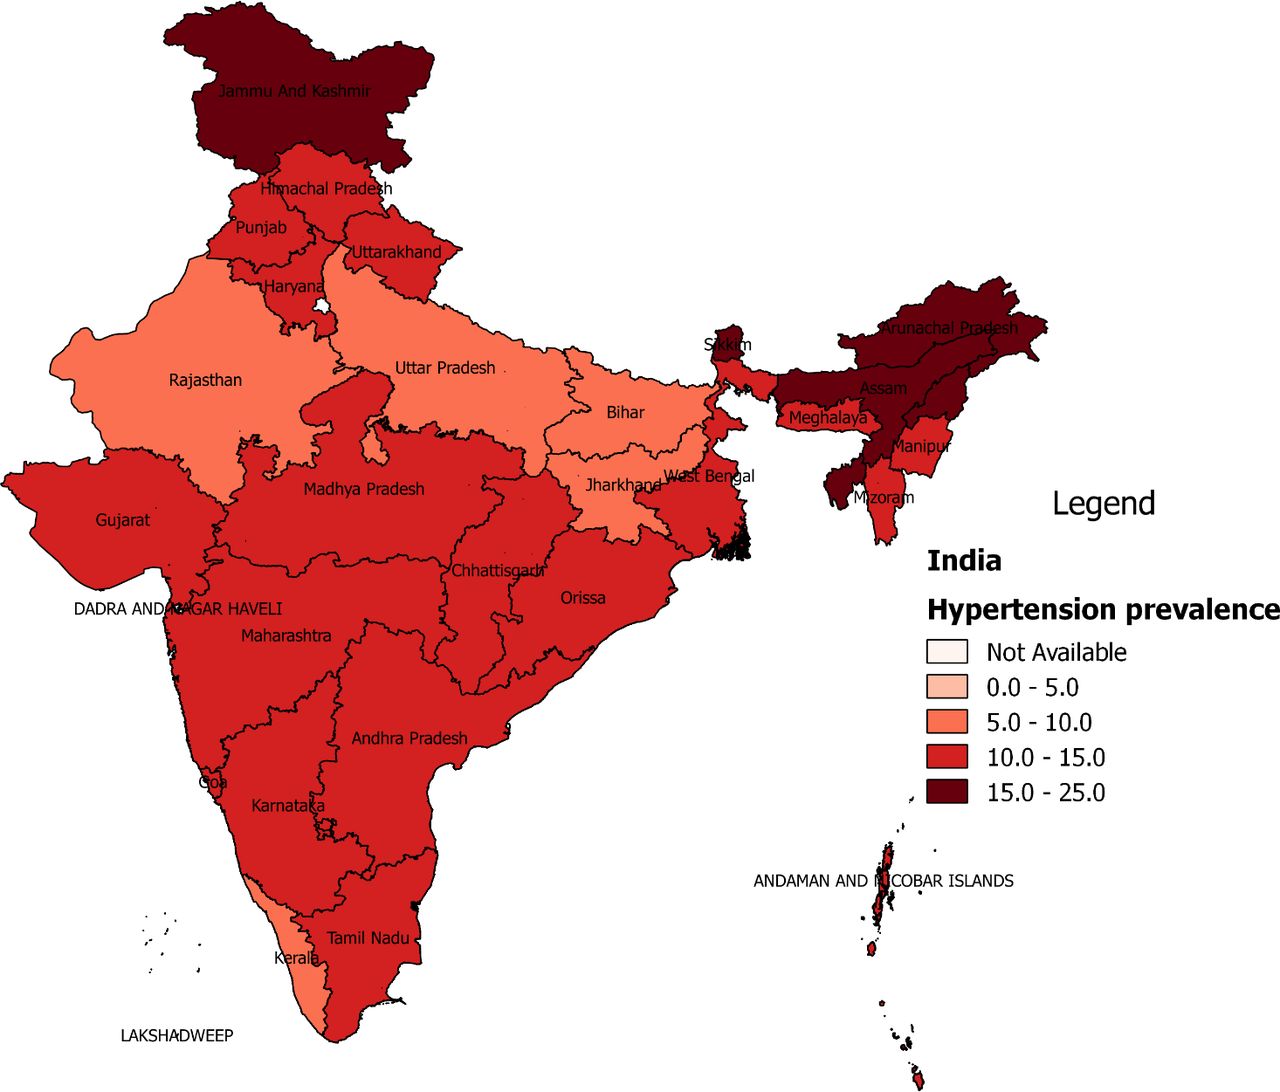
Prevalence of hypertension in India, 2015–2016
The results indicate that the age-adjusted prevalence of hypertension varied greatly between states and UTs, with a prevalence of 8.2% in Kerala to a prevalence of 20.2% in Sikkim (See figure 1 and online supplementary figure S1). Quite intriguingly, the prevalence of hypertension was highest in the north-eastern (NE) states, namely Sikkim (20.2%), Nagaland (17.6%), Assam (17.6%), Arunachal Pradesh (16.6%) and Tripura (15.4%). Further, hypertension prevalence was very high in few non-NE states, namely Jammu and Kashmir (15.8%), Punjab (14.8%), Himachal Pradesh (14.8%) and Telangana (14.2%). On the other hand, proportion of population suffering from hypertension was relatively low in states such as Kerala (8.2%), Bihar (8.8%), Delhi (8.6%), Rajasthan (9.1%), Uttar Pradesh (9.6%) and Jharkhand (9.6%).
Supplemental material

Prevalence of hypertension across states, India, 2015–2016.
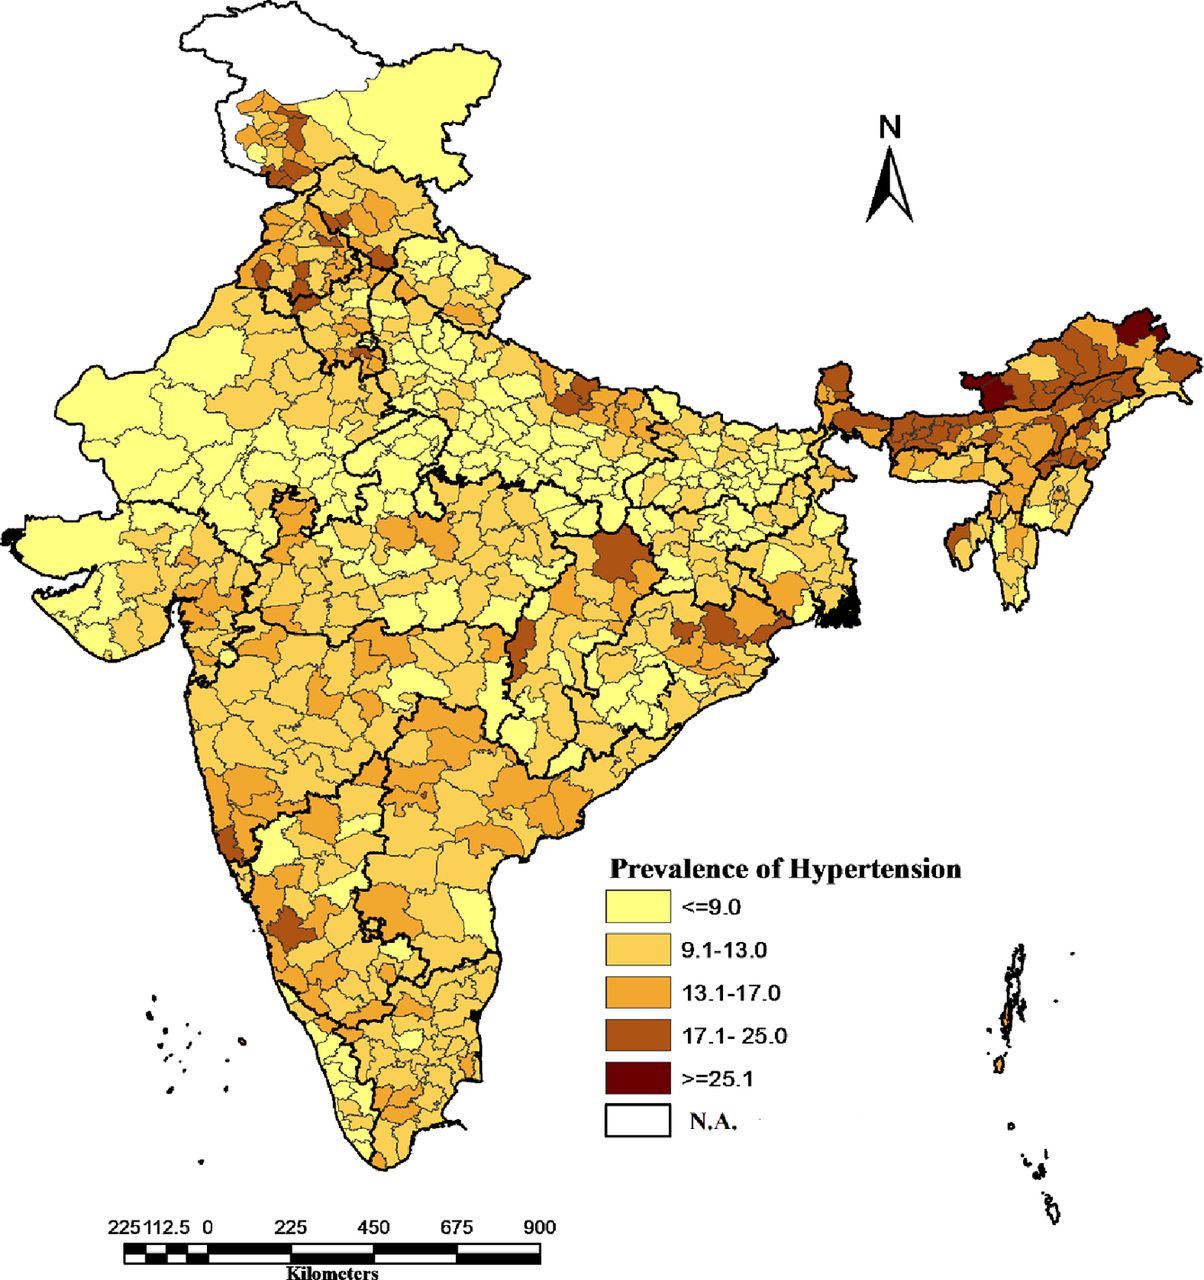
Figure 2 displays the inter-district variations in hypertension prevalence. The proportion of hypertensive population varied tremendously, ranging between 3.5% in district Mahoba, Uttar Pradesh and 34.7% in district Dibang Valley, Arunachal Pradesh. The majority of the districts across the country recorded a high hypertension burden, with more than one-tenth of the persons aged 15–49 hypertensive in 427 districts. Only 10 districts had hypertension levels below 5% and all of them except one were in the relatively less advanced states. Several districts with alarmingly high prevalence of hypertension were clustered across NE states. Five districts in Arunachal Pradesh, two districts in Punjab, one each in Sikkim, Assam and Andaman and Nicobar Islands were among the top ten districts with the highest levels of hypertension. The results revealed that at least one in every five persons aged between 15 and 49 were having hypertension in as many as 28 districts across India.

Prevalence of hypertension across districts, India, 2015–2016.
The findings highlighted that the prevalence of hypertension was higher in men than in women in most states and UTs, except in Delhi, West Bengal, Meghalaya and Jammu and Kashmir (online supplementary figure S2). The sex difference in prevalence of hypertension was highest in Andaman and Nicobar Islands (12.4%), followed by Sikkim (8.4%), Himachal Pradesh (7.3%) and Manipur (7.2%). The results also suggest that, in general, the gender differentials were relatively smaller in low prevalence states than in high prevalence states. Figure 3 shows the prevalence of hypertension in rural and urban settings of all states. As shown in the earlier figure, the prevalence rate of hypertension was found to be higher in urban than in rural areas for most of the states. However, there were a few exceptions. The prevalence of hypertension was relatively higher among the rural folks than their urban counterparts in Punjab, Goa and Kerala. Another interesting pattern emerges while comparing the prevalence of hypertension between high and low SES categories within rural and urban areas of each of these states (online supplementary figure S3). The results suggest hypertension is no longer a disease of the rich. In fact, the distribution of the condition is changing, disproportionately affecting the economically disadvantaged in urban areas of the more developed states such as Punjab, Haryana, Jammu and Kashmir and most of the NE states. Furthermore, the phenomenon of higher prevalence of hypertension among the poor appears to be not limited to only urban setting. In rural areas of Chhattisgarh, Kerala and Mizoram, the burden of hypertension was relatively higher among people from lower socioeconomic groups than those from higher socioeconomic groups. Furthermore, the differences in prevalence of hypertension by low versus high SES categories were generally insignificant in urban areas of most states (<2 percentage points).
Supplemental material
Supplemental material

Prevalence of hypertension by sector across selected states, 2015–2016.
The weak association between GDP per capita of states and hypertension prevalence (online supplementary figure S4) is also the confirmation of the growing convergence of rich–poor difference in the prevalence of hypertension, particularly in the urban areas.
Supplemental material
Sociodemographic differentials in prevalence
The bi-variate and multivariate analyses were carried out to understand the relative importance of socioeconomic and behavioural risk factors of hypertension. Since the bi-variate and multivariate analyses yielded very similar results, we are only presenting the findings of multivariate analysis here. Table 3 shows results for multilevel logistic regression of hypertension by its different covariates. Expectedly, age was found to be an important predictor of hypertension. The likelihood of being hypertensive increased significantly with age. ORs suggest that the risk of hypertension was 6.7 times higher in older age group (45–49 years) than in younger age group (15–19 years). The differences in prevalence probabilities between married, widowed and single were statistically significant. Those who were widowed, separated and divorced were more likely to have hypertension than their single counterparts (OR=1.19; p<0.001). Interestingly, married persons were also found to be at greater risk of hypertension than those who were never married or single (OR=1.08; p<0.001). Educational attainment seems to be inversely related with prevalence, though the effect of education was not significant among those who studied only up to primary level. But persons with secondary (OR=0.92; p<0.001) or higher education (OR=0.81; p<0.001) were less likely to be hypertensive as compared with those with no formal education.
Results of multilevel logistic regression on hypertension, India, 2015–2016
We tried to understand whether economic status affects hypertension risk in people. The ORs suggest a positive association between economic status and hypertension.
Compared with those in poorest quintile, people from richest quintile were having considerably higher likelihood of hypertension (0.21 percentage points). Place of residence was also found to be statistically significantly associated with hypertension. Those from rural areas (OR=0.96; p<0.01) were at a lower risk for hypertension. Caste differences in prevalence of hypertension were not much, except that persons belonging to OBC were less likely to have the condition (OR=0.96; p<0.001) as compared with those from others.
Overweight or obese persons were significantly more likely to suffer from hypertension (OR=2.02, p<0.001 and OR=3.22, p<0.001, respectively). Alcohol consumption was found to be positively related with hypertension; however, no statistically significant association was found between tobacco use and hypertension. Those who drank alcohol almost every day (OR=1.45; p<0.000), about once a week (OR=1.25; p<0.001) and less than once a week (OR=1.17; p<0.001) had a higher risk of hypertension than people without alcohol use habit.
We have explored the regional and sub-regional disparities in the prevalence of hypertension in India. Median odds ratio (MOR) indicates geographical heterogeneity in the prevalence of hypertension across India. Overall, the variation in the prevalence of hypertension was of greater magnitude at the district level (MOR=1.32; p<0.001) than at the state level (MOR=1.28; p<0.001). While the MOR was 1.28 and 1.32, ORs for most individual level characteristics were relatively higher, suggesting that unexplained between-district and between-state variations are not as relevant as individual level characteristics for understanding the prevalence of hypertension.
Discussion
This article provides estimates on the prevalence of hypertension across different geographical areas in India and examines socioeconomic and life-style factors associated with this condition, by exploiting the latest data from the fourth round (2015–2016) of NFHS. Although some previous research has attempted to understand the burden of hypertension in India,9 12 13 to the best of our knowledge, this study is the first comprehensive assessment of hypertension prevalence using high-quality survey data of each state and district of India.
One of our key findings is that more than 11% of the population aged 15–49 in India are hypertensive. However, our estimate on the age-adjusted hypertension prevalence differs considerably from the reported crude prevalence (25%) in Geldsetzer et al’s (2018) study on hypertension. This discrepancy is arising mainly because our estimates of prevalence pertain to those aged 15–49 while the said study provided estimates for adults aged 18 or older. Besides the differences in age composition between two samples, several states and UTs were not covered in annual health survey (AHS) and district-level household survey (DLHS), which were used for assessing hypertension prevalence in Geldsetzer et al’s study. Furthermore, while the clinical and anthropometric data for AHS were collected in 2014 (Although AHS was conducted during 2013–2014, the biomarker component, ie, Clinical, anthropometric and biological (CAB) data were collected only from a sub-sample of AHS in the year 2014. For details, see http://www.censusindia.gov.in/2011census/hh-series/HH-2/CAB-Introduction.pdf. In contrast, in DLHS, CAB tests were carried out in all selected households), DLHS was carried out between 2012 and 2013. As a result, the pooled data may not provide true estimates of hypertension at the national level owing to inconsistencies between two surveys in terms of survey design, period of data collection (time gap) and non-inclusion of many states and UTs.
Hypertension was found to be more prevalent in men than in women. Although the prevalence of hypertension was relatively higher in urban than in rural areas at the national level, the rural–urban differences were small, implying that hypertension epidemic is spreading very fast even in the rural population. This has serious implications for the rural people. The public health system through primary health centres in rural areas is still focusing on infectious diseases, reproductive and child health and thus, has become too limited. So, people would have to rely on the private sector for the management of hypertension and its associated diseases, which would substantially add to their financial strain.
Considerable inter-state and inter-district differences were found in the prevalence of hypertension. It was more common in NE states, Jammu and Kashmir, Himachal Pradesh, Punjab, and Telengana than in Kerala and less advanced states. The inter-state differentials might have been caused by the differences in risk exposure such as rising affluence, urbanisation, sedentary life style, changing dietary habits, obesity prevalence, social stress and possibly, genetic factors. The finding of relatively lower hypertension prevalence in poorer states is consistent with evidence from the latest burden of disease study that classified these states as having low epidemiological transition level.14 But surprisingly, Kerala, where epidemiologic transition is most advanced among all states, had recorded the lowest prevalence of hypertension. This may be due to the non-inclusion of older persons in NFHS. It should be noted that Kerala has the highest proportion of elderly population (13%) in India. However, more research is needed to pinpoint the reasons for low prevalence in Kerala. Interestingly, in NE states, despite their low per capita income, the prevalence was way higher than in states with much higher level of socioeconomic development. The higher burden of hypertension among the population of NE could be attributed to ethnicity and food habits.15 It may be noted that NE Indians belong to Mongoloid, whereas North Indians and South Indians are part of Indo-Aryan and Dravidian ethnic groups. Hypertension has emerged as a major epidemic in many districts. Examples include two districts of Arunachal Pradesh (part of NE India), where every third person was hypertensive and more than a fifth of the population had the condition in as many as 28 districts.
In majority of the states, hypertension prevalence was higher in urban than in rural areas, though the difference was not large and at times, insignificant. Further, in Goa, Punjab, Kerala and Nagaland, the prevalence of hypertension was observed to be higher in rural than in urban communities. Such narrowing differentials may be the result of the factors mentioned in a recent study conducted in Punjab. Tripathy and others (2016) reported that there was no rural–urban differential in terms of dietary practices and prevalence of overweight and obesity barring the fact that a markedly higher proportion of individuals from rural areas always/often add salt before/when eating as compared with those from urban areas.16
Another major finding was the weak link between economic growth (GDP per capita) and hypertension. Our study reveals that hypertension is affecting the people in more advanced and less advanced states alike. Furthermore, hypertension is not only affecting the affluent but is also widespread among the poor within states. Another salient finding is the increased proportion of poor suffering from hypertension in many states, particularly in the urban areas. This actually confirms the trend seen in studies on NCD.17 More importantly, these findings paint a disturbing pattern, indicating that it is just a matter of time when the less affluent segment of the population in other states would also face a disproportionately higher burden of hypertension. The situation might have arisen due to factors such as the diffusion and adoption of ‘modern’ lifestyles (the changing dietary behaviour: smoking, drinking, unhealthy diets) across population groups (which is a result of urbanisation, aggressive push of junk food through advertising and marketing and related shifts in sociocultural practice), physical inactivity and high levels of depression and stress (linked to poverty and lack of equal opportunities).18 19 Our study corroborates the earlier observations as the evidence point to urban residence, obesity, and alcohol use as some of the key drivers of the hypertension epidemic in India. These were also supported by previous research on hypertension in India.13 16 20 Surprisingly, use of tobacco was not found to increase the risk of hypertension. While it is difficult to explain why use of tobacco did not display statistically significant association with hypertension, one plausible reason could be the young population of our sample. According to a recent study which examined the life-course impact of smoking on hypertension, no statistically significant relationship was found between smoking and the risk of hypertension in the age group younger than 35, though smoking was found to be significantly associated with hypertension in the later ages.6
Our study has several notable strengths. This is the first study that used the recently released NFHS data, which is based on a sample of households that is representative at the national, state and district levels, thereby, allowing us to provide estimates of the prevalence of hypertension across various geographical levels. Further, multivariate analysis identified the key drivers of hypertension in India.
Aside from the above mentioned strengths, the study has a few limitations, which merit discussion. The findings of this study are limited to the persons aged between 15 and 49 in India. Further, NFHS provides cross-sectional data. This prevents exploration of causal pathways underlying the reported associations. We could not investigate the role of behavioural risk factors such as low fruit and vegetable intake and physical inactivity in this analysis due to the non-availability of such information in the data set.
Conclusion
To conclude, hypertension epidemic is spreading alarmingly in India across rural and urban populations. Disturbingly, the hypertension prevalence is now becoming more concentrated among the poor in both urban and rural areas. This phenomenon of rising hypertension prevalence among the least resourceful people has serious social and economic implications for the country and warrants immediate policy interventions to prevent the catastrophe.21 22 The district wise estimates on this condition should be used to plan for localised interventions so that the prevalence could be brought down significantly, which would help achieve the national target of 25% relative reduction in the prevalence of hypertension by 2025.23 We recommend universal blood pressure screening for high prevalence districts to track the progress of interventions. However, when it comes to interventions, the emphasis should be on primary prevention of hypertension. Policy measures should be taken to improve hazardous working conditions of the poor and growing social pressures of survival responsible for ‘life-style’ changes such as consumption of high calorie food and alcohol. On the other hand, a diet rich in fruits and vegetables, regular physical activity and weight control should be promoted.
References
Footnotes
Contributors While SG conceptualised the paper, partly analysed the data and wrote the manuscript, MK carried out the analysis of the data. SG edited the paper. The authors discussed the results and approved the revision of the final manuscript.
Funding The authors have not declared a specific grant for this research from any funding agency in the public, commercial or not-for-profit sectors.
Map disclaimer The depiction of boundaries on this map does not imply the expression of any opinion whatsoever on the part of BMJ (or any member of its group) concerning the legal status of any country, territory, jurisdiction or area or of its authorities. This map is provided without any warranty of any kind, either express or implied.
Competing interests None declared.
Patient consent for publication Not required.
Provenance and peer review Not commissioned; externally peer reviewed.
Data availability statement Data are available in a public, open access repository.