Article Text

Abstract
Objectives We assessed: (1) waiting time variation among surgeons; (2) proportion of patients receiving surgery within benchmark and (3) influence of the Winnipeg Central Intake Service (WCIS) across five dimensions of quality: accessibility, acceptability, appropriateness, effectiveness, safety.
Design Preimplementation/postimplementation cross-sectional design comparing historical (n=2282) and prospective (n=2397) cohorts.
Setting Regional, provincial health authority.
Participants Patients awaiting total joint replacement of the hip or knee.
Interventions The WCIS is a single-entry model (SEM) to improve access to total hip replacement (THR) or total knee replacement (TKR) surgery, implemented to minimise variation in total waiting time (TW) across orthopaedic surgeons and increase the proportion of surgeries within 26 weeks (benchmark). Impact of SEMs on quality of care is poorly understood.
Primary and secondary outcome measures Primary outcomes related to ‘accessibility’: waiting time variation across surgeons, waiting times (Waiting Time 2 (WT2)=decision to treat until surgery and TW=total waiting time) and surgeries within benchmark. Analysis included descriptive statistics, group comparisons and clustered regression.
Results Variability in TW among surgeons was reduced by 3.7 (hip) and 4.3 (knee) weeks. Mean waiting was reduced for TKR (WT2/TW); TKR within benchmark increased by 5.9%. Accessibility and safety were the only quality dimensions that changed (post-WCIS THR and TKR). Shorter WT2 was associated with post-WCIS (knee), worse Oxford score (hip and knee) and having medical comorbidities (hip). Meeting benchmark was associated with post-WCIS (knee), lower Body Mass Index (BMI) (hip) and worse Oxford score (hip and knee).
Conclusions The WCIS reduced variability across surgeon waiting times, with modest reductions in overall waits for surgery. There was improvement in some, but not all, dimensions of quality.
- health policy
- health services administration and management
- organisation of health services
- quality in healthcare
- adult surgery
This is an open access article distributed in accordance with the Creative Commons Attribution Non Commercial (CC BY-NC 4.0) license, which permits others to distribute, remix, adapt, build upon this work non-commercially, and license their derivative works on different terms, provided the original work is properly cited, appropriate credit is given, any changes made indicated, and the use is non-commercial. See: http://creativecommons.org/licenses/by-nc/4.0/.
Statistics from Altmetric.com
- health policy
- health services administration and management
- organisation of health services
- quality in healthcare
- adult surgery
Strengths and limitations of this study
We evaluated across five dimensions of quality of care (beyond accessibility alone), adapted from the Institute of Medicine’s National Healthcare Quality Framework.
We used a preintervention/postintervention study design, large sample sizes, robust comparison groups and defined outcome variables to report both system-level performance and patient-centred outcomes.
As a natural experiment, with a quasi-experimental design, one of the limitations of our study is missingness of data—data available between cohorts differed given the lack of some formalised data collection processes prior to implementation.
Our findings may not show the full picture given the complexity of the intervention (featuring multiple elements and processes) and the 1 year observation period during which awareness, understanding and uptake were evolving.
Introduction
Waiting times for hip and knee replacement in Canada remain long and stagnant.1 2 The Canadian Institute for Health Information (CIHI) reports that demand and waiting times for the five nationally-prioritised scheduled (elective) clinical services—including joint replacement—have increased in Canada since 2011, with many waits being longer than clinically recommended.1–4 In a 2017 survey comparing 11 international healthcare systems, The Commonwealth Fund ranked Canada 9th for overall performance and 10th for access to care.5 Effects of long waiting can negatively influence patient well-being, health status, outcomes and confidence in the health system.3 6 7 In a 2017 report comparing Canadian waiting times for hip and knee replacement with those of Organisation for Economic Co-operation and Development (OECD) countries,8 many of whom have publicly-funded, single-payer healthcare systems, Canada ranked 8th among 15 for access to hip replacement and 7th among 15 for access to knee replacement. Median waiting time in Canada was reported to be 14 and 16.6 weeks for hip and knee replacement, respectively. Median waiting time for the OECD countries was 16.4 and 29.2 weeks, for hip and knee replacement, respectively.9
Single-entry models (SEMs) are being increasingly recommended and used in healthcare for scheduled services. In surgical disciplines, for example, SEMs allow for the consolidation of multiple queues into a single queue by centralising the intake of patients, pooling providers and referrals, and allowing patients to see the next-available surgeon. In traditional ‘multiple-queue, multiple-server’ models, each surgeon receives referrals separately, and maintains their own queue.10 11 When these surgeons receive a new patient referral, and if all available appointment slots are full, the patient must wait until a slot becomes available. In this model, the patient cannot take advantage of available appointment slots with other physicians. This is a critical issue when waiting times are unequal, or variation is high, between surgeons (ie, for joint replacement surgery). When these multiple queues are consolidated into a single queue, open appointment slots can be assigned based on patient arrival and patients can therefore be referred to the next-available appointment slot (among participating surgeons). Variability in waiting times is improved (reduced) and average waiting time across specialist physicians is also reduced. Duplicate referrals can be reduced and more urgent patients can also benefit by seeing the next-available/earliest-available physician.10 SEMs have been shown to improve system flow and patient access.12 The Canadian Medical Association refers to them as ‘essential for improving access to quality of care’.13
Since 2000, stakeholders from across the continuum of care have called for evidence-informed improvements leading to greater performance, value and accountability in healthcare.14 To help achieve the desired and so-called Triple Aim—improving the health of populations; improving the individual experience of care and reducing the per capita costs of care for populations—both CIHI and the OECD recommend approaches incorporating structural and programmatic strategies. SEMs may be seen as one such strategy,3 7 although evaluations of their impact on quality of care and health service delivery have been limited.12 15 In its best case, improvements across all three aspects of the Triple Aim would contribute to improvements across the health system, but improvement in even one (without negatively affecting the others) can also bring positive and beneficial impact.
Seven pan-Canadian benchmarks were identified in 2005 for five priority clinical areas: oncology, cardiology, diagnostic imaging, joint arthroplasty and sight restoration.16 The benchmarks were developed to represent a maximum timeframe within which a service should be delivered to a patient. In addition to this metric, accessibility to care is also measured using waiting list length, patient throughput (ie, volume) and waiting times—mean, median and 90th percentile. The evidence-based WTs benchmark for total joint replacement (TJR) surgery of the hip and knee in Canada is currently set at 26 weeks.17–19 While urgent cases are indeed dealt with sooner, where cases are less urgent, patients must wait to be seen. These appointments, however, are often many weeks later.18 20 Currently, patients who require a replacement of the hip or knee in Canada are generally referred to a specific orthopaedic surgeon. As such, each orthopaedic surgeon maintains his/her own list; some lists are much longer than others.
There are approximately 3700 annual TJR surgeries of the hip or knee in the Winnipeg Regional Health Authority (WRHA), approximately 80% of provincial volume.21 Before 2012, only 54% of WRHA patients awaiting total hip replacement (THR) and 50% of patients awaiting total knee replacement (TKR) received surgery within the clinically recommended 26-week benchmark.22 23 This recommended time refers to the time from the date the patient decided to undergo surgery and the date on which the surgery took place (‘waiting time 2’ (WT2)). The Winnipeg Central Intake Service (WCIS), an SEM, was introduced in the WRHA in 2012. This system enabled patients referred for THR or TKR to choose, in consultation with their primary care provider, to see either a specific surgeon or the next-available surgeon for their procedure. The next-available surgeon to whom the patient is referred is one among a pool of eligible surgeons. The patient is ultimately referred to the surgeon with the shortest total waiting time (TW) at the time of the referral receipt by the WCIS. The decision to undertake surgery is then made together by the patient and the surgeon; the decision to ultimately proceed to surgery is predicated on a number of factors, including clinical appropriateness and patient readiness.24 25
The WCIS introduced comprehensive patient education, standardised referral forms, electronic patient management (via the Patient Access Registry Tool), a central office to manage referral screening (for completeness, appropriateness and urgency) and allocation of resources, as well as a regional joint replacement registry to measure and monitor surgical outcomes. Specifically, goals of the WCIS implementation were: (1) to equalise/minimise variation in TW across orthopaedic surgeons; (2) improve patient access to surgery by distributing referrals to the surgeon with shortest TW (next-available surgeon) and (3) increase the proportion of patients treated within benchmark.
Accordingly, we conducted an assessment of the WCIS to evaluate: (1) waiting time variations among surgeons; (2) proportion of patients receiving surgery within benchmark and (3) broader influence of the WCIS across five dimensions of quality of care based on system-level and patient-centred outcomes defined by the Alberta Quality Matrix for Health (AQMH): acceptability, accessibility, appropriateness, effectiveness and safety.26 We hypothesised that based on its goals of implementation, the WCIS would improve ‘accessibility’ (reduce waiting time variability, increase proportion of patients receiving surgery within benchmark) without adversely affecting the other dimensions of quality.
Methods
Study population and data source
Using a natural experiment with a quasi-experimental approach, a preintervention/postintervention cross-sectional study design was used to measure changes in five dimensions of quality of care, as defined by the AQMH, which was developed by the Health Quality Council of Alberta to reflect both system-level performance and patient-centred outcome measures adapted from the Institute of Medicine’s National Healthcare Quality Framework.27 28 Data were collected both before and after WCIS implementation (see online supplementary appendix 1). Two cohorts were identified using the regional surgical THR and TKR waitlist. These cohorts were not followed-up over time. Self-reported medical history, preoperative and postoperative health status and function, waiting time and joint replacement information, outcome and complication data were obtained from the regional joint replacement registry; hospital stay data came from WRHA medical information. We formed a historical cohort (1 June 2011 to 1 June 2012; ‘pre-WCIS’) to function as the preintervention group. This control cohort includes 2397 patients that underwent primary THR or TKR. The postintervention group (‘post-WCIS’, data collected following WCIS implementation; 1 September 2013 to 1 September 2014) includes 2282 patients. A period of 15 months between the two cohorts was defined as the peri-implementation period during which the WCIS was being adopted. We excluded patients: <18 years old, without personal/provincial health identification numbers or non-residents of Manitoba. If a patient underwent a second TJR during the study period, the second procedure was also included. Surgical volume and referral appropriateness data were obtained from the WRHA Surgery Programme. Pre-WCIS referral appropriateness data were obtained from a group of surgeons that perform approximately 40% of THRs and TKRs in the WRHA.
Supplemental material
This study adheres to STROBE Statement guidelines for reporting observational studies.29
Analytical parameters
As a result of patients’ second procedures being included (where applicable), the unit of analysis was based on the joint (rather than the patient). Accordingly, demographic variables were assessed in both cohorts and where appropriate, by procedure groupings (see online supplementary appendix 1 for listing). Variables examined were chosen based on an association to the five dimensions of quality, as defined by the AQMH (see online supplementary appendix 1). Accessibility was assessed using waiting time, proportion of patients receiving surgery within benchmark and variation in waiting times across surgeons (primary outcome measures). The impact of the WCIS implementation on waiting time was defined in two ways. We calculated waiting time 1 (WT1) as the time between receipt of a referral for surgical consultation and the consultation date; WT2 as the time between the date the patient decided to undergo surgery and the date on which the surgery took place; TW as the sum of WT1 and WT2. While we included TW as part of our analysis, we did not conduct analysis specific to WT1 itself due to insufficient data in the pre-WCIS period. We stratified patients by type of procedure (TKR or THR) and then categorised patients based on the 26-week clinically recommended benchmark waiting time for TJR surgery of the hip or knee (whether they waited ≤182 days (less than 26 weeks) or >182 days (more than 26 weeks)). The proportion of patients receiving surgery within the 26-week benchmark was based on WT2. Variation in waiting times across surgeons was determined using the mean SE for WT2 and TW, by individual surgeon. SE was calculated using the robust procedure in SAS.
Variables related to accessibility were of primary interest (they constitute the main goals of the WCIS); however, variables related to other dimensions of quality beyond access were also assessed to ensure they were improving/not being negatively affected by the WCIS. Changes in the remaining dimensions of quality of care were assessed using best-available surrogate variables. Accessibility and appropriateness were assessed using referral and surgery volumes and proportion of patients proceeding to surgery (conversion rate). Effectiveness was assessed using change in Oxford-12 hip/knee (range: 12 (best) to 60 (worst)) and short form-12 (SF-12) scores (range: 0 (worst) to 100 (best)). Acceptability was assessed using patient satisfaction following surgery and safety was assessed using self-reported complications following surgery and in-hospital mortality (data from the Manitoba Health Information Database (provincial client registry database)).
Statistical analysis
We calculated descriptive statistics for variables and between groups, summarised using mean±SD. Binary variables were expressed as percentages. Student’s t-test was used to compare means and the χ2/Fisher’s exact tests to compare proportions. We applied logarithmic transformation where distributions of continuous variables were not normal, used two-sided statistical tests and a significance level of 5%.
Multiple logistic and linear regression was performed using generalised linear mixed models and mixed linear models, while controlling for the possible confounding effect of individual surgeons. Linear regression was performed to assess the association between explanatory variables and WT2. Logistic regression was performed to assess the association between explanatory variables and receiving surgery within benchmark. Our explanatory variables included age, sex, cohort, Body Mass Index (BMI), pre-operative Oxford-12 hip and knee scores, presence of medical comorbidities and SF-12 mental component summary scores. The models were run separately for THR and TKR procedures. Each variable was adjusted for as the dependent variables were regressed.
Patients whose surgeon performed surgeries in one but not both pre-WCIS and post-WCIS periods were not included in our analysis using descriptive statistics, but were included in our regression analysis. To account for surgeon-level bias in patient selection, patient data in both cohorts were clustered based on their surgeon. Since there were fewer covariates being collected, and fewer formalised data collection processes in place before the implementation of the WCIS (especially for self-reported measures related to ‘acceptability’ and ‘effectiveness’), our preintervention period participants had more of their covariate values missing, compared with those in the postintervention period (especially ‘accessibility’). Where covariate values were missing, they were treated as missing and the covariate was excluded. We used SAS software V.9.3 (SAS Institute) to perform our analysis.
Patient and public involvement
We did not directly include patient and public involvement in this study, but our research questions and approach were informed by patient experiences gathered from previous studies,30–36 some of which involved patients directly. We invited patients to partake in resulting studies and related roundtable meetings.37 38
Results
There were 2397 patients who underwent TJR pre-WCIS and 2282 post-WCIS (see table 1). Pre-WCIS patients undergoing THR were older, had a higher proportion of females and a significantly lower proportion of medical comorbidities, compared with those in post-WCIS. Patients undergoing TKR in pre-WCIS had a lower prevalence of medical comorbidities and statistically (but not clinically) better Oxford and SF-12 physical component summary scores compared with those in post-WCIS. Post-WCIS THR patients were younger and less likely to be female than pre-WCIS patients.
Demographic characteristics of preintervention and postintervention groups (hip)
There were more TJR surgeries pre-WCIS than post-WCIS with significantly fewer THRs post-WCIS. The proportion of referrals to specific surgeons fell by 20% points and increased by an equivalent amount for the next-available surgeon, comprising 40% of all referrals (table 2).
Comparing pre-WCIS and post-WCIS referral data for all patients referred for THR and TKR in the WRHA (accessibility and appropriateness)
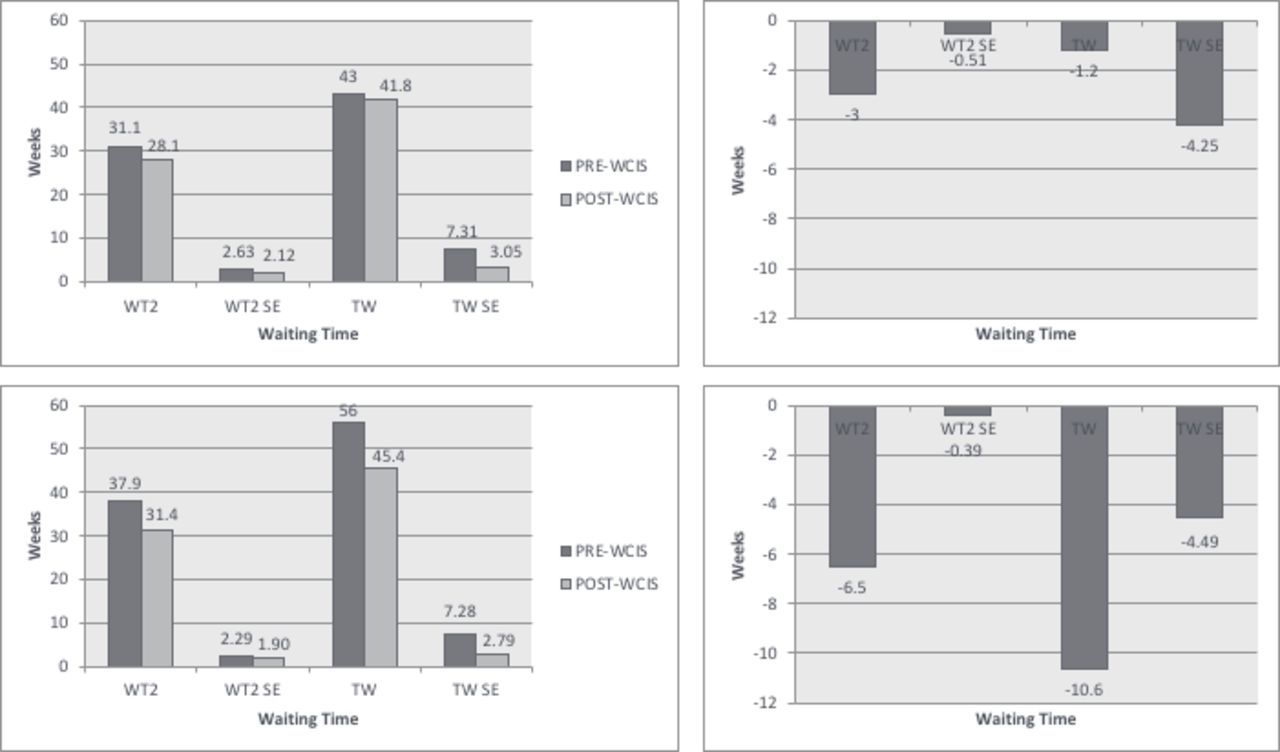
Comparing between timeframes, most orthopaedic surgeons experienced a reduction in waiting time variation for WT2 and TW (from 6% to 61%). These reductions were largest for TW (58.9%) in TKR. TW variability among surgeons was reduced by 3.7 (hip) and 4.3 (knee) weeks (see figure 1). Mean WT2 and TW were significantly lower for patients undergoing TKR post-WCIS compared with pre-WCIS (18%–22% lower).
Mean waiting times (in weeks) and SE* (in weeks; across all surgeons) for total joint replacement surgery†. Note: *Robust SEs were used. †(A) Hip; (B) knee; (C) differences in waiting times and SE (hip; post minus pre); (D) differences in waiting times and SE (knee; post minus pre). Each of the above graphs is comparing WT2 and TW in pre-WCIS and post-WCIS groups. TW, total waiting time; WCIS, Winnipeg Central Intake Service; WT2, waiting time 2.
More patients (5.9%) undergoing TKR received their surgery within benchmark post-WCIS than pre-WCIS (table 3). Self-reported rates of complication were up to 78% lower during post-WCIS periods, for both THR and TKR.
Measures of quality
Linear regression showed that shorter WT2 was associated with post-WCIS group (knee), higher (worse) Oxford scores (hip and knee) and having medical comorbidities (hip) (table 4). Logistic regression (table 4) showed that for THR, receiving surgery within benchmark was significantly associated with lower BMI and worse Oxford-12 score. For TKR, meeting benchmark was significantly associated with cohort (post-WCIS) and worse Oxford-12 score.
Regression models clustered by surgeon: adjusted beta values for the linear regression model for WT2 and adjusted OR for the logistic regression model for proportion of patients receiving surgery within benchmark waiting time (26 weeks)
Discussion
Our study showed that the WCIS helped improve accessibility by reducing waiting time variability among surgeons, all waiting times for TKR and increasing proportion of TKR within benchmark (5.9%). Accessibility and safety were the only dimensions of quality that changed (post-WCIS for both procedures).
To our knowledge, there exist only two other evaluations of SEMs used for THR or TKR,39 40 both limited in their assessment of quality (few dimensions). With respect to studies evaluating SEMs for other scheduled clinical services,39–49 ours is the first to report on all dimensions of quality. For accessibility in particular, there exists one other in outpatient cardiology48 that reports on implications for both WT1 and WT2, and one study examining multiple scheduled services in terms of cost.44 Results of our study were consistent with those in the existing literature using SEMs that have also shown reductions in waiting times,39–44 46 48 greater efficiency,39 42–44 47 49 equity (reduction of variability)39 46 49 and appropriateness,43 46 49 through the use of one or all of the components of SEMs: centralised intake, pooled lists and screening of referrals. Unlike existing studies, ours did not show increases in patient volume (throughput)44 48 49 and showed that the proportion of patients meeting benchmark statistically increased for only one procedure.39–41 43 46 48 Our findings also suggested improvements in safety (with respect to adverse events), and this may be due to possible concurrent changes not related to the WCIS, such as with clinical practice guidelines, surgical equipment, drugs, postsurgery recovery protocol and so on.
Changes in the above metrics may not show the full picture given the 1 year observation period during which awareness and understanding of the WCIS were evolving; they may have been more established and evident during the second and third years of operation. A key mechanism by which variability and length of waiting times decreases, is by increasing the percentage of referrals to the next-available surgeon. The number of surgeons receiving ‘next-available surgeon’ referrals (pool of next-available surgeons) also fluctuated over the course of the WCIS implementation, based on individual surgeon waiting times. Surgeons with high waiting times were only included in this pool as their capacity to accept referrals reached a threshold waiting time. As referrals for the next-available surgeon increase, and as waiting time across surgeons is balanced (thereby increasing the pool of next-available surgeons), we would expect to see greater impact on accessibility. Therefore, these results should be seen as preliminary. Existing studies in the literature allowed for longer periods of observation.44 48 Full uptake of initiatives involving many stakeholders along the continuum of care can take several years for implementation and evaluation.48 50
Moreover, overcall caseload seems to have decreased in the post-WCIS period by 4.8%, and for THR by 13%. This modification in the overall casemix therefore saw a reduction in the most time-consuming procedure (THR vs TKR). As a result, WT2 may have been reduced because the number and mean operating time of procedures also reduced.
Orthopaedic surgeons in the WRHA are paid on fee-for-service basis. This means that surgeons are paid for every surgery they perform. This payment model is different than regions where surgeons may be paid on a salary basis, or where they work in a capitated model, where remuneration is determined in advance and based on a predetermined number of patients or surgeries. The proportion of TKR versus THR surgeries performed and the remuneration of these surgeries may have played a role in reaching the funding quota sooner. One of the factors influencing the number of TKR versus THR performed is that longest-waiting patients were deliberately targeted when the WCIS was first introduced (majority referred for TKR). The lower number of total surgeries following WCIS implementation would appear to be due to funded surgery quotas (and supply of operating room time) being reached sooner than anticipated, requiring a management decision to reduce surgery rates. As is the case at the national level, it may also be the result of a natural increase, year over year, in overall demand resulting from changes in demographics, referral patterns, the need and availability of joint replacement at increasingly younger ages, and changes in the lifespan of each joint replacements; together these may be contributing to little change in waiting times and proportion of surgeries within benchmark.1 2 4 6 51–53
Ultimately, the reduction in surgery rates was made to help ensure a balance between throughput (patient volume) and sustainable funding so that funding allocations for the next fiscal year were not being consumed or jeopardised. This was not the result of external forces; rather it is an ongoing struggle in a publicly-funded, single-payer health system where imbalances between demand and supply give rise to rationing mechanisms such as waiting times and funding quotas. We have a published work that assesses the anticipated and unanticipated consequences stemming from the WCIS implementation, including impact on surgeons and decision-makers.30 54 It is notable that the WCIS resulted in general improvements in accessibility in spite of these pressures. The WCIS continues to undergo iterative quality improvement.
We tried to address the challenges of low rigour and quality in existing studies by designing a comprehensive evaluation with large sample sizes, robust comparison groups and defined variables/outcomes of interest. While a randomised controlled trial would be needed to establish causality, it is still plausible that the WCIS intervention would result in improved accessibility based on what is known from the literature and the logic with respect to queueing theory. As a natural experiment, with a quasi-experimental design, the biggest limitation of our study is the missingness of data. Where historical control cohorts were used, the intervention (post-WCIS) and comparison groups (pre-WCIS) differed in the data available/used for analysis (especially if patient-reported). Prior to the WCIS, data collection was limited given the lack of formalised data collection processes (especially WTs and for self-reported data, hence high per cent missing); there were more data collected following implementation of the WCIS. Missing data can cause difficulties in drawing precise conclusions. Missing data at random can reduce statistical power, reduce precision and the representativeness of samples, and complicate analysis.55 In the case of our study, missing data can be attributed to changes in data collection policies and in low response rates for self-reported patient measures. As such, it is likely that the data were missing at random rather than not at random. This limitation in data availability reduces the observations available for analysis, increases the chance for random error and also reduces precision.55
Furthermore, effects on the non-accessibility dimensions of quality were assessed by measures not necessarily valid for that dimension; hence, we may have underestimated any adverse impact on quality through mis-measurement. The WCIS also represents a complex intervention, with multiple elements and processes, making it difficult to discern the extent to which improvements in quality of care can specifically be attributed to the WCIS and/or its components.
Another limitation of our study is that it is location and case-mix specific, limited to one geographical jurisdiction and intervention, and patients in the pre-WCIS and post-WCIS groups are not the same. Hence, it may be less generalisable to other settings and interventions. Despite these features, we feel our findings provide new insight into the influence of SEMs on health service delivery and quality of care, with direct relevance for jurisdictions currently using or considering using SEMs. Taken together, findings from this study complement qualitative inquiry and stakeholder engagement initiatives undertaken by our team (which includes decision-makers and policy-makers) to better understand stakeholder experiences with the WCIS, including successes, challenges and unanticipated consequences. Direct stakeholder feedback from their experiences with the WCIS led to a Policy Roundtable meeting,37 where further stakeholder engagement informed policy development to improve accessibility to scheduled clinical services across the Province of Manitoba. Relevant stakeholders (including from other SEMs across Canada) were also brought together as part of the Canadian Symposium on Single-Entry models in 2015 to help assemble an evidence-informed roadmap of best practices for the implementation, management and long-term sustainability of SEMs in healthcare.38 Along with these resources, further adequately powered, longitudinal (observation for multiple years) and comparative studies of SEMs across jurisdictions and case-mix (ie, randomized controlled trials (RCTs) or prospective cohorts) would help to identify specific factors associated with improved quality of care and help define best practices to strengthen new and existing models. Providing that there were sufficient data to support such analysis, future research could also employ an interrupted time series design, with multiple data points before and after the intervention to determine the contribution of SEMs to waiting time reduction.
Conclusion
SEMs used for scheduled clinical services have shown promise for improvements in quality of care. In our study, use of the WCIS reduced variability in waiting times among surgeons, reduced patient waiting times and facilitated a greater proportion of TKRs within benchmark without adversely influencing other quality indicators. While our evaluation considered all dimensions of quality, the observation period was limited, and results indicate positive impact on some but not all dimensions.
Acknowledgments
The authors also acknowledge that this work has not been published in full anywhere else, in any language.
References
Footnotes
Contributors ZD initiated the collaborative project, conceptualised and designed the study, analysed and interpreted the data, drafted and revised and finalised the paper. EB initiated the collaborative project and provided methodological advice, conceptualised and designed the study, monitored data collection and revised the draft paper. HQ and TN provided methodological advice, supported analysis and revised the draft paper. GM contributed to the interpretation of the data and revised the draft paper. LL provided methodological advice, analysed and interpreted the data, and revised the draft paper. DAM initiated the collaborative project, conceptualised and designed the study, interpreted the data, drafted and revised and finalised the paper. All authors read and approved the final manuscript being submitted.
Funding This research was supported by a Canadian Institutes for Health Research (CIHR) Evidence-Informed Healthcare Renewal Initiative Grant (#289181) and a CIHR Emerging Team Grant (#92252). ZD is supported by an Alberta Innovates—Health Solutions MD/PhD Studentship (#201100210). DAM is supported by a Canada Research Chair in Health Services and Systems Research (2008-2018) and the Arthur J.E. Child Chair Rheumatology Outcomes Research. Publication of our findings is supported by the Arthur J.E. Child Chair in Rheumatology Outcomes Research.
Competing interests EB is the Medical Director of the Winnipeg Central Intake Service and Chair of the Winnipeg Regional Health Authority Orthopaedic Standards and Quality committee. DAM consults on an ad hoc basis as an advisor for health outcomes and health economics research through Optum Insights and RTI Health Solutions and directly for various pharmaceutical companies on specific research projects and advisory boards. This content was prepared for a poster presentation by ZD at the 2017 Canadian Association for Health Services and Policy Research (CAHSPR) Conference; Toronto, ON: 25 May 2017: ZD, EB, HQ, TN, GM, LL, DAM. Improving quality of care for scheduled clinical services: results from a post-policy implementation review of the Winnipeg Central Intake Service, a single-entry model of referral for total joint replacement.
Patient consent for publication Not required.
Ethics approval This study received approval from the University of Calgary Conjoint Health Research Ethics Board (REB13-0119) and Research Ethics Board of the University of Manitoba (H2012:198).
Provenance and peer review Not commissioned; externally peer reviewed.
Data availability statement This study was funded by a grant from the Canadian Institutes of Health Research (CIHR; Evidence-Informed Healthcare Renewal Initiative Grant (#289181)). CIHR requires grant recipients to retain original data sets arising from CIHR-funded research for a minimum of five years after the end of the grant. This applies to all data, whether published or not. Therefore, data will not be shared.