Article Text

Abstract
Objectives This study aimed at investigating the applicability of a novel index based on waist circumference (WC) and triglyceride (TG) which was named lipid accumulation product (LAP) in the Southern Chinese population, and compared the predictive effects of LAP and other obesity indicators on hypertension risk. Moreover, this study investigated the interactive effects of LAP and family history of hypertension.
Methods A total number of 2079 of community-dwelling adults in Southern China were enrolled in this cross-sectional study. The participants underwent questionnaire surveys, anthropometric tests and laboratory examinations. Themultinomial logistic regression model and receiver operating characteristic curves, including LAP, body mass index (BMI), waist-to-hip ratio (WHR), WC and TG, were used to assess the association between hypertension risk and obesity indexes. The interaction effects were evaluated by relative excess risk of interaction (RERI), attributable proportion due to interaction (AP) and synergy index (SI).
Results Higher LAP levels have a relatively higher risk of having hypertension in both sexes (males: adjusted OR=2.79 per SD increase, 95% CI 1.43 to 5.44, p<0.001; females: adjusted OR=3.15, 95% CI 1.56 to 6.39, p<0.001). LAP (area under the curve=0.721; 95% CI 0.680 to 0.761) is a better indicator in identifying hypertension risk than BMI, WHR and TG in females, but WC performed better in males. A significant interaction between LAP and family history of hypertension was observed in males (RERI=1.652, 95% CI 0.267 to 3.037; AP=0.516, 95% CI 0.238 to 0.794; SI=3.998, 95% CI 0.897 to 17.820), but there is no statistically significant difference in females.
Conclusions LAP significantly associates with hypertension risk in the Southern Chinese population. It has better performance than BMI, WHR and TG on predicting hypertension risk of the Southern Chinese female population. Moreover, LAP and family history of hypertension might synergistically increase the risk of hypertension.
- hypertension
- LAP
- family history
- interaction effect
This is an open access article distributed in accordance with the Creative Commons Attribution Non Commercial (CC BY-NC 4.0) license, which permits others to distribute, remix, adapt, build upon this work non-commercially, and license their derivative works on different terms, provided the original work is properly cited, appropriate credit is given, any changes made indicated, and the use is non-commercial. See: http://creativecommons.org/licenses/by-nc/4.0/.
Statistics from Altmetric.com
Strengths and limitations of this study
Our study is the first to examine the validity of lipid accumulation product (LAP), which is calculated using a modified formula, in the Southern Chinese population.
This is a cross-sectional study; the results are not sufficient to indicate causality.
The population of our study can partially represent the general population in the Southern China but cannot fully represent this region.
This study lacks the adjustment for renal function, and other risk factors for hypertension (such as serum uric acid).
This study has a small sample size, so further studies with a larger sample size are needed to investigate whether the modified LAP applies to all the residents dwelling in Southern China.
Introduction
Hypertension, a significant risk factor of cardiovascular disease,1 is one of the most prevalent public health problems in the world and is the leading contributor to the global burden of disease and mortality. Nowadays, the number of adults with hypertension in the world is being predicted to increase by about 60% to a total of 1.56 billion in 2025, and one-third of adults are suffering from hypertension in China.2 3
Obesity, especially visceral fat, and family history of hypertension contribute to hypertension significantly.4–6 Numerous studies agree on the idea that people with family history of hypertension have higher chance to get hypertension.6–9 Usually, when it comes to obesity, the indexes that are most frequently used to assess obesity are body mass index (BMI), waist circumference (WC) and waist-to-hip ratio (WHR); however, these traditional obesity indexes merely reflect the degrees of overweight and abdominal obesity, and also cannot distinguish the difference between subcutaneous fat and visceral fat.10 Micro-MRI and micro-CT, which are the golden standard measurement methods of visceral fat, are inconvenient and expensive.11 Moreover, they are not suitable for large-scale epidemiological investigations. Therefore, it is necessary to discover a new obesity indicator that can predict visceral fat from subcutaneous fat more conveniently and economically.
Recently, increasing attention has been directed towards lipid accumulation product (LAP). LAP, a new obesity index computed from WC and triglyceride (TG), is a useful indicator of visceral fat,12 as demonstrated by Kahn in 2005.13 Some studies suggest that LAP can also be used to identify metabolic syndromes,14 15 type 2 diabetes mellitus,16 stroke17 and arterial stiffness.18 Additionally, several cross-sectional studies conducted in Japan,19 India14 and Brazil indicate that LAP significantly associated with cardiovascular disease and is a better indicator than BMI for identifying cardiovascular risk.13 20 A few national studies have investigated the association between LAP and hypertension in China, and all of them are conducted in Northern China, including Bengbu,21 Beijing22 and Inner Mongolia.23 With a vast territory, China has a tremendous difference between South and North. Due to the geographical environment and dietary habits that have formed throughout its long history, there are some dietary and cultural differences between Northern and Southern China.24 The northern region shows a high intake of wheat, tubers, liquor, and so on, while southerners have a high intake of rice, vegetables, meat, poultry, fish, and so on.24 The carbohydrate-rich pattern of the northern region is associated with a high risk of hypertriglyceridaemia and higher BMI. Meanwhile, significant differences are found in systolic blood pressure (SBP)/diastolic blood pressure (DBP) between Southern Chinese and Northern Chinese owing to different climate and dietary habits between Southern and Northern.25 Studies have found that the northerners are heavier and have higher TG level than southerners.26 27 The different dietary habits and lifestyle indirectly causes the different of LAP in the North and South. Thus, the applicability of LAP in predicting hypertension in Southern China is worth studying. However, rare studies have compared LAP with other obesity indexes in the Southern Chinese population. Besides, almost all studies about LAP are using the formula based on the third National Health and Nutrition Examination Survey in the USA. Therefore, it is reasonable to suggest that the calculation formula of LAP needs to be modified in the Chinese population.
To the best of our knowledge, no studies have attempted to adjust the calculation formula of LAP so that it can apply to the Southern Chinese population, and rare studies have explored additive interactions between family history of hypertension and LAP. Thus, the primary purpose of this study is to investigate the applicability of LAP in the Southern Chinese population and compare the predictive effects of LAP and other obesity indicators on hypertension risk. The secondary purpose of the study is to assess the interactive effects between LAP and family history of hypertension to predict the hypertension risk in the Southern Chinese population.
Methods
Study design and subjects
A cross-sectional survey based on community health was conducted in the Foshan city of Guangdong province in Southern China. Recruiting the enrollers took place in March 2017. The study samples were selected by a multistage and stratified random sampling method. The stratification according to the economic levels and randomly selected urban and rural at economic levels, then randomly selected communities in urban and rural according to proportion. Community residents were then randomly selected from the household lists. A total of 3760 individuals were enrolled in this study; among them, 1681 participants who lacked complete data on demographic characteristics, anthropometric tests, or laboratory examinations were excluded. There were no statistically significant differences in age and sex between excluded participants and included participants. Finally, 2079 adults who had complete data were included in the analysis.
Patient and public involvement
Patients or public were not involved in this study.
General study questionnaire
An interview-based survey was performed using a questionnaire by trained staff. Sociodemographic data, family history of hypertension, cigarette smoking and alcohol drinking were investigated. Smokers were defined as the participants smoking at least one cigarette/day for at least 6 months. Drinkers were defined as individuals consuming at least 30 mL alcohol/week for 1 year or more. Physical activities were divided into ‘insufficiently active’ and ‘sufficiently active’. Participants with ‘insufficiently active’ physical activities were defined as those who performed activity less than 150 min/week. Participants with ‘sufficiently active’ physical activities were defined as those who exercised more than 150 min/week.28 Marital status was classified as ‘currently not married’ and ‘currently married’; ‘married’ was regarded as ‘currently married’, and ‘divorced/widowed/single’ was regarded as ‘currently not married’. Educational level was categorised as ‘elementary school or lower’, ‘secondary school’ and ‘senior high school or higher’.
Anthropometric tests and laboratory examinations
The participants were required to take off their shoes and wear lightweight clothing for weight and height measurements. WC was measured at the level of 1 cm above the navel.29 Automatic sphygmomanometer (OMRON, hem-7125) was used to measure blood pressure (BP) of participants. BP measurement was conducted thrice in a quiet environment, and the participants rested at least 1 min between each time of measurement. The mean of the three measurements was used in the analysis. Prehypertension was defined as SBP 120–139 mm Hg and/or DBP 80–89 mm Hg, and hypertension was defined as SBP≥140 mm Hg, DBP≥90 mm Hg and/or a reported medical history of antihypertensive medication.29 The BMI was calculated as weight in kilograms divided by the square of the height in metres. Overweight was defined as BMI 24–27.9 kg/m2, and obesity was defined as BMI≥28 kg/m2. The fasting blood samples were collected from the participants in the morning after an overnight fast and were used to assess fasting plasma glucose, total cholesterol and TG levels.
According to Kahn’s theory,13 LAP is calculated as [WC (cm) − the minimum of WC (male)] × [TG (mmol/L)] for males and [WC (cm) − the minimum of WC (female)] × [TG (mmol/L)] for females, and the minimum waist size theoretically contains only the abdomen, muscle, viscera and vertebral bone.13 Visceral fat can be estimated by the difference between the WC and the minimum waist size. In the present study, the WC of the studied population was skewed; therefore, the WC was log transformed. The minimum WC was estimated by the mean WC minus 2 SDs after log transformation in the local participants aged 18–24 years.13 22
Statistical analyses
According to the hypertension status, the enrollees were divided into three groups (normotension, prehypertension and hypertension). The frequency (%) was used to describe sex, marital status, education level, physical activity, BMI, smoker and drinker. Mean±SD was used to describe the WC, WHR, fasting plasma glucose, total cholesterol, TG, SBP, DBP and LAP. LAP was divided into four groups by the quartiles, that is, Q1, Q2, Q3 and Q4. The differences of quantitative data across different hypertension statuses were analysed by the Kruskal-Wallis H test because the data had skewed distribution. Categorical variables were analysed by the χ2 test. The multivariate logistic regression model was used to analyse the relationship between LAP and risk factors of hypertension and prehypertension. The receiver operating characteristic (ROC) curves were applied to identify the superior obesity index and the best cut-off value of LAP to predict the hypertension risk. Moreover, the interaction effects between LAP and family history of hypertension were assessed by some relevant indicators, including the relative excess risk of interaction (RERI=OR11−OR10−OR01+1), the attributable proportion due to interaction (AP=[OR11−OR10−OR01+1]/OR11) and the synergy index (SI=[OR11−1]/[OR01−1]+[OR10−1]). If the interaction effect was not observed, the CI of RERI and AP contained 0 and the CI of SI included 1.30 The above indicators were calculated using an Excel table designed by Andersson et al.30 All reported p values were two tailed, and a p value <0.05 was considered significant. Statistical analyses were performed using SPSS V.19.0 (SPSS).
Results
Lipid accumulation product
According to Kahn’s theory,13 LAP was calculated as (WC−60.6)×(TG [mmol/L]) in males and (WC−54.1)×(TG [mmol/L]) in females based on the actual data obtained from the Southern Chinese population.22
Basic characteristics of the study participants
A total number of 2079 of adults with an average age of 41.06 years were enrolled in the present study, including 1002 males (48.20%) and 1077 females (51.80%). The overall prevalence rates of normotension, prehypertension and hypertension were 40.02%, 37.95% and 22.03%, respectively. Male participants had a high prevalence of prehypertension and hypertension than female participants (p<0.001). Statistically significant differences in age (p<0.001), marital status (p<0.001), education level (p<0.001), smoker (p<0.001), drinker (p<0.001) and family history of hypertension (p=0.005) were observed between normotension, prehypertension and hypertension groups. However, no significant differences were observed in physical activity (p=0.611>0.05) among the three groups. Anthropometric measurements found significant differences in BMI (p<0.001), WC (p<0.001), WHR (p<0.001) and LAP (p<0.001) between the groups. Statistically significant differences were found in laboratory examinations including fasting plasma glucose (p<0.001), total cholesterol (p<0.001), SBP (p<0.001) and DBP (p<0.001) between the groups (table 1). The basic characteristics of different sex of study participants were shown in table 2.
Basic characteristics of the participants
Basic characteristics of the participants
LAP and the risk factors of hypertension
In order to investigate the relationship between LAP and BP, LAP was divided into four groups by quartile in different sex (table 3). A significant association was observed between LAP and BP in both males and females. The results in males and females showed that SBP (p<0.001) and DBP (p<0.001) were relatively elevated in participants with higher LAP levels.
Comparison of blood pressure among four quartiles of LAP
Multinomial logistic regression analysis was conducted to evaluate the association between LAP quartiles and hypertension status (table 4). Participants with the third and the fourth quartiles of LAP were more likely to develop prehypertension and hypertension than those with the first quartile in both males and females.
Multinomial logistic regression analysis of LAP associated with hypertension status
After adjusting for age, marital status and educational level, the risks of prehypertension (adjusted OR: 3.14, 95% CI 1.95 to 5.07) and hypertension (adjusted OR: 9.02; 95% CI 5.11 to 15.93) significantly increased in male participants with the fourth quartile compared with those with the first quartile. For females, increasing risks of prehypertension (adjusted OR: 3.26, 95% CI 2.09 to 5.10) and hypertension (adjusted OR: 6.32; 95% CI 3.42 to 11.65) were observed in participants with the fourth LAP quartile compared with those with the first one.
After controlling for age, marital status, educational level, physical activity, smoking, alcohol consumption, BMI, WHR, fasting plasma glucose and family history of hypertension, the risks of prehypertension (adjusted OR: 1.67, 95% CI 0.96 to 2.92) and hypertension (adjusted OR: 2.79, 95% CI 1.43 to 5.44) significantly increased in male participants with the fourth quartile compared with those with the first quartile. Meanwhile, increasing risks of prehypertension (adjusted OR: 2.10, 95% CI 1.26 to 3.51) and hypertension (adjusted OR: 3.15, 95% CI 1.56 to 6.39) were observed in female participants with the fourth LAP quartile compared with those with the first one.
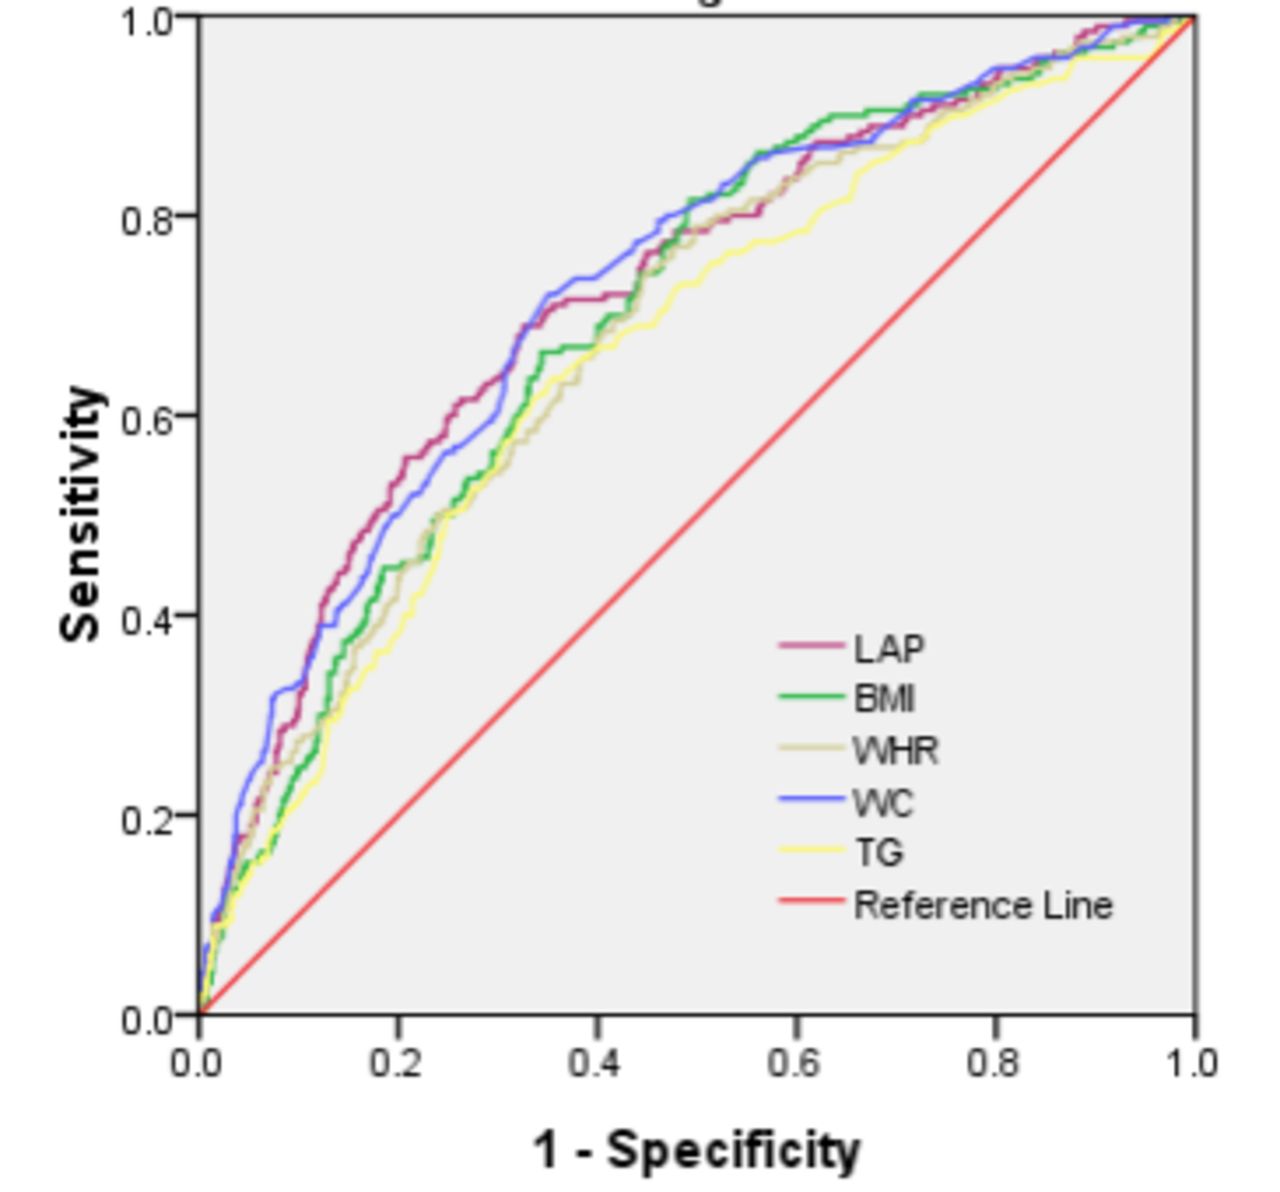
The results of ROC curve analysis in males and females were shown in figures 1 and 2 and table 5. LAP (area under the curve (AUC)=0.721; 95% CI 0.680 to 0.761) was a better indicator to predict different types of hypertension than BMI (AUC=0.698; 95% CI 0.658 to 0.737), WHR (AUC=0.684; 95% CI 0.643 to 0.726) and TG (AUC=0.663; 95% CI 0.620 to 0.706) in females; however, WC (AUC=0.734; 95% CI 0.700 to 0.769) performed better than BMI (AUC=0.707; 95% CI 0.672 to 0.742), WHR (AUC=0.688; 95% CI 0.650 to 0.725), LAP (AUC=0.677; 95% CI 0.640 to 0.713) and TG (AUC=0.607; 95% CI 0.568 to 0.646) in males. The best cut-off values of LAP to predict hypertension were 63.892 in males and 30.860 in females.

The receiver operating characteristic (ROC) curve of different obesity indexes in predicting hypertension in males. BMI, body mass index; LAP, lipid accumulation product; TG, triglyceride; WC, waist circumference; WHR, waist-to-hip ratio.
The receiver operating characteristic (ROC) curve of different obesity indexes in predicting hypertension in females. BMI, body mass index; LAP, lipid accumulation product; TG, triglyceride; WC, waist circumference; WHR, waist-to-hip ratio.
Predicting hypertension by different obesity indexes
Interaction effects between LAP and family history of hypertension
The interaction effects between LAP and family history of hypertension were presented in table 6. Significant interaction effects between LAP and family history of hypertension were observed in males. The results of RERI (1.652; 95% CI 0.267 to 3.037) and AP (0.516; 95% CI 0.238 to 0.794) indicated a significant interaction effect of family history of hypertension and LAP on hypertension, but the result of SI (3.998; 95% CI 0.897 to 17.820) did not.
Interaction effects between LAP and family history of hypertension
However, no statistically significant interaction effects were found between LAP and family history of hypertension in females, which was indicated by all the three indicators. RERI was −0.673 (95% CI −2.566 to 1.220); AP was −0.328 (95% CI −1.451 to 0.795); and SI was 0.610 (95% CI 0.125 to 2.979).
Discussion
With the rapid development of the economy and sedentary lifestyle, elevated BP has become a common and serious public health issue.31 The prevalence of prehypertension and hypertension significantly increased.32 Elevated BP is caused by diverse factors, among which obesity is closely related to hypertension.33 The prevalence of obesity increased by 13% in urban areas and by 85% in rural areas in China, thus more attention should be paid to this issue.17 Extensive studies found that obesity, especially visceral adipose tissue, could strongly increase the BP.33
The mechanisms underlying the interaction between obesity and hypertension are complicated. The mechanisms of obesity-induced hypertension include sodium retention, insulin resistance, activation of renin-angiotensin-aldosterone, altered vascular function and secretion of relevant adipokines.34 Besides, the mechanisms of BP increase can be activated by visceral fat.35
Substantial evidence has shown that the harm of the fat accumulation is greater than the total amount of fat.36 37 However, traditional obesity indexes, such as BMI, WC and WHR, have limitations of distinguishing differences between subcutaneous fat and visceral fat. Therefore, a new obesity index that can predict visceral fat easily and effectively is urgently needed. After Kahn has first shown that LAP performs better than BMI for recognising the cardiovascular risk, domestic and foreign scholars pay increasing attention to LAP. LAP, a combination of WC and TG, is an accessible and inexpensive way to assess visceral fat.13 It is a well-known fact that TG reflects the degree of visceral fat accumulation and WC strongly associates with hypertension.12 Notably, hypertriglyceridaemic waist (HTGW) is also calculated based on the combination of TG and WC. However, LAP, as a continuous indicator, is superior to reflect visceral fat than HTGW,38 a discontinuous indicator.21 Therefore, LAP is used as a visceral obesity indicator in this study.
LAP is based on the minimum WC which theoretically contains only the rachis, abdominal viscera and muscle.13 Therefore, the differences between the actual WC and the minimum WC can represent abdominal adipose tissue.13 Notably, LAP in almost all studies is calculated by data obtained based on the third National Health and Nutrition Examination Survey in the USA.13 Because of differences in race, dietary habits or lifestyle, individuals from different countries should have different visceral adipose tissues. It is shown that there are considerable differences in visceral adipose tissues between Chinese individuals and Europeans or Americans.39 Therefore, LAP is calculated in our study using a modified formula so that it could apply to the individuals dwelling in Southern China.
As expected, a significant association is found between LAP and hypertension in the present study. Our findings are consistent with those in studies by Zhong et al,17 Song et al 37 and Shen et al,22 all of which have demonstrated that LAP is an effective and reliable diagnostic indicator of hypertension. Participants with significantly higher LAP have higher risks of prehypertension and hypertension than those with lower LAP. Multinomial logistic regression analysis reveals that after adjusting for other factors, the risks of prehypertension and hypertension in the group with the highest LAP level are 2.10 and 3.15 times higher in females, respectively, than those in the group with the lowest LAP.
Wang et al found LAP is a better index to predict the risk of hypertension.40 However, Gao et al found that the performance of LAP is superior to that of BMI in male Mongolians23; these findings may be due to the apparently lower prevalence of high TG in female Mongolians than in male Mongolians (13.20% vs 23.10%, p<0.05), and the facts might disturb the association between LAP and hypertension in female Mongolians. Several studies find the superiority of LAP over BMI for detection of hypertension and prehypertension in both genders.21 37 40 However, in the present study, we also found that LAP performs better than BMI in females. According to Kahn and Cheng,41 the annual LAP changes are reduced at older age in males. Advancing age is associated with a progressive increase in systolic BP levels and with development and progression of arterial hypertension because of a number of factors, including atherosclerotic changes, large artery stiffening, altered renal function and arterial baroreflex impairment,42 that is to say, increase in BP is thought to be an unavoidable consequence of ageing. Thus, the superiority of LAP for predicting hypertension in males may be disturbed by the larger scale proportion of elder men (23.7%) in our study. In our study, LAP performs better in predicting the hypertension risk than TG in both sexes. However, due to low predictive value of TG in Southern China, LAP, which combines TG and WC, is slightly inferior to WC.
In general, LAP, which applied to the Southern Chinese population, is a better indicator for predicting the hypertension risk in females in this study. In addition, large studies have demonstrated that family history of hypertension is a critical risk factor for hypertension, and individuals with family history of hypertension are two to four times more likely to develop hypertension than those without the family history of hypertension.43 The interaction analysis in this study indicates the synergistic effect of LAP and family history on the hypertension risk in males, but no statistically significant differences in the interaction effect in females. These findings might be due to the fact that there was no statistically significant difference between females and the family history of hypertension in our study (χ2=6.847, p=0.0355>0.05). In fact, cardiovascular events occur at a lower rate in females than in males.44 In our study, the female participants who have both LAP and family history of hypertension are rarely observed and the prevalence rates of hypertension at a lower rate in females than in males no matter premenopausal status or menopausal status.45 Our study suffers from a small sample size, especially in females. The fewer positive female observers who have higher LAP and family history of hypertension lead to no statistically significant differences in the interaction effect on the hypertension risk in females. The interaction in females is not statistically significant, but their synergistic effect is obvious. The synergistic effect between family history of hypertension and LAP on the hypertension risk is demonstrated in our study as well as in other studies.21 40 Visceral obesity and family history of hypertension may result in increased BP through some unknown mechanisms. However, further studies are needed to investigate the interaction effect between LAP and family history of hypertension on the hypertension risk.
To date, LAP is an inexpensive screening tool to identify visceral adipose tissue, and the method has high reproducibility. LAP, which is proposed by Kahn, is developed for the Western population. Thus this study explored the validity of LAP, which is calculated based on the Southern Chinese population, and the interactive effects of LAP and family history of hypertension. The findings suggest LAP might perform better in predicting the hypertension risk than BMI, WHR and TG in Southern Chinese females. Furthermore, the interaction analysis in this study indicates the synergistic effect of LAP and family history on the hypertension risk. Although the interaction in females is not statistically significant, their synergistic effect is obvious.
This study has some limitations. First of all, because this is a cross-sectional study, the present results are not sufficient to indicate causality. Second, the population of our study can partially represent the general population in the Southern China, but cannot fully represent this region. Furthermore, this article lacks adjustment for renal function, and other risk factors for hypertension (such as serum uric acid). Finally, because of the small sample size in this study, further studies with a larger sample size are needed to investigate whether the modified LAP applies to all the residents dwelling in Southern China.
Conclusion
In conclusion, LAP significantly associates with the hypertension risk, and higher LAP levels have relatively higher BP. It has better performance than BMI, WHR and TG on predicting hypertension risk of the Southern Chinese female population. Moreover, LAP and family history of hypertension might synergistically increase the risk of hypertension.
Acknowledgments
We gratefully acknowledge Dr Pei-Xi Wang, Dr Jin-Xiang Ma, Xin-Yu Bao, Yi-Xian Xie, Xiao-Xia Zhang, Xin Peng, Yan Liu and Meng-Jiao Cheng for their excellent work in study coordination, data collection and management.
References
Footnotes
Contributors JH, PW and JM conceived and designed the study. JH, XB, YX, XZ, XP, YL and MC contributed to collection of data, and analysed the data and interpretation of the results. JH wrote the draft manuscript. JM, PW and JH finalised the manuscript with inputs from all authors. All of the authors approved the final version submitted for publication.
Funding This study was supported by Talent Introduction Fund of Guangzhou Medical University (2009).
Competing interests None declared.
Patient consent for publication Not required.
Ethics approval This study was approved by the Ethics Committee of Guangzhou Medical University. Written informed consent was obtained from each study participant before investigation.
Provenance and peer review Not commissioned; externally peer reviewed.
Data availability statement Data are available upon reasonable request. But our data might not be shared directly, because it’s our team work and the data belongs to our team. Consent should be attained from team members.