Article Text

Abstract
Objective To (1) examine the burden of multiple chronic conditions (MCC) in an urban health system, and (2) propose a methodology to identify subpopulations of interest based on diagnosis groups and costs.
Design Retrospective cross-sectional study.
Setting Mount Sinai Health System, set in all five boroughs of New York City, USA.
Participants 192 085 adult (18+) plan members of capitated Medicaid contracts between the Healthfirst managed care organisation and the Mount Sinai Health System in the years 2012 to 2014.
Methods We classified adults as having 0, 1, 2, 3, 4 or 5+ chronic conditions from a list of 69 chronic conditions. After summarising the demographics, geography and prevalence of MCC within this population, we then described groups of patients (segments) using a novel methodology: we combinatorially defined 18 768 potential segments of patients by a pair of chronic conditions, a sex and an age group, and then ranked segments by (1) frequency, (2) cost and (3) ratios of observed to expected frequencies of co-occurring chronic conditions. We then compiled pairs of conditions that occur more frequently together than otherwise expected.
Results 61.5% of the study population suffers from two or more chronic conditions. The most frequent dyad was hypertension and hyperlipidaemia (19%) and the most frequent triad was diabetes, hypertension and hyperlipidaemia (10%). Women aged 50 to 65 with hypertension and hyperlipidaemia were the leading cost segment in the study population. Costs and prevalence of MCC increase with number of conditions and age. The disease dyads associated with the largest observed/expected ratios were pulmonary disease and myocardial infarction. Inter-borough range MCC prevalence was 16%.
Conclusions In this low-income, urban population, MCC is more prevalent (61%) than nationally (42%), motivating further research and intervention in this population. By identifying potential target populations in an interpretable manner, this segmenting methodology has utility for health services analysts.
- health services administration & management
- quality in health care
- public health
This is an open access article distributed in accordance with the Creative Commons Attribution Non Commercial (CC BY-NC 4.0) license, which permits others to distribute, remix, adapt, build upon this work non-commercially, and license their derivative works on different terms, provided the original work is properly cited, appropriate credit is given, any changes made indicated, and the use is non-commercial. See: http://creativecommons.org/licenses/by-nc/4.0/.
Statistics from Altmetric.com
Strengths and limitations of this study
Large, robust data set of patients with high prevalence of chronic disease.
New descriptive/analytical approach identifies unanticipated overlap of conditions.
Methodology applicable to other similar settings, including urban health systems.
Cross-sectional data precludes causal analysis.
Use of cost claims data rather than clinical diagnosis.
Introduction
The management of multiple chronic conditions (MCC, here defined as the association of two or more chronic health conditions) constitutes a formidable clinical and financial challenge. An increasingly large proportion of the US population lives with MCC, including 42% of adults overall and 81% of those over the age of 65 years.1 In the USA, MCC patients account for more than 70% of all healthcare spending.2 In patients over 65 years old, costs increase exponentially with each additional chronic condition, suggesting that there are additional costs associated with the complexity or inefficiency of care for MCC.3–10
Health systems have responded to these challenges with clinical and financial innovations. Clinical innovations include new models of care coordination, joint clinical guidelines for MCC patients and alternative delivery models which include bundling of services.10–14 Financial innovations include value-based payments and bundled payment schemes. One growing form of value-based financial transformation involves capitation, where a fixed ‘budget’ for each patient is agreed on between the payer and the health system. Accordingly, the health system is incentivised to bring costs down while still maintaining a small margin of profit. In this context, a standard methodology to evaluate the potential interactions between conditions could be mutually beneficial. Importantly, risk adjustment generates appropriately large budgets for high-cost and complex patients, and by doing so accounts for changes in severity over time and incentivises providing coverage to these high-cost individuals. Existing systems of risk adjustment employed by the Centres for Medicaid & Medicare Services (CMS) predict medical and pharmaceutical spending using demographics and diagnosis codes, and are employed in a standardised fashion for Medicare Advantage patients. State-managed Medicaid plans can choose to employ any of many different risk adjustment models, some of which are based on the Medicare Advantage models.15
Especially important in the setting of value-based payment schemes like capitation is the appropriate selection of subpopulations to receive clinical interventions. While increasingly popular nationally, measures targeting patients who are chronically hospitalised (sometimes known as ‘super-utilisers’) have demonstrated mixed cost savings, in part because of difficulties targeting patients who could benefit from interventions.14 16 17
While there exist numerous sophisticated statistical methods for segmenting populations of patients - such as random forests, single decision trees, k-means and hierarchical segment analysis - these methods suffer from limited interpretability, result instability, immense computing overhead and/or tendency for overfitting.18–20 Rather than relying on complex statistical models that require significant computing overhead, we propose a simple descriptive method that can be applied to any population for whom medical claims are available. Because its requisites are computationally simple, this methodology can be easily scaled to larger populations.
Prior studies of spending and MCC have focused on synergy in spending between conditions, or on a specific slice of a population, or type of spending - for example on inpatient or outpatient spending, or on those older than 65.3 7–9 21–23 Notably, literature on MCC patterns and trends among younger, lower socioeconomic status, and vulnerable populations remains scarce, despite their carrying a significant share of chronic disease burden and, accordingly, financial risk in value-based schemes.24 Additionally, under global capitation both inpatient and outpatient costs must be considered together.
In order to develop a methodology that would yield interpretable insights for both clinical interventions and financial incentives, we sought to first iteratively but simply generate many different subpopulations within the study population and then sort them via either clinically meaningful or financially relevant mechanisms. Clinical interventions can be developed from epidemiological information about which conditions are observed more frequently together than expected.25 We theorised that observed/expected (independent) ratios would reveal groups of patients distinct from those based purely on frequency or cost. Combinations of chronic conditions could have shared risk factors (eg, hypertension and diabetes), shared aetiology (eg, hypertension and congestive heart failure) or could be independent altogether (eg, hypertension and arthritis). By contrast, financial interventions can be developed from cost information about which conditions and combinations of conditions occur in the most costly groups of patients. In practical terms, targeting the highest cost combinations of conditions (and therefore segments of patients) could lead to proactive interventions to reduce avoidable or excess utilisation.
Accordingly, in this manuscript we (1) develop a descriptive methodology to identify and describe unique segments of MCC patients, and (2) apply the methodology in an urban health system using administrative claims data derived from a population of managed Medicaid patients at the Mount Sinai Health System under global capitation — a low-income, urban population unlike those previously studied. We also describe the general cost and geographical characteristics of this population, with potential use in future segmenting applications.
Methods
Segmenting
Segments refer to groups of patients who meet certain disease criteria, demographic criteria or both. For example, a segment of patients could be defined by a dyad of diseases (ie, hypertension and hyperlipidaemia), an age range (ages 35 to 50 years) and sex (males). That segment would consist of male patients aged 35 to 50 years with both hypertension and hyperlipidaemia. As described, these segments are not mutually exclusive (ie, one patient can belong to several segments). We systematically investigated every possible segment of patients defined by a combination of two chronic conditions (among 69), an age group (18 to 35, 35 to 50, 50 to 65, 65+) and sex, yielding 18 768 potential segments. For each of these segments of patients, we computed a number of segment characteristics by which to rank them: total cost attributable to segment, average cost per person in segment and observed:expected ratio of disease dyads in each segment. The total cost attributable to the patients in each segment was computed using claims provided by the payer. This calculation includes all costs for these patients, not just those attributable to the diseases defining the segment. Segments were also ranked by average cost per person per year of plan enrolment represented in the segment. For each pair of diseases defining a segment, an observed:expected ratio was computed by dividing the observed frequency of the pair of diseases in the study population by the expected frequency (multiplying together the individual frequencies of each disease in the pair). We chose a cut-off of 30 segment members as the lower limit for understanding probable outcomes through a pilot programme.26
Chronic conditions lists
We completed a review of pre-existing approaches and opted to work with a defined list of 69 chronic condition categories from the Agency for Healthcare Research and Quality (AHRQ).27–29 This condition list was chosen because (1) it included the most expansive list developed by a consensus body of physicians, enabling us to detect uncommon combinations of conditions, and (2) it aligns with other federal multiple chronic condition projects.
Data set and inclusion criteria
We used claims data from patients operating under a capitated contract between Mount Sinai Health System and Healthfirst, the largest managed care organisation for federal Medicaid funds in New York State. These data include all medical claims from 2012 to 2014 including 6 676 867 claims for 213 091 plan members. This period spans from the first full year of claims following the start of the Mount Sinai-Healthfirst contract to the last year when claims were made with the International Classification of Diseases version 9 (ICD-9). Costs represent paid amounts, not charged amounts.
We used the AHRQ Healthcare Cost and Utilisation Project (HCUP) mapping of 4427 ICD-9 codes to 69 clinically-relevant chronic condition categories. We omitted 2015 data because ICD-10 codes were used inconsistently alongside ICD-9 codes, and the HCUP mapping of ICD-10 codes to chronic condition categories is incomplete. We performed a complete case analysis and excluded participants with missing age or gender. The study was approved through Institutional Review Board of the Icahn School of Medicine at Mount Sinai.
Variables
We studied age, gender, location, chronic condition codes, number of chronic conditions and total cost of care during the member’s plan enrolment. Multiple chronic conditions were studied as dyads and triads. The analysis of different combinations of segment criteria was limited by processing power and computational cost.
Statistical analyses
The observed frequency of each segment was age-adjusted using the New York State age distribution. Segments were segmented by gender. Estimates were calculated for segments defined by chronic condition codes, gender, age and total cost of care. Claims were aggregated by patient-year via SQL, and subsequent cleaning, analysis and plotting was performed with R and Python (code available at https://github.com/usnish/mcc_scripts).
Results
Prevalence of MCC by selected characteristics
Sixty-one point five per cent of the study population (61.6% in women, 61.4% in men) lives with two or more chronic conditions, as compared with 42% nationally. Table 1 displays demographic data of the sample (n=143 297 patients). Median age was 47 years (25th percentile=30; 75th percentile=61), and 54.6% (78 199) were female. We identified the most prevalent combinations of two and three chronic conditions. Each dyad or triad result represents the prevalence of patients with that combination of chronic conditions, including those that also have additional conditions (for example, a patient with hypertension, hyperlipidaemia and diabetes would be counted in a single triad, and also within both the hypertension-hyperlipidaemia and hyperlipidaemia-diabetes dyads).
Demographics of Medicaid patients at Mount Sinai Health System belonging to Healthfirst capitated contracts
These overlapping segments of patients, ranked by age-adjusted frequency, are reported in table 2. Of these, 16 044 segments contained at least one patient — with the largest segment containing an average of 4329 patients per year. The most common dyad was hypertension and hyperlipidaemia (19% age adjusted), and the most common triad was hypertension, hyperlipidaemia and diabetes (10% age adjusted).
Top segments of two and three chronic conditions, ranked by age-adjusted frequency using overall list of 69 conditions
Healthcare expenditures
Figure 1 shows healthcare expenditure among patients with different numbers of chronic conditions. Patients with missing demographic data have been excluded (12.4% of all patients). Costs increase by over 40% with each additional condition, as does the patient-to-patient variance in yearly cost.

Distribution of individual annual healthcare expenditures as a function of number of chronic conditions.
Segments by age, sex, costs
Online supplementary table 1 indicates the top segments and characteristics by chronic conditions by age and gender using the classification outlined in the Methods section. The lists are presented by top 10 highest frequency (3A), top 10 dyads with the highest costs and at least an average of 30 members per year (3B) and by top 10 dyads with the highest cost and at least an average of 1000 members per year.
Supplemental material
Adjusting the minimum threshold number of patients constituting a segment alters the kinds of diseases represented. For example, if the minimum size of a segment is 30 members, the highest cost segment becomes males age 35 to 50 with ‘anaemia and other non-cancer haematological disorder’ and ‘conduction disorder or cardiac dysrhythmia’. However, if this threshold is raised to 1000 members, the highest cost segment becomes females age 50 to 65 with ‘hypertension and coronary atherosclerosis’. In general, smaller segments (>30 to 1000 members) tended to be higher in average individual cost, but lower in total cost, than the larger segments (>1000 members).
Table 3 shows the top 10 segments including age (four categories) and gender (male/female). This table indicates dyads of chronic conditions organised by observed/expected ratios. This data reveal a different relationship of chronic conditions to one another than the frequency and cost tables. By selecting segments of patients with at least 30 included, we demonstrate relationships between unexpected diseases in small yet high-cost groups of patients. For example, paralysis and immunity disorders occur at 16.6 times the expected rate, accounting for an average yearly cost of $81 414. By selecting segments of patients with at least 1000, we demonstrate relationships that are more commonly observed (and more frequently expected), such as between peripheral atherosclerosis and coronary atherosclerosis, or between anxiety disorders and bipolar disorder.
Observed/expected ratios of chronic conditions among common (A) and uncommon segments (B)
Age, spatial distribution and rising risk for patients with multiple chronic conditions
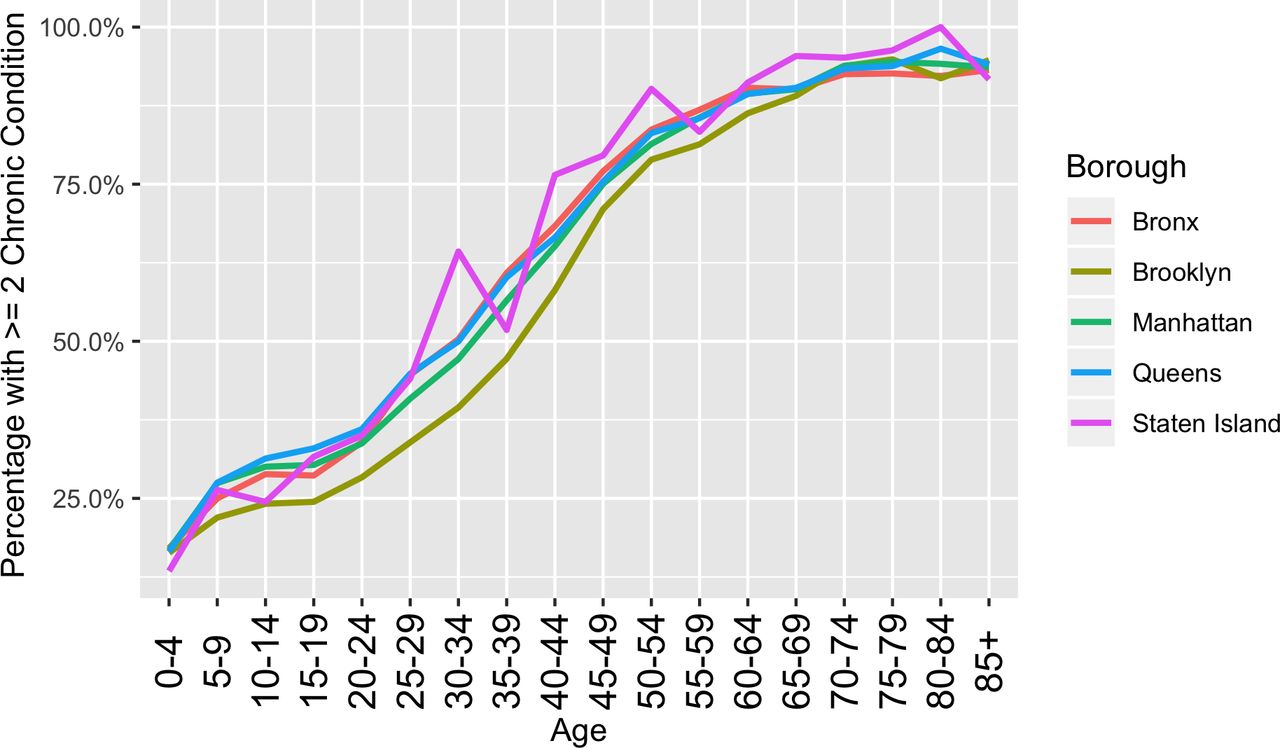
Figure 2 shows frequency of multiple chronic conditions as a function of age across the five counties in New York City. A 50% prevalence of MCC is seen at age 30 to 34 in the Bronx, a lower-income borough of the city, whereas in Brooklyn at in the same 30 to 34 age-group, the prevalence is only 34%.
Frequency of multiple chronic conditions by age across selected boroughs of New York City. 50% prevalence of multiple chronic conditions seen at age 30 to 34 for all boroughs except for Brooklyn that reaches 50% at age 35 to 39. Disparities between boroughs observed.
Discussion
In this paper, we argue that this simple descriptive segmenting methodology has utility for resource planning, care coordination and care delivery. This methodology would be especially useful in the context of public and private benefits schemes focused on low-income populations.
We find that 61.5% of our population lives with two or more chronic conditions as compared with 42% nationally, motivating efforts to build MCC interventions and tools in the Medicaid population.2 Using an established list of conditions, we found that total costs increase with each condition added, consistent with findings from other research groups.3–6 21–23 30 We also found that the most frequent dyad of co-occurring chronic conditions was hypertension and hyperlipidaemia (19% age-adjusted) and the most frequent triad was diabetes, hypertension and hyperlipidaemia (10% age-adjusted), each in turn more frequent in our study population than nationally (13.6%, as estimated from National Health and Nutrition Examination Survey (NHANES) in 2010, and 6.3%, from NHANES in 2012).31 32 This is a striking finding, considering that the NHANES cohort includes a larger proportion of older adults than our study. As NHANES includes fixed sample-size targets and weighting to generate a national sample of households that is representative of the US adult population, the median age at the time of these studies was 37.2, significantly older than the median of 26 in our data set. This age discrepancy could be due to two reasons: (1) As adults who are dual-eligible for Medicaid and Medicare are often redirected to managed Medicare contracts, our study population under-represents adults over 65. (2) Studies of chronic conditions in adults using NHANES tend to utilise a minimum age of 20, as people aged 19 or younger are categorised as ‘youth’; compared with the age cut-off of 17 or younger in our study population.5 6
Women aged 50 to 65 with hypertension and hyperlipidaemia were the leading cost segment in the health system for dyads. Overall, women aged 50 to 65 and hypertension, osteoarthritis, hyperlipidaemia were the leading triad in terms of prevalence and cost. The most significant observed/expected ratio dyads were pulmonary disease and myocardial infarction. We provided various approaches to grouping these chronic conditions in service of broader research objectives to identify conditions that drive multiplicative, rather than additive, health or cost burdens.
The observed/expected approach provides a clinically oriented view of examining which conditions occur disproportionately together. For example, we find that in our study population, anaemia, pulmonary heart disease, congestive heart failure and conduction disorders occur together more frequently than expected. We also observe that patients’ costs balloon when they have these conditions. This would suggest an area where healthcare systems need to focus — screening, dedicated counselling, resources and research dollars. For instance, by targeting patients with conditions like anaemia and pulmonary heart disease that are not necessarily physiologically related, care managers can minimise fractures in care. If taken together with our finding that MCC burden differs by locale (figure 2) health systems should elect to co-locate specialty clinics, share clinical teams and develop joint management protocols for these conditions. While these kinds of innovations have been prototyped around episodic procedural care, such as knee and hip replacements, they have yet to be adopted in managing MCC.13 33 34 Meanwhile, patients with multiple chronic conditions are already requesting these changes.35 Importantly, this approach yields specific chronic disease targets beyond the most frequent conditions.
Conditions like anaemia and pulmonary heart disease are not currently considered among the interaction terms included in existing CMS models (which focus instead on predicting indicators of severe disease like sepsis, pulmonary embolism or seizure disorders), but may be more locally appropriate measures of disease severity or spending in this population. Further validation would be required of these novel disease interactions in a larger or different sample population.
At the same time, the sorting of segments by highest cost and frequency provides a simple view of groups where minor interventions could result in larger-scale cost-savings, particularly for health systems facing value-based financing schemes. Addressing the top segments of patients with bundled financial incentives could supplement the clinical innovations described above. Indeed, recent analyses of the Medicare Shared Savings plan have found that a significant proportion of savings were derived from incremental cost interventions that applied to large swathes of the insured population.36
It is clear that the threshold itself — small, medium or large — for the volume of patients to analyse can be modified with effect on the resultant segments. While senior executives and health services analysts in population health may be interested in overall patterns, costs and adjusted risk of comorbidity, speciality service lines may be focused more on tailored, smaller patient segments with unique disease patterns requiring integrated care. For example, the development of a value-based healthcare programme in the US Navy involved the creation of integrated practice units to treat low back pain and osteoarthritis.37 Our analysis across multiple thresholds animates how the thresholds can affect the resultant patterns produced.
Notably, these results differ from a separate analysis by our research team using a list of 12 chronic conditions in the Behavioural Risk Factor Surveillance Survey conducted by the Centres for Disease Control. In this work, we found that from 2011 to 2016, 50.6% of adults in New York State had two or more chronic conditions. The most prevalent dyads we identified were hypertension and high cholesterol (17% and most prevalent triad was hypertension, high cholesterol and arthritis (4.5%). Prevalence of MCC in New York City neighbourhoods ranged from 33.5% to 60.6%.38
Our findings apply not only to the reform of existing programme for low-income and vulnerable populations, but also the design of novel ones, in the Mount Sinai system and beyond. For example, Mount Sinai offers Healthfirst (and other) patients who require inpatient-level care an alternative: a hospital-at-home (HaH) programme in lieu of inpatient admission.39 40 Evaluation to date demonstrates that this HaH programme delivers superior patient outcomes (including shorter length of stay) and greater patient satisfaction than in-hospital care, though costs have not yet been compared.39 The HaH programme focused on only nine diagnoses at its founding in 2014, but has since expanded in size and breadth of care across multiple New York hospitals, treating myriad other conditions across eight domains of care, such as postsurgical care, palliative care and subacute rehabilitation, among others.40 Rapid and timely data on the prevalence and overlap of these (largely chronic) diseases and their risk factors will be instrumental to the programme’s ongoing cost-effective scale-up. Such data could prove even more valuable in low- and middle-income countries, where the burden of chronic disease is rapidly expanding, but models for the integrated care of more than one chronic condition are few and small in scope.41
The limitations of our proposed approach include the following: (1) the use of health insurance claims itself limits the epidemiological utility of the analyses. Claims are effectively billing receipts and therefore have limited reliability in reporting disease states.42 Additionally, we did not control for variations in coding by centre or physician. We plan to integrate these claims data with electronic medical record data going forward in order to retrieve higher quality epidemiological insights. (2) Our analysis is limited by the study period. Data from 2012 to 2014 is likely not recent enough to enact present-day interventions in a health system — this is largely because the mapping of ICD-10 codes to chronic condition categories has not been finalised, with some remaining discontinuities between ICD-9 and ICD-10-based classifications, limiting our ability to use data from 2015 onwards. We plan to include more recent data once the mapping is completed, as well as prototype this methodology using the CMS Chronic Condition Warehouse algorithm, which functions with ICD-10 codes but includes fewer conditions (27 rather than 69).43 Additionally, we did not examine epidemiological trends through time, as a period as short as 3 years is not long enough to elucidate relationships between diseases that share aetiology (ie, hypertension, stroke). (3) The generalisability of our analysis is limited by the geospatial distribution of patients in the study population — because provider attribution is accomplished regionally, our data set includes the subset of New York City patients who live near Mount Sinai practices. As a result, in the current data set, the majority of patients are located in just 10 of 176 ZIP codes. Future analyses using a data set such as an all-payer claims database would allow researchers to define segments by region and ZIP code. Accordingly, this study population of managed Medicaid patients is not necessarily representative of the Medicaid or US population at-large, or the fee-for-service Medicaid population served by Mount Sinai. (4) We did not include pharmacy claims in our analysis, which will result in an underestimation of spending. This underestimation is most significant regarding conditions that require expensive medications (ie, high-cost treatments for HIV and hepatitis C). However, we also note that risk adjustment methodologies employed by Medicaid Advantage and State Medicaid programmes tend to predict spending on pharmaceuticals separate from other costs.5 15 Lastly, a significant portion (12.4%) of our study population was excluded on account of missing demographic data, introducing some bias into which segments of patients were highlighted. Any more pragmatic application of this methodology would also require an approach to patients with missing data.
Taken together, these analyses have implications for health systems, financiers and researchers working to address MCC, and provide a common methodology for targeting populations for financial and clinical intervention. Most notably, this tool yields a simple, transparent methodology for selecting coherent, clearly-defined populations of patients for intervention and can be applied to any commercial claims data set. With application in the right contexts, this methodology could help improve the selection strategy of super-utiliser clinics and other clinical innovations, yielding further advancements in our health systems’ management of chronic conditions. Payors may increasingly rely on interaction of diseases to help identify appropriate levels of reimbursement based on predicted risk of hospitalisation or mortality for patients. Ultimately, however, more research is needed to evaluate this methodology’s utility in business scenarios, and applicability to different sizes and kinds of patient populations.
References
Footnotes
Contributors SPK conceived of the study. CHa advised on technical analysis. UBM, CHu and PD completed analyses. AJB, ELL, DJH, RK and RF provided technical input to the manuscript. UBM wrote the manuscript. SPK, ELL, DJH, CHu and CHa edited drafts of the manuscript.
Funding This work was supported by Teva Pharmaceuticals for the Multiple Chronic Conditions Initiative with the Arnhold Institute for Global Health. Dr. Heller also reports support from the NIH Fogarty International Center (R21 TW010452-01).
Competing interests None declared.
Patient consent for publication Not required.
Provenance and peer review Not commissioned; externally peer reviewed.
Data availability statement Data are available upon reasonable request.