Article Text

Abstract
Objectives To describe healthcare use and spending before and on becoming a new (incident) senior high-cost user (HCU) compared with senior non-HCUs; to estimate the incremental costs, overall and by service category, attributable to HCU status; and to quantify its monetary impact on the provincial healthcare budget in Ontario, Canada.
Design We conducted a retrospective, population-based comparative cohort study using administrative healthcare records. Incremental healthcare utilisation and costs were determined using the method of recycled predictions allowing adjustment for preincident and incident year values, and covariates. Estimated budget impact was computed as the product of the mean annual total incremental cost and the number of senior HCUs.
Participants Incident senior HCUs were defined as Ontarians aged ≥66 years who were in the top 5% of healthcare cost users during fiscal year 2013 (FY2013) but not during FY2012. The incident HCU cohort was matched with senior non-HCUs in a ratio of 1 HCU:3 non-HCU.
Results Senior HCUs (n=175 847) reached the annual HCU threshold of CAD$10 192 through different combinations of incurred costs. Although HCUs had higher healthcare utilisation and costs at baseline, HCU status was associated with a substantial spike in both, with prolonged hospitalisations playing a major role. Twelve per cent of HCUs reached the HCU expenditure threshold without hospitalisation. Compared with non-HCUs (n=5 27 541), HCUs incurred an additional CAD$25 527 per patient in total healthcare costs; collectively CAD$4.5 billion or 9% of the 2013 Ontario healthcare budget. Inpatient care had the highest incremental costs: CAD$13 427, 53% of the total incremental spending.
Conclusions Costs attributable to incident senior HCU status accounted for almost 1/10 of the provincial healthcare budget. Prolonged hospitalisations made a major contribution to the total incremental costs. A subgroup of patients that became HCU without hospitalisation requires further investigation.
- health policy
- health economics
- geriatrics medicine
This is an open access article distributed in accordance with the Creative Commons Attribution Non Commercial (CC BY-NC 4.0) license, which permits others to distribute, remix, adapt, build upon this work non-commercially, and license their derivative works on different terms, provided the original work is properly cited, appropriate credit is given, any changes made indicated, and the use is non-commercial. See: http://creativecommons.org/licenses/by-nc/4.0/.
Statistics from Altmetric.com
Strengths and limitations of this study
This population-based study examines incident (new) senior high-cost users (HCUs), which provides important information on the driving factors for HCU status.
Inclusion of all incident senior HCU in the province into the study population allowed us to calculate their monetary impact on the provincial healthcare budget.
This analysis includes a comprehensive spectrum of the most important cost categories that contribute to total public healthcare expenditures in the province.
Despite the comprehensiveness of cost analyses, a few of the cost categories may not have been captured in full, for example, outpatient intravenous chemotherapy.
The findings, especially with respect to the total incremental costs and the budget impact, are only comparable to studies with the same HCU threshold and the choice of cost categories.
Introduction
Healthcare spending has more than doubled in the countries of the Organisation for Economic Co-operation and Development over the past two decades.1 In Canada, where public health and healthcare are under provincial jurisdiction, health spending accounts for 37% of the total provincial programme spending on average.2 Much of the spending is disproportionately attributed to a small but heterogeneous group of patients, commonly referred to as high-cost healthcare users (HCUs).3–5 The pressing need to control healthcare spending and the inconclusive evidence and varying success of clinical interventions targeting the HCU group6 7 have prompted policy-makers to revise their management strategies and to seek specific segments of the HCU population who may benefit from certain interventions more than others.4 8 9
Incident (or new) senior HCUs represent one such segment whose patient care characteristics and spending patterns have not been well studied. A recent systematic review identified 55 studies published over the past two decades that reported HCU characteristics and healthcare utilisation.5 The vast majority (n=42) of the publications originated from the USA, nine were from Canada, three were generated by researchers from European countries and one was from Taiwan. Compared with nine US-based studies of the Medicare (ie, senior) population, only the study from Taiwan among the others had a specific focus on seniors, even though approximately 45%–55% of senior healthcare care resources are reportedly consumed by senior HCUs in various jurisdictions.10–12 Moreover, these studies do not differentiate between prevalent (who retain the HCU status over years) and incident senior HCUs. This is important, as understanding the path to HCU status may identify opportunities for intervention.4 Further, it is well known that senior HCUs, both prevalent and incident, generally have poor functional status and consume a high level of healthcare resources, including typically reported acute inpatient care and physician services.7 13 14 However, comprehensive descriptions of cost drivers to HCU status are few.10 15 A recent example is a study conducted in Ontario, the largest province in Canada, which presented a system-wide assessment of cost concentration among HCUs over 3 years using both longitudinal and cross-sectional approaches to their analysis.10 While providing valuable information on the transition of patients between various cost strata, their longitudinal analyses focused on the persistence of costs among all HCUs. Their cross-sectional analysis of expenditures by cost category was limited by only reporting on the top 1% of HCUs and was not stratified by age. Another poorly explored aspect of HCU cost analysis is the economic burden associated with HCU status, which remains largely unknown in Canada and elsewhere. While some international studies have compared costs between HCUs and non-HCU cohorts in a particular year using a cross-sectional design,3 16 17 these comparative studies did not consider any secular trends over time (eg, costs in the years before the incident year). This limits our understanding of the true incremental costs of becoming a new HCU, especially among seniors.
We recently reported on a cohort of incident senior HCUs compared with matched non-HCUs to examine regional variation in mortality and costs in Ontario using cross-sectional data.18 Here, we aim to determine the incremental healthcare utilisation and costs among new senior HCUs in Ontario by looking at the same data longitudinally. The main objectives of this study were to (1) describe healthcare use and spending before and on becoming a senior HCU compared with senior non-HCUs; (2) estimate costs and healthcare use attributable to the incident senior HCU status and to (3) quantify the monetary impact of incident senior HCUs on the provincial healthcare budget.
Methods
Study design
We conducted a retrospective population-based matched cohort study using administrative healthcare data from Ontario, Canada. The protocol for this research has been published.19
Setting and data sources
Ontario is Canada’s most populous province, with almost 14 million residents (approximately 40% of the Canadian population).20 The Ontario Ministry of Health and Long-Term Care (MOHLTC) pays for approximately 70% of healthcare provided in the province. This includes nearly 100% of hospital care, physician services and prescription drugs for seniors.21
A patient-level dataset was created by linking 19 health administrative databases19 using unique encoded identifiers at Institute for Clinical Evaluative Sciences (ICES) (www.ices.on.ca). ICES is an independent, non-profit research corporation funded by the Ontario MOHLTC. The Ontario government fiscal year 2013 (1 April 2013 and 31 March 2014) was considered the incident year (FY2013). FY2012: 1 April 2012 and 31 March 2013 was the baseline or preincident year.
Study population
Incident senior HCUs were defined as individuals aged 66 years or above with annual total healthcare expenditures in the top 5% of all Ontarians in FY2013, who were not in the top 5% healthcare users in FY2012. The 5% threshold is commonly reported in HCU studies in Canada and elsewhere.10 14 22 23 The >66 years age threshold was applied to capture Ontario Drug Benefit (ODB) expenditures for at least 1 year before the incident year: ODB coverage starts automatically when Ontarians reach 65 years of age.24 The ‘non-HCU’ cohort included those whose annual total healthcare expenditures in FY2012 and FY2013 were below the top 5% threshold in both years. The incident HCU cohort was matched with non-HCU in a ratio of 1 HCU :3 non-HCUs by age at the cohort entry (within 1 month), sex and Local Health Integration Network (LHIN) of patient residence. LHINs, Ontario’s 14 regional health districts, are responsible for the planning and administration of most of hospital-based and community-based health services delivered within their geographical boundaries.25
Variables
Our dataset included key information on sociodemographic and health status, healthcare utilisation and costs. Described in the study protocol19 in more detail, key variables are briefly summarised below.
Sociodemographic status included age, sex, low income status and geography of residence (urban/suburban/rural). Low-income status was based on net household income reported to receive ODB subsidy in FY2012. Rurality was based on the Rurality Index for Ontario (RIO), which is a scale from 0 to 100. An RIO between 0 and 9 defined an individual from the urban area, between 10 and 40 described a suburban resident, and a resident from a rural area had an RIO score of 40 and above.26
Health status was assessed using several variables. We used two tools derived from Johns Hopkins Adjusted Clinical Groups (ACGs) System, V.10, a casemix methodology to describe a population’s healthcare utilisation looking back for 3 years prior to the incident year.27 First, the general degree of comorbidity was captured by the number of Johns Hopkins Aggregated Diagnosis Groups (ADGs): person-focused, diagnosis-based method to measure patients’ illness by assigning individual ACGs into diagnosis clusters.28 A higher number of ADGs per patient indicates a greater burden of illness. In addition, we identified the proportion of patients with a history of hypertension, malignancy and mental health condition using John Hopkins Expanded Diagnosis Clusters. For each condition, we checked whether the patient was diagnosed with the condition in the 3 years prior to FY2013. Finally, we used validated administrative data case definitions to identify whether the patient had a history of several common chronic diseases, including congestive heart failure, diabetes and chronic obstructive pulmonary disease.29 30 The choice of specific conditions used to describe patients was driven by several factors: (1) chronic conditions that are commonly associated with high economic burden (cardiovascular and pulmonary diseases, malignancy)31–33 ; (2) conditions that are well known risk factors (eg, hypertension, diabetes) and (3) availability of data.
Whereas sociodemographic characteristics and health status were captured at baseline, healthcare utilisation and expenditures were obtained for the full 2 years of study. Utilisation variables included the number of hospitalisations (all, elective and unplanned), emergency department (ED) visits, physician encounters and publicly funded home care services. Home care services were subclassified by type of service: nursing, personal support and allied health. For each hospitalisation, we obtained the total length of stay (TLOS), in days.
Healthcare expenditures were estimated using ICES person-level health utilisation costing algorithms,34 which report expenditures according to 12 health service cost categories. Hospital costs were the sum of costs associated with acute inpatient care and same-day surgery. Mental health admissions were costed separately. Physician expenditures were the sum of fee-for-service billings and capitation payments. The cost categories also separately included publicly funded long-term homes, inpatient rehabilitation services, community home care and admissions to complex continuing care. Costs were expressed in 2013 Canadian Dollars.
Outcomes
The primary outcome measures were (1) 1-year incremental healthcare utilisation for hospital admissions (total and by types such as unplanned and elective), emergency visits, physician encounters (total and separately for specialists and general practitioners) and home care services (total and by type); (2) 1-year incremental costs attributable to becoming an HCU (total healthcare expenditures and by cost category) and (3) provincial budget impact of new senior HCUs in FY2013. Incremental healthcare use and costs were calculated as the difference between the two cohorts over 1-year period. They represent additional mean visits made or costs incurred by an HCU in the incident year compared with a non-HCU and the baseline year.
Statistical analysis
Baseline patient sociodemographic and health status characteristics of the two cohorts in FY2012 were compared using the absolute standardised difference (aSD), with aSD >0.1 indicating a meaningful difference.35 We then described the HCU cohort in the context of cost categories and their contribution to the HCU status by calculating the proportion (%) of HCU in each cost category. Since we expected hospitalisations to be a frequent cause of new HCU status, we repeated this analysis for HCUs who were not hospitalised during the incident year to evaluate the contributions of cost drivers other than hospital admission. This was followed by a longitudinal comparison of the unadjusted healthcare use and costs in both cohorts for both the incident year and the preceding year.
Incremental healthcare use and costs were estimated using the recycled predictions method.36–39 Commonly used to evaluate the marginal effect of a covariate on the response variable, the method uses fitted regression models to predict incremental values of the outcomes in two hypothetical populations: one where all subjects are HCU and another where all are non-HCU, all the other covariates being the same. The difference in predicted means between the two populations indicates the incremental value. The method allows for correlation between outcome values in the year before the index year (FY2012) and after the index year (FY2013), while comparing HCU with non-HCU. CIs of the incremental values were obtained through the percentile method: random bootstrap resampling with 1000 iterations created a distribution where the 2.5th and 97.5th percentiles were the 95% lower and upper bound CIs, respectively.39
We used generalised linear regression to model the study outcomes. Costs were modelled with gamma distribution and log-link function to handle the right-skewed data.40 41 The choice of gamma distribution was confirmed by the modified Park test.42 For count data (eg, hospital admissions or home care visits), a negative binomial (NB) distribution was specified as the leading option to better account for overdispersion (ie, observed variance is greater than the assumed variance).43 44 In cases of an NB model not converging, Poisson distribution was used. For both costs and count data, we used two-part models (Hurdle regression) to manage zero values in the response variables: the first part used a logistic regression to predict the probability of positive values of the outcome, while a gamma or an NB model was applied in the second stage for positive costs and counts, respectively.43 45 All the models were adjusted for previous resource use (eg, costs or healthcare use in FY2012), age, sex, ADGs and low-income status. Because our dataset included all senior HCU subjects in the province at the time of the study, we were able to estimate the total provincial public healthcare expenditures attributable to HCU status among Ontario seniors by multiplying the total incremental costs by the total number of senior HCU. Statistical analyses were conducted using SAS V.9.4.3 (SAS Institute). The SAS scripts are available as online supplemental material.
Supplemental material
Patient and public involvement
Patients or public were not involved in the design of this retrospective cohort study.
Results
Patient characteristics
The total study population consisted of 703 388 seniors, of which 175 847 were incident HCUs. This population of incident HCUs represents 46% of all HCUs in FY2013 (n=383 257) but only 9.4% of the Ontario senior population and 1.4% of the total population in the province.20 As expected, the mean ages of the HCU and non-HCU cohorts were identical at 77.7 years (SD 7.7); 53% were women; and most resided in suburban areas (12.2 vs 11.8, aSD=0.02) (table 1). Compared with non-HCUs, HCUs had poorer health status as defined by both the number of aggregated diagnosis groups (10.2 vs 7.9, aSD=0.54) and higher prevalence of chronic diseases. A relatively greater percentage of HCU cohort members had a primary care provider (97% vs 88.6%, aSD=0.33).
Patient characteristics
HCU status
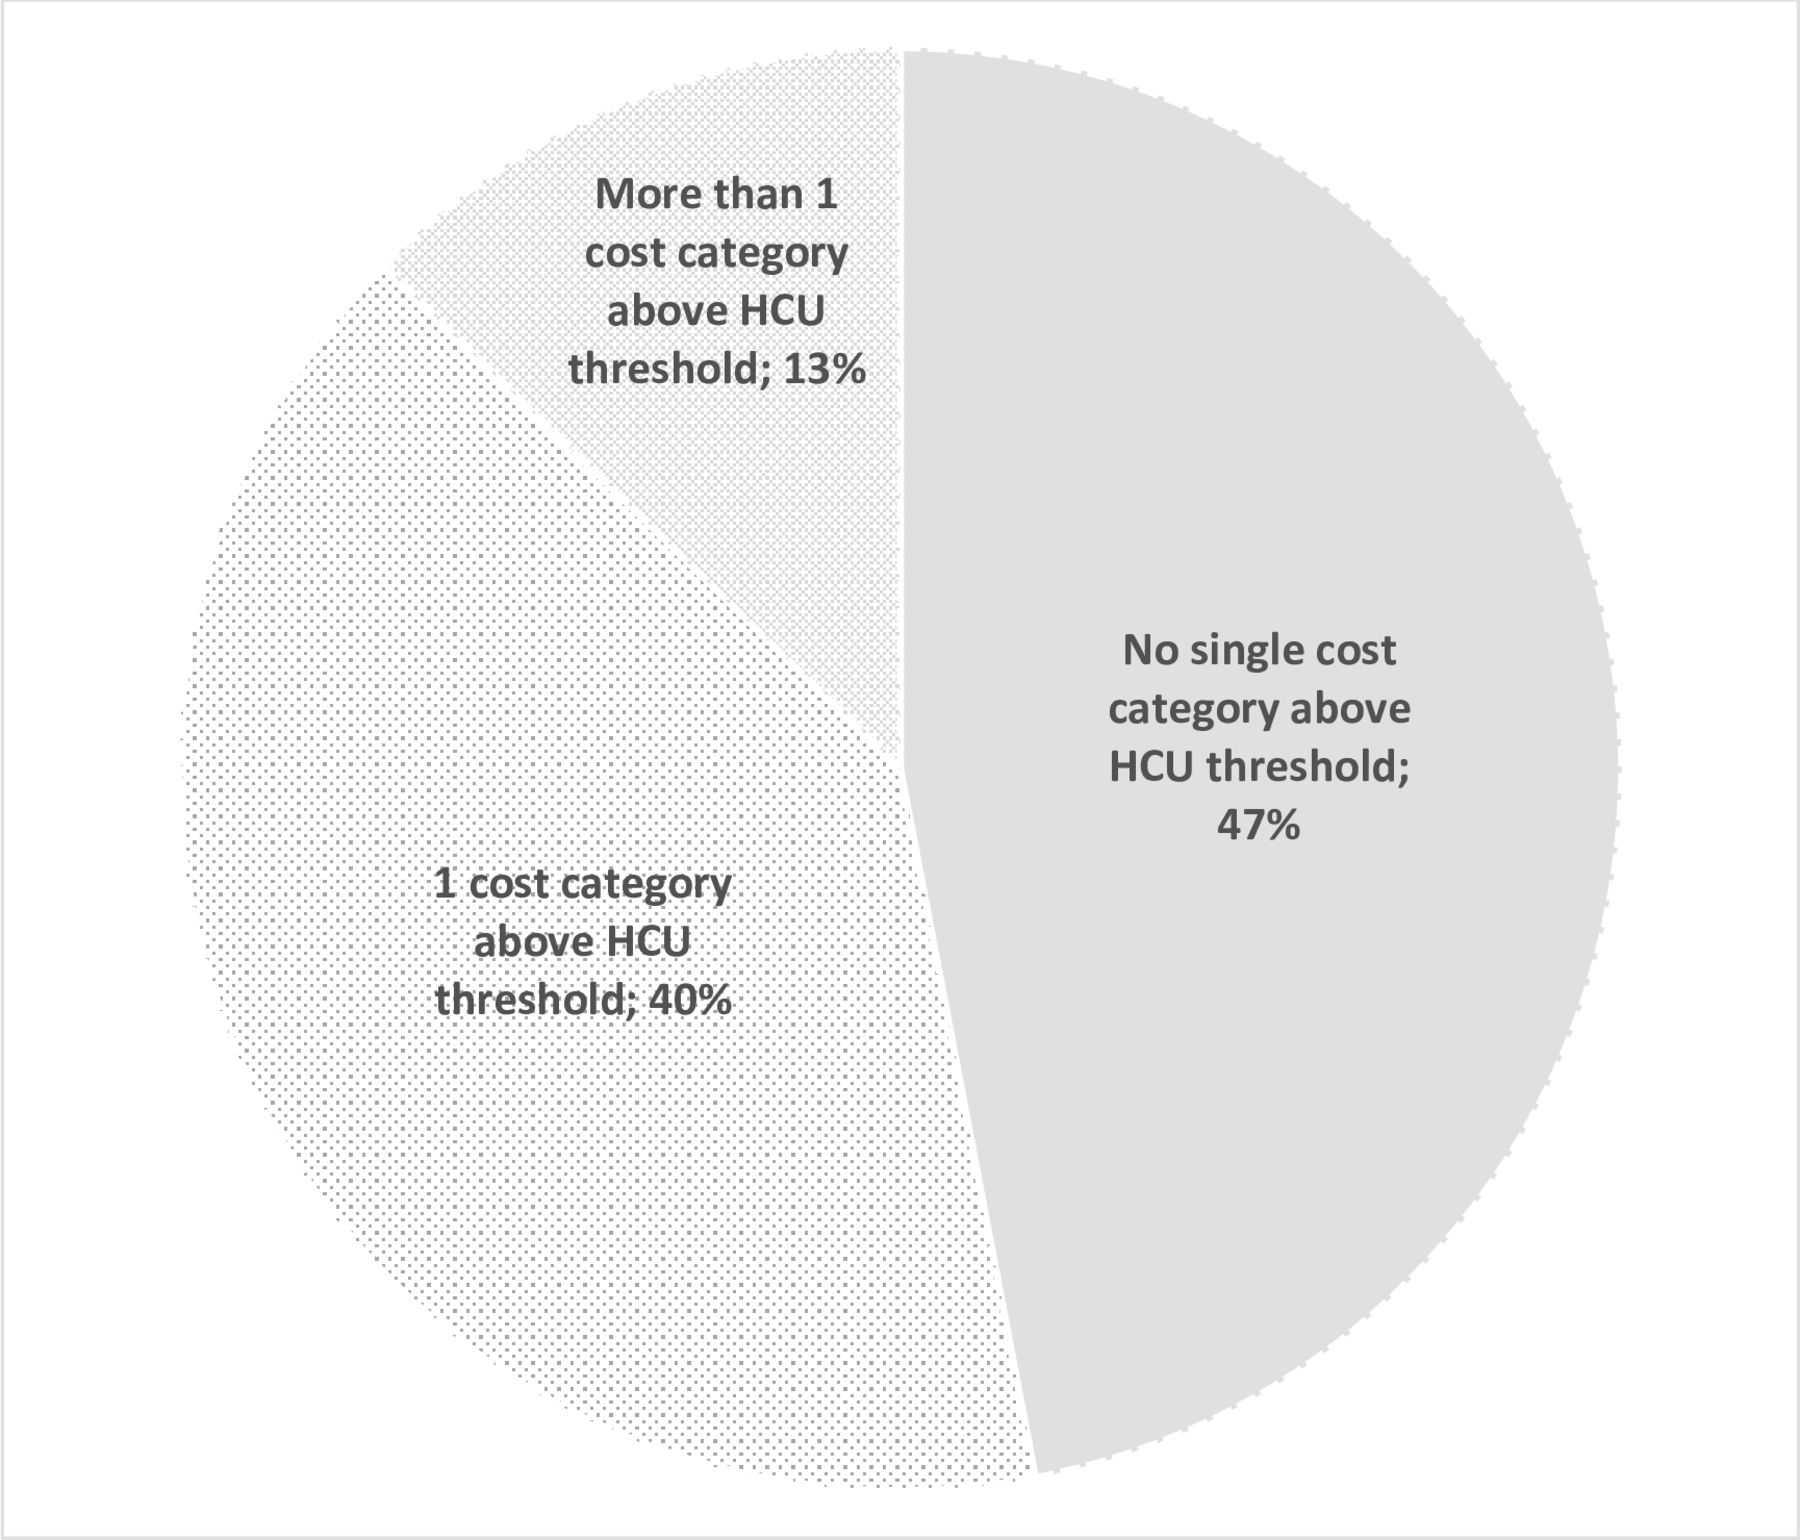
The 5% HCU annual threshold for this study was $10 192. As shown in figure 1, patients could become HCU through different combinations of incurred costs. Approximately 40% of the HCU became an HCU (ie, incurred at least $10 192 in total annual healthcare expenditures) due to a single cost category, predominantly hospital admissions (70.1%). For 13% of the HCUs, more than one cost category was above the threshold (eg, hospital admission and rehabilitation costs). Among the remaining 47%, no single cost category was sufficient to meet the expenditure threshold for HCU status: HCU status was achieved through expenditures in several cost categories. In this case, the most common contributing categories were physician compensation, drug benefits and hospitalisation.

Proportion of new high-cost users (HCUs) that made the HCU threshold due to various types of costs. The graph presents the proportion of senior HCU in the context of cost categories that reached the HCU threshold of $10 192. One cost category (eg, hospital costs) reached the HCU threshold among 40% of new HCUs (per cent of patient in top five categories: hospital (70.7%), cancer (8.1%), ODB (7.3%), LTC (5.1%), HC (3.3%)). More than one cost category (eg, hospital and physician costs) reached the HCU threshold among 13% of HCUs (per cent of patient in top five categories: hospital (95.1%), physician (35.5 %), rehab (27.8%), CCC (18.6%), HC (13.6%)). No single cost category reached the HCU threshold among 47% of new HCUs (per cent of patient in top five categories: physician (99.9%, mean $3022), ODB (99.6%, mean $2127), hospital (88.7%, mean $5611), laboratory (87.1%, mean $190), ED (70%, mean $654). CCC, complex continuing care; ED, emergency department; HC, home care; LTC, long-term care; ODB, Ontario Drug Benefit.
As many as 11.7% (n=20 501) of the HCU were not hospitalised during the incident year (online supplementary appendix 1). Their new HCU status was mainly due to a combination of physician compensation (99.8%), ODB (99.4%) and laboratory test costs (87.3%), home care (54.1%) and ED visits (45.3%). Of note, some of the patients within several cost categories had costs high enough for the patient to become an HCU. Examples include 72.3% of patients in long-term care, 63.4% of patients with cancer care and 19.1% of patients with drug costs.
Supplemental material
Dynamics of change in healthcare use and costs
Analysis of observed healthcare utilisation in the two cohorts identifies an upward trajectory in health services consumption among senior HCU. As shown in figure 2, compared with non-HCU, the HCU consumed more services in the preincident year across all care categories: physician encounters (mean per patient: 15.4 vs 10.1, aSD=0.55), home care visits (mean per patient: 7.7 vs 1.8; aSD=0.24), ED visits (mean per patient: 0.6 vs 0.3; aSD=0.26) and hospital admissions (mean per patient: 0.04 vs 0.02; aSD=0.08). This was followed by a dramatic increase in healthcare use among senior HCU during FY2013, while the service consumption among non-HCU remained relatively unchanged.

Dynamics of change in annual healthcare use, before (baseline) and during incident year, by HCU status and cost categories (mean per patient). The graph shows a dramatic increase in healthcare use among senior HCU during FY2013, while the service consumption among non-HCU remained relatively unchanged from the baseline year. FY2013, fiscal year 2013; HCU, high-cost user.
Similarly, the total public healthcare expenditures among senior HCU were higher in the preincident year compared with non-HCU (mean per patient: $4166 vs $2372, aSD=0.74), followed by a substantial spike during the incident year ($29 784 vs $2471; aSD=1.33) (figure 3). While the major drivers of total costs were analogous in the two cohorts in the year before (in descending order: drug benefits, physician costs, hospital admissions or home care), the top contributors in the HCU cohort changed during the incident year. With an annual mean of 1.07 of hospital admissions (mean TLOS: 8.8 (SD 14.8)) among senior HCU compared with a mean of 0.03 admissions (mean TLOS: 2.8 (SD 9.6)) for non-HCUs in FY2013, prolonged hospitalisations were the major driver of total healthcare expenditures ($13 558) in the incident year. These were followed by physician ($4214) and ODB costs ($2456). In categories such as rehabilitation, complex continuing care, dialysis and mental health admissions, the costs incurred by senior HCUs at baseline and non-HCUs across both years were approximating zero: these categories were almost exclusively associated with the HCU status. Little change in the list of major cost drivers and the trajectory of costs over time was noticeable among non-HCU seniors. More detail is provided in online supplementary appendices 2 and 3.

Dynamics of change in annual healthcare care expenditures before and after index year, by HCU status and cost categories (annual, mean per patient). total costs per patient (mean) among HCUs: $4166 (baseline year) and $29 784 (incident year). Total costs per patient (mean) among non-HCUs: $2372 (baseline year) and $2471 (incident year). HCU, high-cost user.
Incremental costs and healthcare use
Table 2 shows the magnitude of incremental healthcare use by senior HCU during the incident year adjusting for the preincident values and other covariates. Compared with the year before becoming an HCU, unplanned hospitalisations accounted for 74% of all incremental admissions at an additional mean of 0.77 hospitalisations per HCU (95% CI 0.77 to 0.78) annually. Similarly, specialist visits constituted 75% of the incremental physician encounters at an additional mean of 22.8 visits (95% CI 22.7 to 22.9), whereas personal support worker visits contributed the most to the incremental home care use at additional mean of 15.6 visits (95% CI 15.3 to 15.9) per HCU patient.
Incremental healthcare use associated with HCU status, by healthcare type
The total annual mean adjusted costs attributable to HCU status were $25 527 (95% CI $25 383 to $25 670) (table 3), with hospital admissions being by far the major contributor at an additional mean of $13 428 (95% CI $13 333 to $13 533) per HCU. Details of the regression analyses are provided in online supplementary appendices 4 and 5. Given the size of the senior incident HCU population (n=175 847), the estimated provincial budget impact of the senior incident HCU status was $4.5 billion (CAD). This accounts for approximately 9% of the 2013 total provincial healthcare expenditures ($51 billion).46
Incremental expenditures associated with HCU status, by cost component and total
Discussion
The study has examined a cohort of new senior HCU patients compared with matched non-HCUs focusing on the absolute and incremental comparative healthcare use and expenditures before and after HCU conversion. We determined that although senior HCUs were already on an upward trajectory during the year before HCU status, showing higher healthcare utilisation and costs in the preincident year, the HCU status was associated with a spike in healthcare expenditures. We found that seniors became HCU through incurring costs in various combinations, although half of the senior HCU could reach the HCU status by incurring costs from only one or two categories, mainly prolonged hospitalisation. Approximately 12% of HCUs had no hospitalisation in the incident year: they achieved HCU status by incurring costs largely on physician services and prescription medications. Compared with non-HCU, senior HCU incurred an additional $25 527 per patient in total incremental public healthcare expenditures and cost almost 1/10 of the provincial budget in the incident year. Hospitalisations, physician compensation and ODB were responsible for the highest incremental costs.
This study fills a current gap in the HCU economic literature, especially Canadian HCU studies where few of them have focused on seniors or used a comparative group of non-HCUs. Also, as opposed to cross-sectional studies that are common in the area of HCU research, we were able to capture the economic burden attributable to HCU status among senior Ontarians using longitudinal data. Our approach of the recycled predictions has allowed us to compare the healthcare use and costs between HCUs and a matched cohort of non-HCUs while taking account of the correlation between the prevalues and postvalues, managing excessive zero values by developing two-part models, and adjusting for confounding by including important sociodemographic and health status covariates in the models. Another option we considered was the difference-in-differences estimator.47 48 Frequently employed by economists to assess the impact of introducing a policy or a change in the system, its use is, however, conditional on two major assumptions that need to be met: parallel trends and no group variation at baseline. While the latter could be dealt with using statistical adjustment, the former assumes that trajectories in outcomes (ie, costs and use) between the groups are the same prior to the exposure (ie, HCU conversion). Because we only had access to 1 year of data prior to the incident year (ie, the baseline year) by design, it was not possible to determine the trajectories between the cohorts.
Consistent with nine studies of senior HCUs identified by Wammes et al, our results confirm the high burden of common conditions among senior HCUs, the important impact of inpatient care costs, the increasing role of home and long-term care in the HCU cost profile. Some studies also mention non-hospitalised senior HCUs without providing their detailed description.10 49 Our findings are, however, challenging to compare with these for several reasons. First, in addition to the incremental values, we provide a comprehensive assessment of costs and healthcare utilisation for a specific segment of the HCU population: senior incident cases. To our knowledge, no other studies have examined this specific patient population, especially in such detail.5 Second, as Wammes et a l show, the HCU threshold used in the USA and other countries (eg, Denmark and Germany) is often 10%, while Canadian studies commonly apply the 5% threshold.5 Third, the spectrum of cost categories included in analysis may vary between countries and even provinces in Canada. Prescription drug costs, for example, the source of one of the highest incremental values in our study, were not covered by the US Medicare program (which covers senior patients) until 2003, although the launch of a fully developed program was delayed until mid-2000s,50 51 limiting the comparability of earlier studies that relied only on Medicare payments.11 23 52 In this respect, our efforts to standardise cost analyses by using a costing methodology that allows obtaining patient-level expenditures from multiple sources in one standard way is a step towards higher comparability of future studies.
Strengths and limitations
Our study has several strengths. First, the study is population based, including all incident senior HCU in the province. Second, the study examines incident HCU, which provides important information on the driving factors for HCU status. Third, we included a comprehensive spectrum of the most important cost categories that contribute to total public healthcare expenditures in the province.
The study also has important limitations. The nature of methodology applied to calculate the costs was different across various cost categories. As opposed to the nominal costs per visit (eg, physician or home care) or prescription claim, some of the costs were estimations, or example, a provincial average cost per case of inpatient care weighted for resource intensity.34 However, when used for comparisons at a provincial level, these estimations are considered acceptable.34 Also, despite our comprehensive coverage of cost categories, some public healthcare expenditures are not accounted for. Examples include community services (eg, community services for elderly) and public health costs. In addition, a few of the cost categories included the analysis may not be captured in full. Most notably, we did not have access to the costs of outpatient intravenous chemotherapy, which can be costly.53 Also, long-term care residents pay a portion of the costs out of pocket.54 Despite these limitations, it is unlikely that the unaccounted costs for individual healthcare services amount to more than 5%–8% of total public expenditures on healthcare.10 18 At the same time, the true hospitalisation expenses may be underestimated as physician billings for inpatient services are currently captured by a separate cost category which makes our estimates of the hospital costs conservative. Further, different HCU thresholds may yield different estimations of the incremental costs. Although ours is the most commonly used HCU threshold in Canada,5 our findings are largely comparable to studies with the same threshold and the choice of cost categories. Finally, since our study by design focuses on incident senior HCUs, we did not examine other senior HCU population groups such as prevalent HCUs (ie, those who have been HCU both in FY2012 and FY2013) or those individuals who were HCUs in FY2012 but not in FY2013.
Despite these limitations, our findings have policy and research implications. There is currently no clear internationally accepted definition of the HCU.7 They are also referred to by many names (eg, heavy, frequent or high needs users) that are used interchangeably with HCU.7 However, our data show that frequent users of healthcare may not be synonymous with HCUs of healthcare and both need to be distinguished. One prolonged hospital stay, for example, can drive a senior patient to become an HCU. Although interventions have been introduced to either prevent or divert such hospitalisations, their success is unclear.7 Further efforts are needed to examine predictors at the prehospital level and to identify actionable cost drivers during admission.55 At the same time, more than 1/10 of senior HCUs had no hospital costs. The latter subset of HCUs requires further investigation. Reducing ODB expenditures by exploring pharmaceutical policy or pricing strategies (eg, generic drug tendering) stands out as a promising but challenging area to achieve potential cost reductions.56 Canada has recently made steps to alleviate the burden of drug costs by negotiating lower prices of generic and non-generic drugs with manufacturers.57 Although there may be room for further savings among generic drugs,58 these may be offset by the growing share of expensive biologics coupled with just a modest uptake of biosimilars.59 Finally, future cost analysis of senior HCUs could benefit from greater data granularity. Following a patient longitudinally by type of care received in the incident year and time of death, for example, it may be possible to more precisely identify the point of HCU conversion, differentiate between outpatient and inpatient costs that contribute to it, and allocate costs more with greater accuracy, including specific clinical conditions (eg, cognitive impairment among seniors) or conducting joint cost-survival modelling.60 61
Conclusion
Costs attributable to incident senior HCU status accounted for almost 1/10 of the provincial budget. Prolonged hospitalisations made a major contribution to the total incremental costs. However, categories such as physician billings, drug benefits and other, in various combinations, also were important. A subgroup of patients that became HCU without hospitalisation requires further investigation.
Supplemental material
Supplemental material
Supplemental material
Supplemental material
References
Footnotes
Contributors SM, J-ET, AH, JL, JMP, TG, LM and JRG conceptualised the study. SM, J-ET, AH, JL, JRG, LM, JMP, TG and PP contributed to its design. JMP, PP and TG were instrumental in creating datasets. PP provided assistance with data analysis. SM prepared the initial draft of the manuscript and revised it based on coauthors’ feedback: J-ET, AH, JL, JMP, TG, JRG, LM and PP provided comments to the initial draft, further revisions, read and approved the final manuscript. The responsibility of study implementation lies with the principal investigator (SM) that is supported and supervised primarily by J-ET.
Funding This work is supported by in-kind support from the Ontario Drug Policy Research Network (ODPRN) and by personnel awards from the Canadian Institutes of Health Research (CIHR) Drug Safety and Effectiveness Cross-Disciplinary Training (DSECT) Program, the Program for Assessment of Technology in Health (PATH), The Research Institute of St Joe’s Hamilton, St Joseph’s Healthcare Hamilton and an Ontario Graduate Scholarship (OGS). The work also is supported by ICES, an independent research institute funded by the Ontario Ministry of Health and Long-Term Care (MOHLTC). ODPRN is funded by grants from the Ontario MOHLTC and the Ontario Strategy for Patient-Orientated Research (SPOR) Support Unit, which is supported by CIHR and the Province of Ontario. No endorsement by ICES or the Ontario MOHLTC is intended or should be inferred. Parts of this material are based on data and information compiled and provided by the Canadian Institute for Health Information (CIHI).
Disclaimer The opinions, results and conclusions reported in this article are those of the authors and are independent from the funding sources. The analyses, conclusions, opinions and statements expressed herein are those of the authors and not necessarily those of CIHI.
Competing interests None declared.
Patient consent for publication Not required.
Ethics approval This study was approved by Hamilton Integrated Research Ethics Board (ID#1715 C).
Provenance and peer review Not commissioned; externally peer reviewed.
Data availability statement The dataset from this study is held securely in coded form at the Institute for Clinical Evaluative Sciences (ICES). While data sharing agreements prohibit ICES from making the dataset publicly available, access may be granted to those who meet prespecified criteria for confidential access, available at http://www.ices.on.ca/DAS. The full dataset creation plan is available from the authors on request. Analytic codes (in SAS) used to conduct the analysis are available as online supplementary material.