Article Text

Abstract
Objective According to several studies, liver enzymes levels are associated with fasting plasma glucose (FPG) levels. However, the association stratified by body mass index (BMI) remains to be elucidated, especially in Southern China. Therefore, the aim of this study was to investigate the correlation between liver enzymes levels and FPG levels stratified by BMI in Southern China.
Design Cross-sectional study.
Participants and setting 3056 individuals participated in real-time interviews and blood tests in Southern China. Participants were divided into three groups (underweight, normal weight and overweight or obesity) based on BMI cut-offs.
Main outcome measured Partial correlation analysis was performed to investigate the relationship between FPG levels and liver tests. Multivariate logistic regression analyses were applied to calculate the adjusted ORs for FPG levels based on liver enzymes levels.
Results There was no association between liver enzymes and FPG either in the underweight group or in the normal weight group; however, a significant correlation was observed in the overweight or obesity group (alanine transaminase (ALT), p<0.01; aspartate aminotransferase (AST), p<0.05). After adjusting for confounding factors, the highest tertiles of ALT still remained significantly positively related to FPG levels in the overweight or obesity group, with an OR of 2.205 (95% CI 1.442 to 3.371) for the 5.56≤FPG<7.00 mmol/L vs the FPG<5.56 mmol/L group and with an OR of 2.297 (95% CI 1.017 to 5.187) for the FPG≥7.00 mmol/L vs the FPG<5.56 mmol/L group, but this correlation was not found for AST.
Conclusions The association of liver enzymes levels with FPG levels differed based on different BMI cut-offs. ALT levels were significantly positively associated with FPG levels in the overweight or obesity group, but not in the other two groups; AST levels were not associated with FPG levels in any group.
- liver enzymes
- fasting plasma glucose
- Southern China
- cross-sectional study
This is an open access article distributed in accordance with the Creative Commons Attribution Non Commercial (CC BY-NC 4.0) license, which permits others to distribute, remix, adapt, build upon this work non-commercially, and license their derivative works on different terms, provided the original work is properly cited, appropriate credit is given, any changes made indicated, and the use is non-commercial. See: http://creativecommons.org/licenses/by-nc/4.0/.
Statistics from Altmetric.com
Strengths and limitations of this study
A large sample of subjects was enrolled in this survey.
To the best of our knowledge, this is the first study to explore the correlation between liver enzymes levels and fasting plasma glucose (FPG) levels stratified by body mass index among people who had not been diagnosed with diabetes before this survey in Southern China.
The present study was designed as a cross-sectional study; therefore, direct causation cannot be concluded from the results.
Supplementary information about γ-glutamyltransferase levels, imaging studies, cholesterol and triglycerides was not collected; therefore, it could not be determined whether these factors were associated with FPG. Additionally, some factors such as cholesterol and triglycerides levels could not be adjusted in the multivariate logistic regression analyses.
Introduction
Diabetes, a prevalent chronic disease, has emerged as a major public health concern due its increased prevalence in many countries, affecting approximately 382 million people worldwide.1 China, the largest developing country, also has a high incidence of diabetes. Recently, a survey revealed that more than 1 in 10 Chinese adults were affected by diabetes.2 Therefore, the early identification of individuals at high risk of diabetes is essential for decreasing the prevalence of diabetes.
The liver is the site of glycogen synthesis and gluconeogenesis, which together with the pancreas, muscle, adipose tissue and other organs, plays an important role in maintaining the stable level of blood glucose.3 4 Liver enzymes, the most common markers of liver function in the clinic, include alanine transaminase (ALT) and aspartate aminotransferase (AST).5–7 Related studies suggested that the elevation of liver enzymes levels was indicative of insulin sensitivity reduction, insulin resistance and type 2 diabetes development.8–10 Fasting plasma glucose (FPG) is the most commonly used index to monitor the occurrence of early type 2 diabetes, which is of great significance in the prevention of diabetes. Although previous studies have reported that liver enzymes levels were significantly associated with FPG levels,3 10 11 the evidence remained insufficient, because the reported results were inconsistent in terms of the population studied, such as populations from different regions and populations with different body mass indexes (BMIs). In addition, as we know, almost all related studies regarded BMI as only a covariate in the investigation of the relationship between liver enzymes levels and FPG levels in the general population, and few studies were conducted in Southern China. Therefore, the aim of this study was to determine the association of liver enzymes levels with FPG levels, stratified by BMI, among people who had not been diagnosed with diabetes before this survey, in Southern China. If elevated liver enzymes levels are significantly associated with an increase in FPG levels, there might be implications in terms of considering liver enzymes as effective molecular markers for the early detection of individuals at high risk of diabetes with different BMI cut-off points, and health policy makers can develop targeted interventions to prevent the early occurrence of type 2 diabetes according to different BMI cut-off points.
Materials and methods
Study population
This cross-sectional study was conducted in the Guangdong Province of China in 2014. Initially, 3726 healthy inhabitants who underwent a general health examination (mean age: 60.32 years, ≥18 years old) were recruited from local Community Health Service Agencies. All participants completed the survey, and the overall response rate was 100%.The health examination included recording of general characteristics, medical history, anthropometric parameters and laboratory tests. After excluding subjects (n=574) with a history of diabetes, hepatitis B and all other liver diseases and subjects (n=96) with missing or invalid data on FPG levels or liver related indexes, 3056 eligible participants were included in the final analysis (figure 1). In addition, age and sex were compared between the excluded participants and those included in the final analysis, respectively, and there were no significant differences (table was presented in online supplementary file 1). Based on the basis of data from this study, subjects were classified into three groups (underweight, normal weight and overweight or obesity) based on BMI cut-offs (BMI was calculated as weight in kilograms divided by height metres squared). Individuals with a BMI<18.5 kg/m2, 18.5–23.9 kg/m2 or ≥24 kg/m2 were categorised into the underweight group (n=141), the normal weight group (n=1788), and the overweight or obesity group (n=1127), respectively. Then, we stratified overweight and obese adults into three groups according to FPG levels: FPG<5.56 mmol/L, 5.56≤FPG<7.00 mmol/L and FPG≥7.00 mmol/L. Each individual received written information about the aim of the study. If he/she decided to participate, a written informed consent was obtained.
Supplemental material

Flowchart in the selection of study population. FPG, fasting plasma glucose.
General characteristics
Information on participants’ demographic characteristics (age, sex, marital status and education level), health-related characteristics (physical activity, current smoking, alcohol consumption and BMI) and medical history (diabetes, hepatitis B and all other liver diseases) was included in the questionnaire. Marital status was categorised as ‘single’, ‘married’ and ‘divorce or widowed’. Education level was divided into four categories (no school, primary school, middle school and high school or above). Physical activity was categorised as ‘every day’, ‘more than once a week’, ‘seldom’ and ‘never’. Smoking status was categorised as ‘non-smoker’, ‘smoker’ and ‘ex-smoker’. Alcohol consumption was divided into three categories, ‘regularly’, ‘seldom’ and ‘never’. Smokers were defined as those who smoked one or more cigarettes per day for at least 6 months. Regular alcohol consumers were defined as those who consumed alcohol on average more than once a week within the last year. Additionally, because very few subjects were included in some dummy variables categories of marital status, education level, physical activity, current smoking and alcohol consumption, unmarried and divorced or widowed were considered single; no school and primary school were merged as primary school or below; physical activity (yes) included those who exercised every day or more than once a week; physical activity (no) included those who seldom or never exercised; non-smokers and ex-smokers were combined into current smoking (no); and alcohol consumption (yes) included those who regularly and seldom consumed alcohol.
Anthropometric parameters and laboratory tests
Anthropometric parameters (height and weight) were measured by trained staffs, following a standardised protocol. The data were collected in replicate, and mean values were calculated in the study. After overnight fasting (at least 8 hours), venous blood samples from participants were obtained and analysed by a PPI automatic biochemical analyzer (Roche Company, Germany) for FPG, albumin (ALB), direct bilirubin, indirect bilirubin (IBIL), total bilirubin, ALT and AST levels.
Tertiles of liver enzymes levels
Liver enzymes levels were categorised into tertiles12 based on individual distributions in the overweight or obesity group. ALT: Q1<17 U/L, Q2=17–25 U/L, Q3≥25 U/L; AST: Q1<20 U/L, Q2=20–24 U/L, Q3≥24 U/L.
Procedures
All data were collected on the same day via face-to-face interviews, and blood tests were performed by either a physician or a nurse (the healthcare staff from the local Community Health Service Agencies). The interviewers received training to improve their interview skills and standardise the procedures of data collection. In addition, several supervisors were selected to verify the authenticity of the data.
Patient and public involvement
The role of study subjects in our survey was participants. They were not involved in the development of the research question and outcome measures, the recruitment of subjects and the conduct of the study. After completing this survey, we sent each participant a letter describing detailed results of this study.
Statistics analyses
All statistical analyses were performed with the Statistical Package for the Social Sciences (SPSS) V.21.0 (SPSS, Chicago, Illinois, USA). Data are presented as the mean±SD and frequencies (percentage). A one-way analysis of variance (ANOVA) was conducted to evaluate differences in age and BMI according to FPG levels, and to test mean levels of FPG based on the tertiles of ALT and AST in the overweight or obesity group. The χ2 test was used to compare the frequency of general characteristics (categorical variables) according to FPG levels in the overweight or obesity group. Partial correlation analysis was performed to investigate the relationship between BMI and related indexes among all participants, as shown in table 1, to determine the correlation between FPG levels and liver tests stratified by BMI, as shown in table 2. Multivariate logistic regression analyses were applied to calculate the adjusted ORs for FPG levels associated with liver enzymes levels in the overweight or obesity group (since there was no association between liver enzymes levels and FPG levels in underweight group and normal group, respectively, as shown in table 2, one-way ANOVA, χ2 test and multivariate logistic regression were not performed for these two groups).
Partial correlation analysis between BMI and related indexes (n=3056)
Partial correlation analysis between FPG levels and liver tests stratified by BMI (n=3056)
Results
Of 3056 subjects, 50.3% (1537/3056) were found to have abnormal FPG levels, 22.9% (699/3056) had 5.56≤FPG<7.00 mmol/L and 5.5% (167/3056) had FPG≥7.00 mmol/L. Of 1127 overweight and obese adults, 34.0% (383/1127) were found to have abnormal FPG levels, 27.5% (310/1156) had 5.56≤FPG<7.00 mmol/L and 6.5% (73/1127) had FPG≥7.00 mmol/L.
The partial correlation and one-way ANOVA
A total of 3056 adults were included in this study, comprising 141 (4.6%) individuals who were underweight, 1788 (58.5%) individuals with normal weight and 1127 (36.9%) individuals with overweight or obesity. The partial correlation coefficients between BMI and related indexes are shown in table 1. Every index was significantly correlated with BMI, except for ALB and IBIL. Compared with other indexes, FPG and ALT were more strongly correlated with BMI.
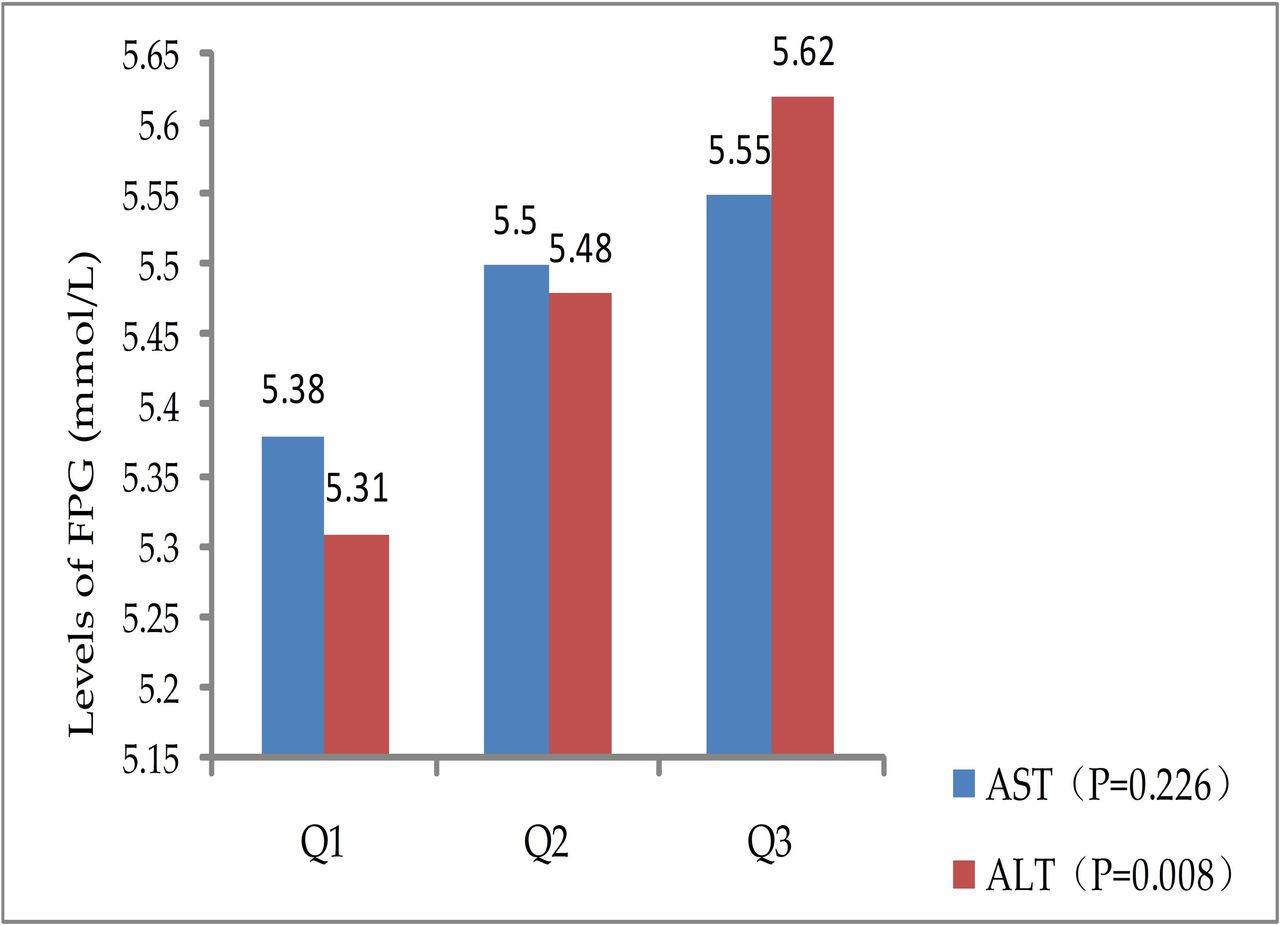
Further, a partial correlation analysis was conducted to the relationship between FPG levels and liver tests stratified by BMI (shown in table 2). Notably, AST and ALT levels were not associated with FPG levels in the underweight group and normal weight group, respectively, but a significant association was observed in the overweight or obesity group. Of the two liver enzymes, ALT (r=0.097, p<0.05) was more strongly correlated with FPG levels than AST (r=0.070, p<0.05). The mean FPG levels by baseline tertiles of AST and ALT levels among overweight and obese adults are shown in figure 2. The FPG levels were positively related to ALT levels (p<0.05), but not to AST levels (p>0.05).
Mean levels of FPG levels based on tertiles of AST and ALT levels in the overweight or obesity group. ALT, alanine transaminase; AST, aspartate aminotransferase; FPG, fasting plasma glucose.
Association of general characteristics with FPG
Mean age and BMI, and the frequency of sex, marital status, education level, physical activity, current smoking and alcohol consumption according to FPG levels in the overweight or obesity group are presented in table 3. The mean ages were 60.01±12.67, 63.34±12.06 and 64.75±13.88 in the FPG<5.56 mmol/L, 5.56≤FPG<7.00 mmol/L and FPG≥7.00 mmol/L groups, respectively. Compared with the FPG<5.56 mmol/L group, the 5.56≤FPG<7/00 mmol/L and FPG≥7.00 mmol/L groups displayed significantly higher ages (p<0.05). The mean BMIs were 26.37±2.18, 26.65±2.21 and 26.92±2.59 in the FPG<5.56 mmol/L, 5.56≤FPG<7/00 mmol/L and FPG≥7.00 mmol/L groups, respectively. Compared with the FPG<5.56 mmol/L group, the FPG≥7.00 mmol/L group displayed a significantly higher BMI (p<0.05), but this was not true for the 5.56≤FPG<7.00 mmol/L group (p>0.05).
General characteristics associated with FPG levels in the overweight or obesity group (n=1127)
Multivariate logistic regression analysis model
The adjusted ORs for FPG levels associated with liver enzymes levels in the overweight or obesity group are listed in table 4. Additionally, only those variables that were significantly correlated with FPG levels are presented in table 4. After adjusting for potential confounders (age, BMI and liver tests), the highest tertiles of ALT levels remained significantly positively correlated with FPG levels with an OR of 2.205 (95% CI 1.442 to 3.371) for 5.56≤FPG<7.00 mmol/L vs FPG<5.56 mmol/L and with an OR of 2.297 (95% CI 1.017 to 5.187) for FPG≥7.00 mmol/L vs FPG<5.56 mmol/L, but this correlation was not found for AST.
ORs for FPG elevation by liver enzymes levels in the overweight or obesity group (n=1127)
Age had an OR of 1.024 (95% CI 1.013 to 1.036) for 5.56≤FPG<7.00 mmol/L vs FPG<5.56 mmol/L and of 1.033 (95% CI 1.012 to 1.054) for FPG≥7.00 mmol/L vs FPG<5.56 mmol/L. However, ALB levels displayed an OR of 0.954 (95% CI 0.928 to 0.982) for FPG≥7.00 mmol/L vs FPG<5.56 mmol/L.
Discussion
Partial correlation analysis showed that AST and ALT levels were not associated with FPG levels in the underweight group and the normal weight group, but a significantly positive association of AST and ALT levels with FPG levels was observed in the overweight or obesity group (table 2). This positive association in the group of overweight or obese adults may be partly explained by the obesity-related diabetes. Fall and his colleagues found a causal effect of adiposity on ALT levels in a Mendelian randomisation analysis study13 , Mechanistically, increased intrahepatic fat content is bi-directionally associated with insulin resistance, which in turn can lead to increased glucose output from the liver.5 14 15
In the current study, mean levels of FPG are shown in figure 2 based on the baseline tertiles of AST and ALT levels in the overweight or obesity group. Our results revealed that the elevated FPG levels were related to the increased levels of liver enzymes, which is similar to the result of a recent study.16 Insulin resistance and reduced insulin sensitivity may be the key pathophysiological mechanism underlying this positive association between liver enzymes levels and FPG levels.8 9 An epidemiological study conducted with 10 800 middle-aged participants noted that elevated liver enzymes levels were closely related to insulin resistance.17 Bonnet et al found that liver enzymes activities, even within the normal range, can reduce hepatic insulin extraction among healthy men and women.9
In regard to the identification of liver injury, ALT is more specific than AST.18 For instance, Mainous et al, in the analysis of a nationally representative sample of the non-institutionalised US population, found that ALT levels, but not AST levels, were independently linked with undiagnosed diabetes (defined as FPG≥126 mg/dL) as well as impaired fasting glucose (defined as 100≤FPG≤125 mg/dL),19 which is consistent with our results in general. In our study, after adjusting for potential confounders (age, BMI and liver tests), ALT levels remained significantly positively correlated with FPG levels both for 5.56≤FPG<7.00 mmol/L vs FPG<5.56 mmol/Land FPG≥7.00 mmol/L vs FPG<5.56 mmol/L, but this correlation was not found for AST. An explanation may be that ALT predominantly exists in liver, whereas AST is found in the liver and also in cardiac and skeletal muscle, the brain and other organs. ALT is the most closely related one to liver fat content.20 Liver fat content, except under certain conditions,21 has been reported to be linked with insulin resistance. In addition, Xu et al clarified that the effect of AST levels on diabetes risk was partly due to ALT levels.22 In addition to ALT and AST, γ-glutamyltransferase (GGT) is also a liver enzyme. Currently, the association between GGT levels and FPG levels remains controversial. Recent literature has reported that a moderate elevation in GGT levels within the normal range was a strong risk predictor for the onset of diabetes,23 and GGT may be a better predictor of diabetes than ALT.24 However, Oka et al found that GGT was not associated with the progression to impaired glucose tolerance after adjustment for ALT,25 and a cohort study showed that nonalcoholic fatty liver disease (NAFLD) was associated with an increased risk of type 2 diabetes with a higher risk associated with ALT than with GGT.26 Unfortunately, our study did not collect GGT data, and in the future, we will address this limitation.
In a previous study, ALT levels were associated with FPG levels for FPG≥126 mg/dL vs FPG<100 mg /dL (OR: 1.16, 95% CI 1.00 to 1.35).27 In the present study, the highest tertiles of ALT levels were associated with a more than twofold increase in FPG levels (for 5.56≤FPG<7.00 mmol/L vs FPG<5.56 mmol/L) among overweight or obese individuals, independent of conventional risk factors. In depth, the highest tertiles of ALT levels were more significantly correlated with FPG levels for FPG≥7.00 mmol/L vs FPG<5.56 mmol/L (table 4), which was similar to the result of an early study.28 Yu et al reported that compared with normal ALT levels, the relative risk for the incidence of impaired fasting glucose (100≤FPG≤125 mg/dL) and diabetes (FPG≥126 mg/dL) based on the level of ALT was 3.09 for borderline elevated ALT levels and 1.59 for elevated ALT levels.28 NAFLD may play an important role in the relationship between ALT levels and FPG levels among overweight or obese individuals. It has been found that patients with NAFLD are at increased risk for developing type 2 diabetes. Liver fat content was inversely associated with hepatic, adipose tissue and muscle insulin sensitivity, which might contribute to the increased risk of type 2 diabetes.29 Additionally, NAFLD can result in an elevated ALT levels.26 The following mechanisms may also be regarded as the underlying causes of the association between elevated ALT levels and the increased risk of elevated FPG levels. (1) Elevated ALT levels reflected potential chronic inflammation and increased oxidative stress, and chronic inflammation and oxidative stress appeared to be involved in the pathogenesis of NAFLD,29 which may impair insulin signalling in the liver and other organ tissues;9 30 (2) Elevated ALT levels could reflect life-long hepatitis virus infection, which can result in diabetes;31 (3) Testosterone levels may be the mediator between ALT levels and the risk of diabetes. Researchers have revealed the role of low testosterone in diabetes,32 and that poor liver function may reduce testosterone production.33s
Our study was conducted in Community Health Service Agencies, in Guangdong Province of China, which may imply that the generalisability of our results is limited to this region. Additionally, participants with a history of diabetes, hepatitis B or other liver diseases were excluded from the study, so our results are not applicable to these subjects.
In addition to GGT not being included in this study, the limitations of the current study included the absence of imaging studies. Recent studies have noted that imaging studies will likely provide a new opportunity for investigating the association of the liver function with diabetic disease.34 35 Then, online supplementary information about the blood lipids, disease types and medication history of subjects was not collected. Hence, some factors such as cholesterol and triglyceride levels, could not be included as covariates in our multivariate logistic regression analyses. In addition, our study design was cross-sectional, and direct causation cannot be concluded from the results.
Conclusion
The association of liver enzymes levels with FPG levels differed based on a BMI cut-off. ALT levels were significantly positively associated with FPG levels in the overweight or obesity group, but not in the underweight group and normal weight groups; AST levels were not associated with FPG levels in any group. These findings have important clinical implications for health policy makers. Liver enzymes may serve as effective indexes for the early detection of individuals at high risk of diabetes on a BMI-dependent basis.
Acknowledgments
We gratefully acknowledge the staff of the local Community Health Service Agencies for their kind assistance in data collection and other people who assisted us throughout the study.
References
Footnotes
L-LH and D-HG contributed equally.
Contributors L-LH, Y-PJ and PW conducted the data analyses. L-LH and D-HG drafted the manuscript. D-HG, H-YX, S-TT and XXW finalised the manuscript with inputs from all authors. All authors contributed to the development of the study framework, interpretation of the results and revisions of successive drafts of the manuscript and approved the version submitted for publication.
Funding This study was supported by the Medical Scientific Research Foundation of Guangdong Province (C2015032) and the Medical Scientific and Technological Research Foundation of Guangdong Province (C2015019).
Competing interests None declared.
Patient consent for publication Obtained.
Ethics approval The protocol of this study was approved by the ethics committee of the Community Health Service Agencies of Liaobu town, Dongwan city, Guangdong province. The ethical code is 20130410.
Provenance and peer review Not commissioned; externally peer reviewed.
Data availability statement Data are available on reasonable request.