Article Text

Abstract
Purpose The Swedish National Diabetes Register (NDR) has developed a diabetes-specific questionnaire to collect information on individuals' management of their diabetes, collaboration with healthcare providers and the disease’s impact on daily life. Our main objective was to develop measures of well-being, abilities to manage diabetes and judgements of diabetes care, and to detect and quantify differences using the NDR questionnaire.
Design, setting and participants The questionnaire was analysed with using responses from 3689 participants with type 1 and 2 diabetes, randomly sampled from the NDR population, combined with register data on patient characteristics and cardiovascular and diabetes complication risk factors.
Methods We used item response theory to develop scales for measuring well-being, abilities to manage diabetes and judgements of diabetes care (scores). Test–retest reliability on the scale level was analysed with intraclass correlation. Associations between scores and risk factor levels were investigated with subgroup analyses and correlations.
Results We obtained scales with satisfactory measurement properties, covering patient reported outcome measures such as general well-being and being free of worries, and patient reported experience measure, for example, access and continuity in diabetes care. All scales had acceptable test–retest reliability and could detect differences between diabetes types, age, gender and treatment subgroups. In several aspects, for example, freedom of worries, type 1 patients report lower than type 2, and younger patients lower than older. Associations were found between some scores and glycated haemoglobin, but none with systolic blood pressure or low-density lipoprotein cholesterol. Clinicians report positive experience of using scores, visually presented, in the patient dialogue.
Conclusions The questionnaire measures and detects differences in patient well-being, abilities and judgements of diabetes care, and identifies areas for improvement. To further improve diabetes care, we conclude that patient-reported measures are important supplements to cardiovascular and diabetes complication risk factors, reflecting patient experiences of living with diabetes and diabetes care.
- Item Response Theory
- Patient Reported Outcomes Measures (prom)
- Patient Reported Experience Measures (prem)
- General Diabetes
This is an open access article distributed in accordance with the Creative Commons Attribution Non Commercial (CC BY-NC 4.0) license, which permits others to distribute, remix, adapt, build upon this work non-commercially, and license their derivative works on different terms, provided the original work is properly cited, appropriate credit is given, any changes made indicated, and the use is non-commercial. See: http://creativecommons.org/licenses/by-nc/4.0/.
Statistics from Altmetric.com
- Item Response Theory
- Patient Reported Outcomes Measures (prom)
- Patient Reported Experience Measures (prem)
- General Diabetes
Strengths and limitations of this study
This study uses a new patient reported outcome measures (PROM) and patient reported experience measure (PREM) questionnaire in a survey of individuals with diabetes in Sweden.
The questionnaire covered aspects identified as important by diabetes patients in Sweden, an improvement over existing questionnaires.
The questionnaire survey was combined with registry data on cardiovascular and diabetes complication risk factor levels, deterministically linked at the individual respondent level.
We developed scales to obtain PROM and PREM from individuals with diabetes, using a large representative sample of 3689 individuals from the Swedish diabetes population.
The questionnaire is developed in a Swedish clinical setting, however currently being used only in Sweden is a limitation in international comparability.
Introduction
Diabetes mellitus (DM) is a chronic disease with significant impact on daily life. Individuals with diabetes must be engaged in their disease and its treatment. A reasonable ambition is an as normal a life as possible, while minimising the risk of diabetes complications. Another important ambition, of decision makers, is to spend healthcare resources fairly and effectively. These ambitions may be in conflict, making trade-offs necessary.1–4 Future consequences like complications and costs need to be considered, but these are associated with uncertainty, and some costs fall on others than the individual with diabetes, resulting in a complex evaluation, with a wider perspective than the individual’s.
Diabetes care is commonly evaluated by monitoring levels of cardiovascular and diabetes complication risk factors, such as glycated haemoglobin level (HbA1c) (a measurement of blood glucose control over the last 8–12 weeks), systolic blood pressure (SBP) and low-density lipoprotein cholesterol (LDL), to keep them within defined intervals.5 6 This provides important information about risk of future complications and costs, but not about other relevant aspects of diabetes care like well-being and individual preferences. Patient-reported outcome measures (PROM) are standardised, validated questionnaires that are completed by patients to mirror their perception of their health status, perceived level of impairment, disability and health-related quality of life. Patient-reported experience measures (PREM) are patients' judgements of their experience of diabetes care. PROM and PREM are important determinants of health-related quality of life and patient preferences, thus key complements to the risk factors.7 The ability to manage diabetes is fundamental, as is the capacity for activities of daily living and the absence of significant limitations. PREM provide indicators of the interaction between a patient and diabetes care, and healthcare providers can use PREM to determine, for example, how well they and their patients are sharing information. Poor sharing of information may give rise to an agency problem, namely that the physician does not act as a perfect agent for the patient but more as an agent for the healthcare provider, with risk of conflicting interests.8 9 In addition, patients who are not fully informed tend to rely on their own experience rather than on their physician’s advice.10 If information is shared more effectively, patients would be likelier to follow advice and manage their diabetes better. Thus, PROM, PREM and risk factors are all relevant, both from a person-centred perspective and from the perspective of the decision maker.
The Swedish National Diabetes Register (NDR) is a tool for evaluating and improving diabetes care, and the register has become an essential part of diabetes care.5 6 In implementing the use of PROM and PREM, the register initially developed a disease-specific questionnaire measuring patients' abilities and judgements of their experience of diabetes care, able to detect changes over time and differences between patient subgroups.7 In that study, PROM, PREM and diabetes complication risk factors (HbA1c, SBP and LDL) were used to identify groups of patients for whom improvement were needed, and it showed that PROM, PREM and risk factors all provided important information to decision makers.
The first questionnaire was developed however, based on clinical expertise rather than the perspective of the patient, a drawback when encouraging person-centred care. Therefore, NDR took the next step and developed a new questionnaire with a person-centred perspective.11 Qualitative interviews with patients were used to develop items that capture the daily impact of living with diabetes, phrased in accordance with their own words. The items addressed well-being, abilities and experience of diabetes care. Both content, face validity and reliability have been successfully evaluated.
Objective
Our primary objective was to develop item response theory (IRT) scale models so that patient well-being, abilities to manage diabetes and judgements of their experience with diabetes care can be measured and differences between patient subgroups be detected and quantified. Our secondary objectives were to describe our sample in terms of these scales, and cardiovascular and diabetes complication risk factors, and explore the relationships between these.
Methods
In the present work, item response theory (IRT)12 13 was used to develop PROM and PREM scales for the new questionnaire and review their measurement properties. Scales successfully reviewed using IRT have several advantages. They allow estimation of latent constructs (eg, an ability) that cannot be directly observed, they reduce multidimensional sets of items into single estimates of the latent constructs, they give an indication of the precision of the estimates and these are more robust to missing responses than using the actual responses to the items. Further, they allow items and item response levels to have different difficulties, and assessing changes using the latent constructs can give more accurate estimates of change than using raw test scores.12 13
Patient involvement
The new questionnaire was based on qualitative patient interviews, expert reviews and cognitive interviews to ensure content validity and face validity, along with a pilot survey for evaluation of reliability, as described in detail in previous studies.11 14
Survey design
In January 2015, the questionnaire was sent out in a pilot survey of 800 individuals with DM type 1 (DMT1) and 799 with DM type 2 (DMT2), in the region of Västra Götaland, randomly selected from the NDR based on the inclusion criteria of 18–80 years old and at least one HbA1c registered the last 12 months. The first 170 responders of each DM type were sent a retest questionnaire 2 weeks later.11 The retest questionnaire had two additional questions, Question 34, asking Compared with the last time I filled in this questionnaire, my experience of how I feel and how my diabetes is: Very much better, Much better, A little better, No change, A little worse, Much worse, Very much worse, and Question 35, asking Compared with the last time I filled in this questionnaire, my experience of the support I get from diabetes care is: (same response levels). We did a preliminary IRT analysis of the responses from the pilot survey to identify any necessary changes to the questionnaire before conducting a larger survey.
In November 2015, we conducted a large survey of 2485 individuals with DMT1 and 2491 with DMT2 randomly selected from the NDR and living anywhere in Sweden except the region of Västra Götaland to avoid respondent burden. The same inclusion criteria were used as in the pilot survey. A reminder was sent to non-responders after 30 days. A final IRT review was carried out using responses from both surveys combined.
Item response theory
IRT was used for estimating underlying values of the PROM and PREM,12 13 namely the respondents' well-being, abilities and judgements of their experience of diabetes care. Items were grouped into IRT scales, and both items and IRT scales were examined to ensure that they had satisfactory measurement properties using a methodological approach that the NDR has previously used.7 The items were grouped into seven initial scales according to the seven dimensions of the questionnaire (online supplementary appendix). In order to analyse item and scale properties, we reviewed scales common to both diabetes types, by pooling data from patients with DMT1 and DMT2. We also reviewed diabetes-type specific scales, with data from each type separately.
Supplemental material
The definition and review of each scale, fitting a scale model, and review of its fit was undertaken according to a number of steps until a final set of scales was obtained. First, each scale was reviewed with regard to unidimensionality, local dependency and monotonicity using non-parametric IRT15: scalability coefficients were checked to be positive and ≤1, item scalability coefficients were checked to be >0.3 and we used the test scalability coefficient to judge the strength of a scale (≥0.5: strong; 0.4–0.5: moderate). We checked monotonicity by looking for violations of manifest monotonicity, and graphs of item step response functions were checked to be non-decreasing. Parallel factor analysis was used to detect presence of more than one factor,16 17 and when detected, factor analysis was used to identify items belonging to another factor.
We then employed parametric IRT using a graded response model (GRM).18 Item fit was evaluated with S − X2,19 and by comparing probabilities of endorsing an item under its scale model to the observed proportions, since the risk of wrongly flagging items for misfit increases with the number of observations, especially in scales with few items.20 Overall model fit was evaluated using the root mean square error of approximation (RMSEA) index based on the M2 statistic.21 Hooper et al present a review of various rules of thumb for the magnitude of RMSEA,22 and Milfont and Fischer present similar figures.23 We adapted this by accepting a point estimate of RMSEA ≤0.10 as a fair fit. Differential item functioning (DIF) occurs if items are not equivalent in meaning to different groups of respondents.13 We examined DIF with regards to diabetes type, age group (above or below the median) and gender. Age distribution differs between DMT1 and DMT2, and in order to determine whether any DIF attributed to diabetes type might actually be due to age, we stratified the analysis of DIF with age strata 45–54, 55–64 and 65–74. Patients who were not in any of these strata were excluded from the age-stratified DIF analysis. We fitted a common model and group-specific models, with regards to the group variable under study, and estimated IRT scores using both the common and group-specific scale model. We then examined whether any DIF had meaningful impact,13 16 by studying the magnitude of differences and visual inspection of graphs of the differences. Finally, we used the generalised partial credit model as an alternative to the GRM scale model to check whether the model choice influenced the results.24
IRT scores
IRT scores were estimated using empirical Bayes,24 and they were converted into scales ranging from 0 (least desirable) to 100 (most desirable). Test–-retest reliability on the scale level was analysed using intra-class correlation (ICC),25 using the rule that ICC <0.40 was poor retest-reliability, 0.40–0.59 was fair, 0.60–0.74 was good and >0.74 was excellent.26 Test–-retest analyses of PROM scales were based on respondents reporting no change in Question 34, and analyses of PREM scales were based on respondents reporting no change to Question 35. A wider selection of respondents, reporting small improvement, no change or small worsening were used in sensitivity analyses.
Summary statistics were used to describe the DMT1 and DMT2 populations, both overall and broken down into subgroups by gender, age (by median age) and duration of diabetes (by median duration). Histograms of selected scales are presented as examples. In DMT2, we also described diabetes treatment groups—diet only, oral medication and insulin (alone or in combination).
We defined shortfall as the difference between an individual’s IRT score and the highest possible score (100), that is, a maximum score corresponds to a zero shortfall. We used the mean shortfall as a measure of the level of problem reported on a scale.
Student’s t-tests were used for testing differences between diabetes types and between subgroups, and p values <0.001 were flagged as associations. Due to the different age distributions in DMT1 and DMT2, we also compared the types in the age strata of 45–54, 55–64 and 65–74.
In an analysis of ad hoc response levels,7 we tested whether IRT scores below the 10th percentile were associated with deviations in risk factors, compared with the overall sample. Empirical distribution functions of a risk factor differing from the overall sample with a p value<0.001 (Kolmogorov-Smirnoff test), were flagged as an association. We also tested whether risk factor levels (HbA1c, SBP and LDL) above the 90th percentile were associated with deviations in IRT scores. Finally, we examined individuals with HbA1c below the 10th percentile. In addition, correlations (Spearman’s rho) were used to identify relationships between risk factors and IRT scores.
Observations with missing values were excluded on a per variable basis. We used the R software,27 with the Mokken,15 Latent Trait Model (LTM)24 and Psych17 packages and our own R code, and IRT Pro.28
Material
In the pilot survey, 474 individuals with DMT1 (response rate 59%) and 483 with DMT2 (60%) responded. The retest questionnaire was returned by 117 individuals with DMT1, 126 individuals with DMT2 (69% and 74%, respectively). The retest question responses are presented in online supplementary table S1. In the large survey, 1375 (55%) individuals with DMT1 and 1357 (54%) with DMT2 responded.
Supplemental material
The final dataset for the IRT analysis, both surveys combined, comprised 1849 individuals with DMT1, 1840 with DMT2 (table 1). Responders were similar to non-responders, except in DMT1, where the mean age and proportion men were slightly lower among non-responders (online supplementary table S2). The data set was a representative sample of the population in the NDR in 2015, which has mean age 46.3, diabetes duration 23.9 years, 56% men, HbA1c 62.6 mmol/mol, SBP 127.3 mm Hg, diastolic blood pressure 73.7 mm Hg, body mass index 26.1 kg/m2, cholesterol 4.61 mmol/L and LDL 2.57 mmol/L in DMT1 (68.1 years, 10.0 years, 57%, 54.1 mmol/mol, 134.6 mm Hg, 77.2 mm Hg, 30.2 kg/m2, 4.57 mmol/L and 2.63 mmol/L in DMT2) (data on file), and given the 90% coverage rate of NDR, it was deemed representative of the Swedish diabetes population.
Patient characteristics in the dataset for the item response theory analysis
Results
IRT scale review
In the review, some scales showed presence of multiple factors and had to be broken down into subscales. The final scales General Well-being (GenW), Mood and Energy (MoE), Free of Worries (FreW), Manage your Diabetes (ManD), Diet and Exercise (DiEx), Not Limited by Diabetes (NLD), Not Limited by Blood Sugar (NLBS), Support from Others (SuO), Support from Diabetes Care (SuDC), Access to Diabetes Care (AcDC), Continuity in Diabetes Care (CoDC) and Medical Devices and Medical Treatment (MDMT) (table 2), showed no signs of local dependency or non-monotonicity, and furthermore, all were strong, except DiEx and CoDC, which were moderate.
Final PROM and PREM scales
For some items, the item response category characteristic curves indicated that response levels 3 and 4 were difficult to separate, and these were combined into a single response level (table 2).
The scales ManD and NLBS showed DIF with regards to diabetes type, and required separate scale models for each diabetes type. The scale MDMT showed some indication of DIF due to diabetes type. As we proceeded with age-stratified DIF analysis, this was seen only in the oldest stratum (65-74), nevertheless strong enough to require separate models. The ability to compare age groups and diabetes types was deemed important enough, however, to accept minor measurement errors due to DIF (see Discussion). Using the generalised partial credits model as an alternative scale model produced results nearly identical to the GRM. The overall model fit was adequate for all scales.
The review found all final scales to be satisfactory (table 2); See also supplementary material including online supplementary figure S1.
Test–retest reliability
Test–retest reliability based on respondents reporting no change was good or excellent for most of the final scales, and fair for NLBS and CoDC (online supplementary table S3). In the sensitivity analyses also including respondents reporting small improvement or small worsening, the results were virtually identical but NLBS and CoDC improved from fair to good.
IRT scores
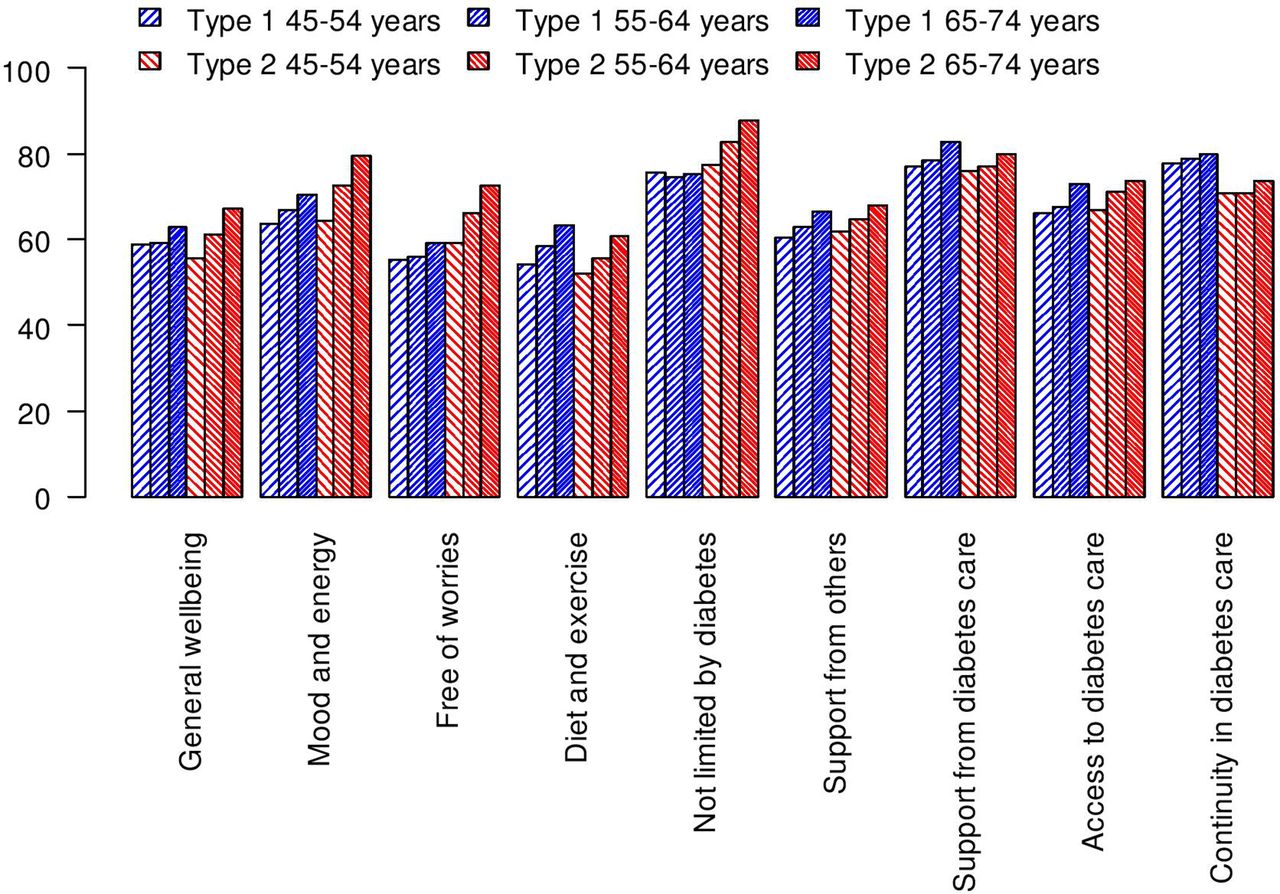
Table 3 presents descriptive statistics on the IRT scores. Our sample includes respondents at the maximum level on every scale. Responses at the minimum level were seen in every scale except SuO in DMT1 and MDMT in DMT2. The distribution of MoE differed between the diabetes types (figure 1). Both diabetes types had many responses at the maximum, but more so in the case of DMT2. After stratifying by age, DMT1 respondents reported lower MoE, FreW and NLD scores than DMT2 respondents in the age strata 55–64 and 65–74 (figure 2). DMT1 respondents reported higher CoDC scores than DMT2 respondents in the same strata. The greatest mean IRT score shortfall in DMT1 was in FreW and the least mean shortfall was in CoDC (table 3). The responses in FreW were roughly symmetrical around the scale midpoint, and a high percentage for CoDC was at the maximum value (figure 3).

Mood and energy in type 1 and type 2 diabetes. Histogram of IRT scores.

Mean IRT scores by age stratum in type 1 and type 2 diabetes.

Free of Worries and Continuity in diabetes care in type 1 diabetes. Histogram of IRT scores.
Item response theory IRT scores in type 1 and 2 diabetes, mean (SD), n overall and mean by gender
Older DMT1 respondents, broken down both by median and by age strata, reported higher MoE, FreW, DiEx, SuDC and AcDC scores than younger patients (figure 2), and also higher ManD and MDMT scores. Men reported higher GenW, MoE, FreW, ManD, NLBS and SuDC scores than women. However, women reported higher CoDC scores than men (table 3). MoE, FreW and ManD and MDMT scores increased along with diabetes duration.
The greatest mean shortfall among DMT2 respondents was seen in DiEx for which the responses were mainly in the mid-upper scale (figure 4). The least mean shortfall among DMT2 respondents was for NLD for which most responses were at the maximum value.

Diet and exercise and not limited by diabetes in type 2 diabetes. Histogram of IRT scores.
Scores for GenW, MoE, FreW, DiEx and NLD were higher among older than younger DMT2 respondents (figure 2), as was the case for ManD. Men scored higher for GenW than women (table 3). Individuals who were being treated with diet only or oral medication reported higher MoE, FreW, NLD and NLBS scores than individuals receiving insulin treatment (figure 5). ManD and DiEx scores were higher among respondents who were treated with diet only than in respondents with oral medication or insulin.

Mean IRT scores by treatment in type 2 diabetes.
The strongest correlations between pairs of IRT scores were 0.7 between SuDC and AcDC in DMT2, and around 0.6, for example, between MoE, FreW and ManD in DMT1 and DMT2 (online supplementary table S4).
Risk factors and IRT scores
HbA1c, SBP and LDL-cholesterol (LDL) consistently showed low correlations with each other as well as with IRT scores (online supplementary table S4). The strongest of these low correlations were between HbA1c and FreW (−0.25) in DMT2 and between HbA1c and ManD (−0.23) in DMT1.
Our analysis of response levels examined groups with IRT scores below the 10th percentile, to determine whether their risk factors differed from their diabetes type overall (table 4A). We also looked at groups with risk factor levels above the 90th percentile, to determine whether their IRT scores differed from their diabetes type overall (table 4B). In DMT1, the group with low ManD scores was associated with higher HbA1c levels than DMT1 overall, and vice versa. In DMT2, the groups with low scores in MoE, FreW, ManD, NLD and NLBS, respectively, were all associated with higher HbA1c levels than DMT2 overall, and vice versa. DMT2 with low MDMT scores had higher HbA1c levels than DMT2 overall. We detected no associations between SBP and LDL, and any of the IRT scores.
Ad hoc response level analysis*
Finally, we looked at the group with HbA1c levels below the 10th percentile (table 4A). In DMT1, the group with low HbA1c had higher ManD and DiEx scores than DMT1 overall. In DMT2, the group with low HbA1c levels had higher ManD, SuDC and MDMT than DMT2 overall.
Discussion
We set out to develop scales for measuring patient well-being, abilities to manage diabetes and judgements of experience of diabetes care, using IRT applied to a newly developed diabetes specific questionnaire covering dimensions important to the individual with diabetes.11 14 After breaking down some scales into subscales, and recoding response levels for some items, we obtained a set of final scales with acceptable measurement properties in a large representative group of DMT1 and DMT2 patients.
We obtained common scales for DMT1 and DMT2 in most cases, making comparisons between these groups possible. However the three scales ManD, NLBS and MDMT needed to be diabetes type specific, and therefore we cannot compare DMT1 with DMT2 on these scales. Clinically this was not surprising given the differences between DMT1 and DMT2 in aspects measured on these three scales. We checked the influence of the choice of scale model using the generalised partial credit model instead of the GRM, and we obtained almost identical scores with the two models. This was consistent with previous findings that these two scale models often produce nearly identical results.16 29
Strength and limitations of this study
There are both strengths and limitations in this study. Although our scales contain relatively few items, we found good test-retest reliability on the scale level. Reliability has previously been deemed acceptable on the item level.11 For the intended use, for longitudinal evaluations and as a measurement tool for quality improvement, test–retest–reliability is an essential property of a scale: ensuring stable scores in the absence of change. Future research will address responsiveness to change (eg, change in diabetes treatment or care). We obtained 12 final scales, but the questionnaire may be regarded as two combined, one for patient well-being and abilities (PROM questionnaire with eight scales) and one for judgements of diabetes care (PREM questionnaire with four scales). The many dimensions may also indicate that many considerations are important to an individual with diabetes, for example, sleep and general well-being, worries, limitations in life, access to and support from diabetes care, etc (table 2; online supplementary appendix).
Although there already were other diabetes questionnaires, no existing questionnaire covered all the aspects that were identified as important by diabetes patients in Sweden.11 14 Thus, while other questionnaires have a narrower scope, a broader scope was needed in the ongoing work of improving diabetes care,11 14 and so NDR developed a new diabetes questionnaire. The NDR questionnaire is developed in a Swedish clinical setting, a strength for the intended use to evaluate but also be a communication tool in clinical diabetes care. While relevant for its purpose, currently being used only in Sweden also adds limitation in international comparability. It is also a limitation, as with any new questionnaire, that the results cannot be directly compared with those from other questionnaires. Our response rate ranged from 54% to 74% in different phases. Our scales speak only of our responders, an obvious but important limitation, and we cannot guess at the direction and size of its bias in our IRT scores.
In some scales, such as CoDC in DMT1 (figure 3), responses were clustered around the maximum value. This may indicate lower sensitivity to changes at the upper end. This problem is a minor one given that we are more interested in changes at the lower end of the scale, among individuals with low scores, for example, who need to have better continuity in care. There were some indications of differential item functioning due to age in MoE, and due to diabetes type in SuDC. Nevertheless we regarded the ability to compare groups as more important than avoiding minor bias and accepted these scales. But comparisons with these two scales across very different groups should be made with caution.
Findings and potential implications
We found a number of differences between IRT scores in DMT1 and DMT2, as well as in different subgroups. Individuals with DMT1 had lower scores on FreW and MoE than individuals with DMT2, a clinically important but perhaps unexpected finding.30 For both diabetes types, the situation appears to improve with age. Women have generally lower scores on GenW than men regardless of diabetes type, which is a big challenge for diabetes care. In DMT2, we noted that several scores were lower with stepped up treatment, that is, oral treatment and insulin. This finding seems reasonable since it could reflect a more poorly controlled form of diabetes, or that insulin treatment requires injections and blood sugar testing several times a day, and also adds the risk of hypoglycaemia.
SuDC and AcDC were correlated in both diabetes types, suggesting that being able to see the diabetes nurse or the physician is closely related to obtaining needed support. MoE was correlated with GenW, ManD and FreW in both diabetes types. Being free of worries and being capable of managing diabetes are presumably important underlying factors of mood and energy and general well-being or vice versa. The two scales for barriers, NLD and NLBS were also correlated in both diabetes types. These correlations between IRT scores all appear to be plausible, given their concepts are related. The correlations were not strong enough, however, to make any of the scales redundant. We wanted our questionnaire to have a broad scope, and seemingly we did not overshoot the mark.
We found weak negative correlations between HbA1c and many of the IRT scores. Occasional low IRT scores were associated with high HbA1c levels, while the relationship held true to some extent in the reverse direction. However, these associations do not show any consistent pattern. Furthermore, there were virtually no such associations between SBP, LDL and any IRT score. These weak relationships between important risk factors and IRT scores confirm our previous finding that risk factors do not alone provide sufficient information about the situation of an individual with diabetes.7
To summarise, we can now measure 12 PROM and PREM dimensions of patient well-being, abilities and judgements of diabetes care, and we can see how this supplements routine monitoring of cardiovascular and diabetes complication risk factors. Visual presentation of the scales in the patient meeting gives immediate information on aspects where the patient is doing well, and what might be lacking. This is presented along with curves of blood glucose. Clinicians report that this task is similar to looking at and interpreting a echocardiogram chart. Thus, the questionnaire is also useful in the day-to-day clinical practice to detect individual needs and promote collaboration with patients so as to optimise health and quality of life. Differences between DMT1 and DMT2, as well as between subgroups of respondents, emerged. The NDR has hereby an improved tool for analysing the situation of individuals with diabetes and for characterising the outcomes of interventions and improvement programmes. It will also permit research on for example, how the scales predict future events and costs.
Conclusions
The new questionnaire with items phrased in accordance with the patients' own words, can collect data and estimate patient-reported outcome and experience measures in the form of well-being, abilities and judgements of diabetes care. This amends the previous lack of patient-centred perspective within the evaluation of diabetes care in the Swedish National Diabetes Register, and we have taken a new step towards a broader evaluation of diabetes care and a person-centred care. The measured well-being, abilities and judgements of diabetes care appear to comprise a useful supplement to cardiovascular and diabetes complication risk factors, and they reflect several aspects of a patient experienced living with diabetes and diabetes care, and we can identify where these aspects can be improved.
Acknowledgments
The authors wish to thank Janeth Leksell (Dalarna University, Falun, Sweden, Uppsala University, Uppsala, Sweden) and Unn-Britt Johansson (Sophiahemmet University, Stockholm, Sweden and Karolinska Institutet, Stockholm, Sweden), Ebba Linder, Henrik Milefors, Mervete Miftaraj and Ann-Marie Svensson (National Diabetes Register), for their valuable support and for facilitating various parts of the study, not to mention the participants with diabetes.
References
Footnotes
Patient consent for publication Not required.
Contributors SB participated in the study design, carried out the statistical programming and the statistical analyses, participated in the interpretation of the results, developed the manuscript and reviewed and approved the final version of the manuscript. KE-O participated in the study design and provided diabetes perspective and reports of clinical experience with the questionnaire, participated in the interpretation of the results, contributed to the manuscript and reviewed and approved the final version of the manuscript. BP participated in the study design and provided statistical expertise, participated in the interpretation of the results, contributed to the manuscript and reviewed and approved the final version of the manuscript. MSE participated in the study design and provided patient-reported outcome measures and patient-reported experience measure expertise, participated in the interpretation of the results, contributed to the manuscript and reviewed and approved the final version of the manuscript. U-GG supervised and participated in the study design and provided the health economics perspective, participated in the interpretation of the results, contributed to the manuscript and reviewed and approved the final version of the manuscript. SG supervised and participated in the study design and provided the diabetes perspective, participated in the interpretation of the results, contributed to the manuscript and reviewed and approved the final version of the manuscript.
Funding The study was sponsored by unrestricted grants from AstraZeneca, Novo Nordisk and the Swedish Diabetes Foundation. None of the sponsors had any influence on the decision to publish, nor on the design of the study and collection, analysis and interpretation of data or in writing the manuscript.
Competing interests None declared.
Ethics approval The Regional Ethical Review Board in Gothenburg, Sweden, approved the study (registration number Dnr 029-15). Potential respondents were informed in writing about the National Diabetes Register, the purpose of the study, confidentiality protections, voluntary participation, contact details, handling of personal data and the right to drop out at any point. All participants provided informed consent.
Provenance and peer review Not commissioned; externally peer reviewed.
Data sharing statement The data underlying this study are confidential. For inquiries, please contact the corresponding author or the National Diabetes Register, Centre of Registers Västra Götaland, SE-413 45 Gothenburg, Sweden.