Article Text

Abstract
Objectives To assess to what extent triage criteria, client and regional characteristics explain regional differences in Chlamydia trachomatis (Ct) and Neisseria gonorrhoeae (Ng) positivity in sexually transmitted infection (STI) clinics.
Design Retrospective cross-sectional study on the Dutch STI surveillance database of all 24 STI clinics.
Participants STI clinic visits of heterosexual persons in 2015 with a Ct (n=101 495) and/or Ng test (n=101 081).
Primary outcome measure Ct and Ng positivity and 95% CI was assessed for each STI clinic. Two-level logistic regression analyses were performed to calculate the percentage change in regional variance (PCV) after adding triage criteria (model 1), other client characteristics (model 2) and regional characteristics (model 3) to the empty model. The contribution of single characteristics was determined after removing them from model 3.
Results Ct positivity was 14.9% and ranged from 12.6% to 20.0% regionally. Ng positivity was 1.7% and ranged from 0.8% to 3.8% regionally. For Ct, the PCV was 11.7% in model 1, 32.2% in model 2% and 59.3% in model 3. Age, notified for Ct (triage), level of education (other characteristics) and regional degree of urbanisation (region) explained variance most. For Ng, the PCV was 38.7% in model 1, 61.2% in model 2% and 69.1% in model 3. Ethnicity (triage), partner in risk group, level of education and neighbourhood (other characteristics) and regional socioeconomic status (SES) explained variance most. A significant part of regional variance remained unexplained.
Conclusions Regional variance was explained by differences in client characteristics, indicating that triage and self-selection influence positivity rates in the surveillance data.
Clustering of Ng in low SES regions additionally explained regional variance in Ng; targeted interventions in low SES regions may assist Ng control. Including educational level as triage criterion is recommended. Studies incorporating prevalence data are needed to assess whether regional clustering underlies unexplained regional variance.
- chlamydia trachomatis
- neisseria gonorrhoeae
- heterosexual
- genitourinary medicine
- epidemiology
- public health
This is an open access article distributed in accordance with the Creative Commons Attribution Non Commercial (CC BY-NC 4.0) license, which permits others to distribute, remix, adapt, build upon this work non-commercially, and license their derivative works on different terms, provided the original work is properly cited, appropriate credit is given, any changes made indicated, and the use is non-commercial. See: http://creativecommons.org/licenses/by-nc/4.0/.
Statistics from Altmetric.com
- chlamydia trachomatis
- neisseria gonorrhoeae
- heterosexual
- genitourinary medicine
- epidemiology
- public health
Strengths and limitations of this study
The large nationwide database covering all sexually transmitted infection (STI) clinic consultations of heterosexuals with a large set of demographic and behavioural characteristics enabled us to study a range of explanatory variables for regional Chlamydia trachomatis and Neisseria gonorrhoeae positivity differences.
By using a multilevel approach, it was possible to quantify the contribution of characteristics of STI clinic visitors to the regional variance in positivity.
Some consultation data were incomplete for some variables of interest (15%), which limited the generalisability of our results, although a separate analysis did not show distortion of our results.
As we studied only STI clinic visitors and did not include patients from general practitioners, our results are not generalisable to all patients with STI.
Introduction
Chlamydia trachomatis (Ct) and Neisseria gonorrhoeae (Ng) are the most common bacterial sexually transmitted infections (STI) among heterosexual men and women in Europe.1 In the Netherlands, Ct and Ng diagnostic tests are mainly performed by general practitioners (GP) and STI clinics at Public Health Services, resulting in an estimated total number of 400 000 STI consultations nationwide. In 2016, it was estimated that approximately 20 000 Ct infections were diagnosed at the STI clinics and 35 000 at the GP. For Ng infections these number are 6000 and 8000, respectively.2 The GP is accessible to everyone in society and offers Ct and Ng testing on request. Laboratory tests at the GP are reimbursed by the insurance. However, a drawback is that the first few hundred Euros of healthcare costs are not deductible, and consequently STI tests are not always reimbursed. Public health-oriented STI clinics have been introduced nationwide in 2006 to provide confidential and free-of-charge STI testing and treatment for high-risk groups. Men who have sex with men (MSM) are eligible for regular testing at STI clinics and MSM consultations are disproportionally high at STI clinics. Heterosexuals are eligible to the STI clinic testing and treatment when they fulfil at least one of the high-risk triage criteria: notified by a partner for STI, STI-related symptoms, aged below 25 years, having a high risk for STI (eg, originating from or having a partner from an STI-endemic country or working as a commercial sex worker (CSW)) and/or victims of sexual violence. All STI clinic visitors are routinely tested for chlamydia and gonorrhoeae, syphilis, HIV (with the possibility to opt-out) and hepatitis B/C (on indication). Previously, all visitors to the STI clinics got fully tested for Ct and Ng and for HIV and syphilis, but since 2015, those younger than 25 years are all tested for Ct and Ng and on indication for HIV and syphilis.3 Despite national triage criteria and test policy, there are regional differences in the number of consultations and in Ct and Ng positivity among heterosexual STI clinic visitors. Explanations might be found in variations in the proportion of certain high-risk characteristics of STI clinic visitors and in variations in regional characteristics related to positivity. Knowledge about these underlying factors might improve our understanding of the surveillance data and may possibly inform priority setting for STI clinics. In this study, we assess regional differences in Ct and Ng positivity among heterosexual STI clinic visitors between the 24 Dutch public health STI clinic regions. Our main objective is to identify explanatory factors of regional variance in Ct and Ng positivity, especially client and regional characteristics.
Methods
Data collection
Data on STI clinic consultations and diagnoses in 2015 were obtained from the Dutch national STI surveillance database (SOAP), in which a predefined set of characteristics (including STI risk factors, diagnostic tests performed and outcomes measured) of all consultations at the 24 Dutch Public Health STI clinics is mandatory and routinely collected on a pseudonymous basis (unique numerical identifier per person which is not traceable to a person).4 The 24 STI clinics are scattered throughout the country (figure 1). In the SOAP database, all consultations of heterosexual STI clinic visitors in 2015 were selected (n=101 710). This database was merged with demographic data for each clients’ four-digit zip code (degree of urbanisation, socioeconomic status (SES) on neighbourhood level) and for each of the 24 STI clinic regions (distribution of age, gender, non-Western origin, degree of urbanisation, SES). Demographic data on age, gender, origin and degree of urbanisation in 2015 were obtained from ‘Statline’ (statline.cbs.nl), an open-access platform providing freely downloadable data of Statistics Netherlands (CBS). Demographic data on SES in 2014 was requested at the Netherlands Institute for Social Research (SCP). In this merged dataset, only consultations with a Ct test were selected for Ct analyses (n=101 495) and only consultations with an Ng test were selected for Ng analyses (n=101 081). For an overview of all variables see table 1.

Sexually transmitted infection clinics in public health service regions. Blue dot is location clinic.
Overview source of data collection and level of analysis
The data were routinely and pseudonymously collected for surveillance purposes and therefore the study was exempt from formal medical ethical approval under prevailing laws in the Netherlands.
Explanatory variables
Triage criteria
All triage criteria were included in the analyses: age, being notified by a sex partner for chlamydia (in Ct analyses), notified for gonorrhoea (in Ng analyses), STI-related symptoms, CSW, originating from an STI-endemic country, partner from risk group and Ct/Ng/syphilis infection in the previous year.3
The continuous variable age was categorised in age groups because of the non-linear relation between age and the log odds of the outcomes chlamydia and gonorrhoea. The categories were based on the relation between age and the outcomes on a log odds scale. We chose <20, 20–24, 25–29, 30–34, ≥35 for Ct analyses and <20, 20–24, 25–39, ≥40 years for Ng analyses. The presence of STI-related symptoms was unknown in 0.6% of consultations. We assumed that these persons did not have symptoms and were therefore included in the category ‘no symptoms’. Migratory background was based on the definition of Statistics Netherlands, which is based on country of birth of the person, mother and father. STI-endemic countries include Turkey and all countries in Africa, Asia, Eastern Europe and Latin-America.5 Categories include persons with a first-generation migratory background (person born in an STI-endemic country), and second-generation migratory background (mother or father born in an STI-endemic country) and persons originating from a non-STI-endemic country.6
A partner from risk group was defined as having a partner originating from an STI-endemic country or in women as having a partner with MSM contacts. Missing data were incorporated in a separate category.
Other individual level client characteristics
The following other client characteristics were also included in the analyses: gender, level of education, number of sex partners in past 6 months, condom use in last sexual contact, infections diagnosed in the current consultation (Ng infection (for Ct analyses), Ct infection (for Ng analyses), infection with HIV/hepatitis B/syphilis), repeated consultation at the same STI clinic during 2015, living in the region of the STI clinic consulted, neighbourhood SES and degree of urbanisation. The continuous variable number of sex partners was categorised in the groups 0–1, 2–3, 4–9, and ≥10 based on the relation between number of sex partners and the outcomes on a log odds scale. CSW who had an unknown number of partners were allocated to the group ≥10. A consultation was assigned ‘repeated’ when the person had a previous STI clinic consultation in 2015.
Client characteristics on neighbourhood level
Degree of urbanisation of the clients' residence address was obtained from CBS per four-digit zip code and categorised in three groups (1000–2500 addresses per km2 and less or more than this range). Neighbourhood SES was obtained from SCP providing a continuous ‘status score’ per four-digit zip code in 2014, based on level of education, employment and income of inhabitants.7 The status scores were transformed into tertiles, with tertile one representing the lowest SES. Missing data were incorporated in a separate category.
Regional characteristics of STI clinic regions
Regional characteristics included the percentage of men, aged 15–44 years (the age group to whom the majority of heterosexual STI clinic visitors belong), persons originating from an STI-endemic country (first and second generation), persons with a high degree of urbanisation and persons with a low SES within each of the 24 STI clinic regions. The median of these 24 percentages was used to construct dichotomised variables (percentage in region <median, percentage in region ≥median).
Outcome variables
Outcome variables were binary (positive/negative) for either Ct or Ng infection as indicated by a positive Nucleic Acid Amplification Test (NAAT) test at one or more anatomic locations. All analyses were performed at the level of visit for Ct and Ng separately.
Statistical analyses
Main analyses
For each region, the Ct and Ng positivity was calculated by dividing the number of positives by the number of tests performed. The corresponding 95% CI was calculated with the following formula:  , where p=proportion with positive test, z=1.96, z-value for a 95% CI, n=number of tests performed. 95% CI were depicted with forest plots.
Two-level logistic regression at client level was used to analyse explanatory factors of regional differences in positivity, with consultations (level 1) nested within regions (level 2). First, a random intercept model (model 0) without any explanatory variables was conducted to obtain baseline regional variance (V).
Besides model 0, three extended models were conducted with random intercepts and fixed slopes: model 1 included triage criteria, model 2 triage criteria and other individual level characteristics and model 3 triage criteria, other individual level characteristics and regional characteristics. For every model, the association between characteristics and outcomes were computed as adjusted ORs with 95% CI. Furthermore, the regional variance was noted. The proportional change in variance (PCV) was calculated to assess the extent to which the characteristics in the model explained regional variance.8
 , where V0 is the regional variance of model 0, Vi is regional variance of model i and i=2, 3.
To investigate which characteristics contributed most to regional variance, the percentage of contribution was computed for each variable separately.
 where V3,(−k) is the regional variance of model 3 without characteristic k, V3,(.) to the variance of model 3 with all characteristics.
Cleaning and merging of datasets and calculation of positivity rates were performed with SPSS V.24.0. Two-level logistic regression analyses were performed with SAS V.9.4. Forest plots were produced with Microsoft Excel 2010.
Additional analyses
To examine whether the associations between client characteristics and the outcomes differ between regions, model 3 was extended with random slopes for all client characteristics. With a backward selection procedure, only statistically significant (p<0.05) random slopes were included in the model. Subsequently, the PCV was calculated to investigate into what extent random slopes additionally explained regional variance. Furthermore, all analyses were repeated after missing values were imputed using multiple imputation (data not shown).
Patient and public involvement
Patients and or public were not involved in this retrospective study based on STI surveillance data.
Results
The characteristics of the study population are shown in table 2.
Descriptive analyses of the study population
Ct positivity
Ct positivity was 14.9% (95% CI 14.7% to 15.1%) and ranged from 12.6% (95% CI 11.6% to 13.6%) to 20.0% (95% CI 18.1% to 21.9%) regionally (figure 2). After including triage criteria, 11.7% of regional variance was explained (table 3). In this model, almost all triage criteria were statistically significantly associated with Ct, except for CSW and partner in risk group. After including other client characteristics, 32.2% of regional variance was explained. The triage criteria CSW and partner in risk group also became independently associated with Ct: CSW and those with a partner in risk group had lower Ct positivity. Other patient characteristics associated with Ct were level of education, number of partners in past 6 months, condom use in last sexual contact, Ng co-infection, repeated consultation, neighbourhood SES and degree of urbanisation. After including regional characteristics, 59.3% of regional variance was explained. The only regional characteristic independently associated with Ct was degree of urbanisation: those living in highly urbanised regions had lower Ct positivity when visiting the STI clinic.
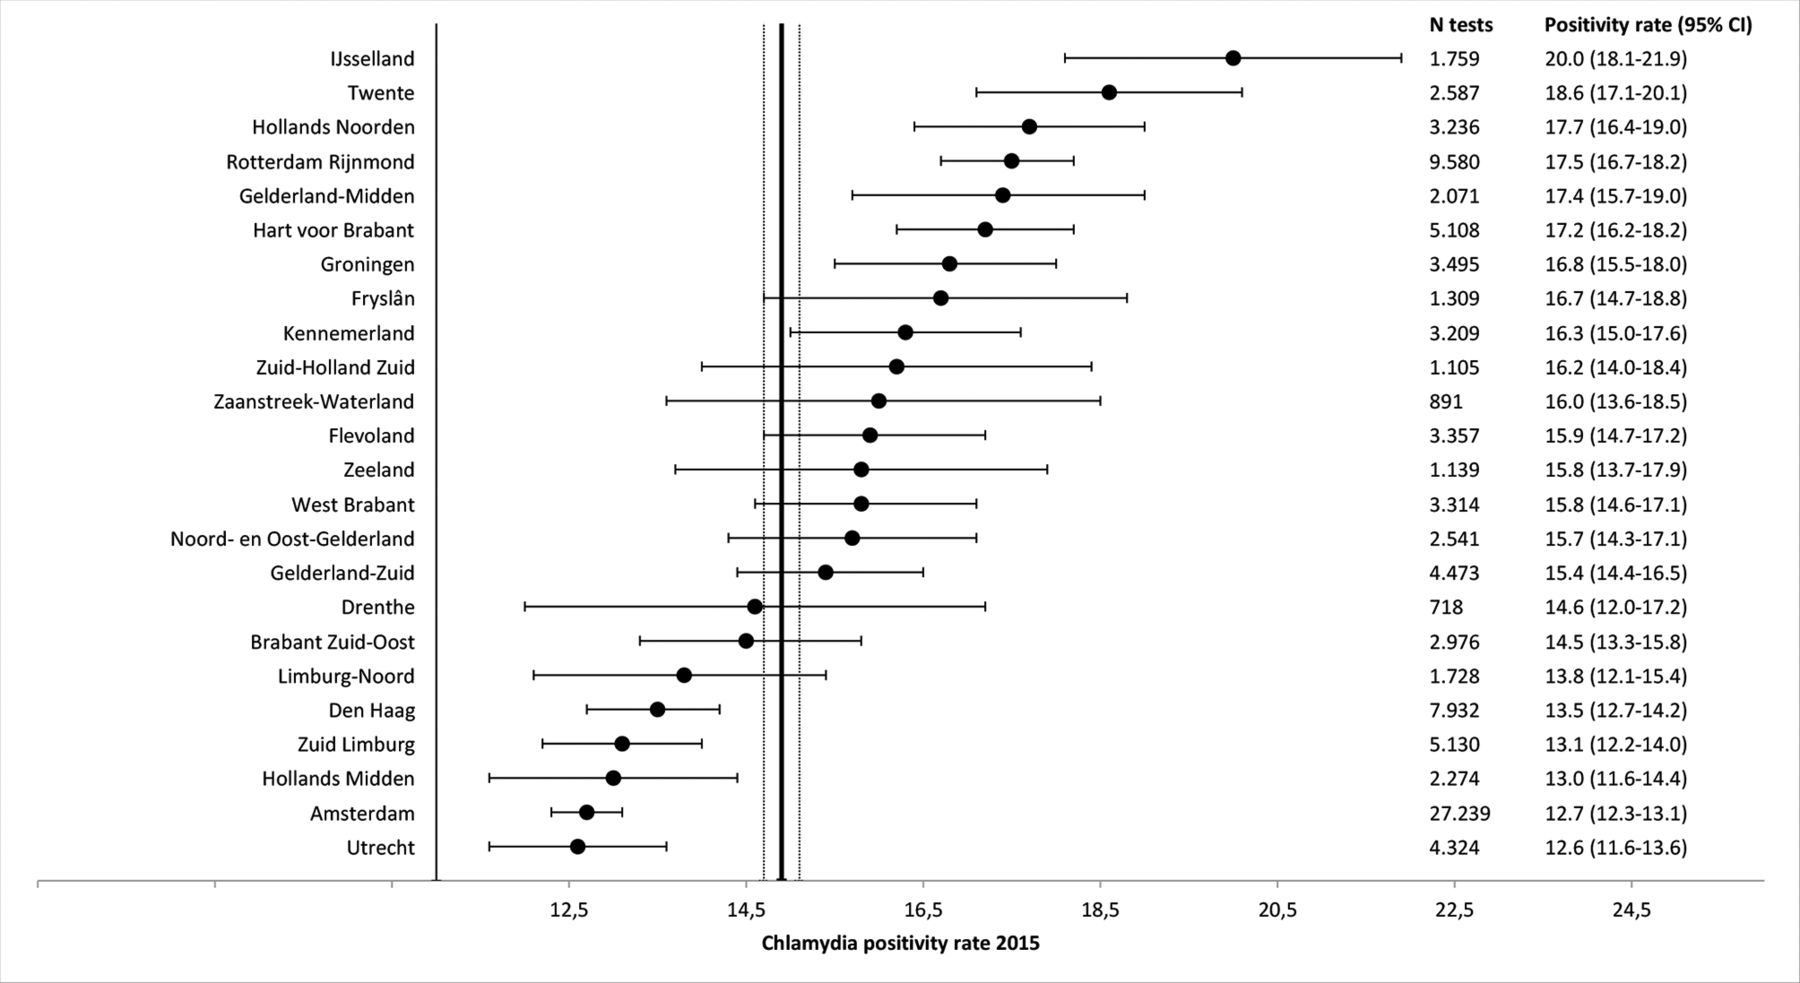
Chlamydia trachomatis (Ct) positivity rate by sexually transmitted infection clinic region in the Netherlands, 2015. Black dot Ct positivity rate, line depicts lower and upper limit of 95% CI. Total Ct positivity rate is depicted as vertical line, and 95% CI lines on the left and right.
Measures of association between triage criteria, other client characteristics and regional characteristics and Ct positivity and measures of variation in Ct positivity between regions in the Netherlands, 2015, obtained from two-level logistic regression
The variables age, being notified for Ct, level of education and regional degree of urbanisation contributed most to regional variance, respectively −38.2%, −15.0%, −15.4% and −24.0% (table 4). On the other hand, STI-related symptoms, number of partners in past 6 months and repeated consultation increased regional variance after including them in the model, respectively +44.8%, +15.0% and +18.0%.
Contribution of triage criteria, other client characteristics and regional characteristics to the regional variation in Ct and Ng positivity in the Netherlands, 2015, obtained from two-level logistic regression
There were significant random slopes for age, notified, STI-related symptoms, partner in risk group, gender and repeated consultation. After adding these random slopes to model 3, the PCV increased to 100% (table 3).
Ng positivity
Ng positivity was 1.7% (95% CI 1.6 % to 1.8%) and ranged from 0.8% (95% CI 0.5% to 1.1%) to 3.8% (95% CI 3.4% to 4.2%) regionally (figure 3). After including triage criteria, 38.7% of regional variance was explained. All triage criteria were statistically significantly associated with Ng (table 5). After adding other client characteristics, 61.2% of regional variance was explained. Level of education, number of partners in past 6 months, Ct infection, repeated consultation, neighbourhood SES and living in region of STI clinic consultation were associated with Ng. After adding regional characteristics, 69.1% of regional variance was explained. One regional characteristic independently associated with Ng was SES: those living in ‘low SES regions’ (defined as SES <median) had a borderline statistically significant higher Ng positivity when visiting the STI clinic.

Neisseria gonorrhoeae (Ng) positivity by sexually transmitted infection clinic region in the Netherlands, 2015. Black dot Ng positivity rate, line depicts lower and upper limit of 95% CI. Total Ng positivity rate is depicted as vertical line, and 95% CI lines on the left and right.
Measures of association between triage criteria, other client characteristics and regional characteristics and Ng positivity and measures of variation in Ng positivity between regions in the Netherlands, 2015, obtained from two-level logistic regression
The variables STI-endemic migrant, partner in risk group, level of education and SES on neighbourhood and regional level contributed most to regional variance, respectively −17.2%, −11.3%, −16.1%, −9.4% and −18.6% (table 4). On the other hand, STI-related symptoms increased regional variance after including it in the model (+30.7%).
There was a significant random slope for age. After adding this random slope to model 3, the PCV increased from 69.1% to 87.2%, with no statistically significant regional variance left (table 5).
Discussion
Main findings
Our study showed moderate statistically significant regional variance in Ct and Ng positivity among Dutch heterosexual STI clinic visitors. For Ct, about one-third of regional variance was explained by differences in client characteristics (mainly age, being notified for Ct and level of education), and 69% when adding regional characteristics (mainly low degree of urbanisation). For Ng, about two-thirds of regional variance was explained by differences in client characteristics (mainly STI-endemic migrant, partner from risk group, level of education and neighbourhood SES), and 59% when adding regional characteristics (mainly low SES).
Regional variance explained by client level characteristics
In order to contribute to regional variance, a client characteristic has to fulfil the following conditions: 1) the characteristic has to be related to the outcome, 2) the proportion of the characteristic has to vary between regions and 3) the prevalence of the characteristic has to be sufficiently high. The client characteristics reducing variance most are strongly associated with Ct and Ng positivity, as reported previously.9–16 Furthermore, the proportion of visitors with these characteristics is higher in regions with higher positivity. Consequently, correcting for these variables decreased regional variance. Some client characteristics however increased regional variance when included in the model, mainly STI-related symptoms. This indicates that the proportion of visitors with STI-related symptoms in regions with higher positivity is lower. The reasons behind different proportions of client characteristics between regions might be related to STI clinic location by familiarity with and accessibility of STI clinics, balance between availability of consultations and requests and subsequent stringent triage application, and differences in demography of STI clinics adherence area like urbanisation and ethnicity.
The characteristics contributing most to regional variance differed between Ct and Ng, mainly because of varying associations between these characteristics and the two outcomes. For example, STI-endemic migrant, partner in risk group and neighbourhood SES were more strongly related to Ng positivity than to Ct positivity. Furthermore, although being notified for Ng was strongly associated with Ng positivity, the prevalence of Ng notifications was too low to influence regional variance.
Low/intermediate level of education was independently associated with Ct and/or Ng positivity and contributed strongly to regional variance, which confirms previous studies.15 17 We advise to include education as a triage criterion into the STI clinic access policy, as persons with low/intermediate education are under-represented at STI clinics (33%) compared with 70% in the general Dutch population.4
Regional variance explained by regional characteristics
Regional SES explained part of regional variance in Ng positivity. Living in a low SES region increased Ng positivity independent of neighbourhood SES and level of education. This suggests that there is clustering of Ng among heterosexuals within low SES neighbourhoods and regions. Previous studies also found clustering of Ng within low SES regions and among migrant populations.9–11 16 18 Neighbourhood and regional SES had no influence on regional variance in Ct positivity, as is also described previously.19 However, regional degree of urbanisation was an important contributor to regional variance in Ct. Living in urbanised regions decreased Ct positivity at STI clinics. This is apparently in contrast to previous Dutch studies in which a high degree of urbanisation was related to higher Ct prevalence.17 20 A large proportion of visitors is from urbanised areas where most STI clinics are located. Visitors from low urbanised areas visit STI clinics less frequently but those that do visit the STI clinic have a higher Ct positivity rate possibly due to effective self-selection. Additional analyses showed that high urbanised regions had lower Ct positivity rates among those notified for Ct and among those with STI-related symptoms than low urbanised regions (not shown). Possibly, inhabitants of urbanised regions are more familiar with and have easier access to STI clinics.
Unexplained regional variance
Part of regional variance remained unexplained. After including significant random slopes in model 3, all regional variance was explained. The differential association between these characteristics and infection between regions explained all remaining regional variance. This implies that Ct/Ng risk of an STI clinic visitor differs between regions, even when client characteristics are similar. This may be caused by differences in the self-selection of persons visiting the STI clinic and in prioritising practices at STI clinics between regions, but it may also reflect real regional differences. Previous studies reported strong evidence for spatial Ng clustering in the UK and the USA, independent of sociodemographic regional factors.10 18 21–24 Also regional Ct clusters have been reported, although they were less strong and more diffuse compared with Ng clusters.25 Studies incorporating prevalence data are needed to assess whether regional clustering of Ct and Ng is present in the Netherlands.
Strengths and limitations
Analysing a nationwide database with a large set of demographic and behavioural characteristics enabled us to study a range of explanatory variables. By using a multilevel approach, it was possible to quantify the contribution of characteristics of STI clinic visitors to the regional variance in positivity. To the best of our knowledge, this has not been done before. There are also some limitations to address. First, in 15% of consultations data were incomplete for some variables of interest, varying between 0.1% and 6.7%. Missing data were incorporated as a separate group, which could have distorted results. However, missing data were imputed using multiple imputation, and results remained robust (not shown).26 Second our study is limited to STI clinic visitors, and did not account for STI related consultations at GP practices. STI visitors are at high risk, partially due to self-selection and due to triage, and therefore do not reflect the Dutch population.27 28 As our aim was to explain regional variance within the STI clinic data and not to investigate the real positivity, this is in fact not limiting the results of our study. Third, although a large set of characteristics was available, residual confounding remains possible.
Conclusion and recommendations
We found statistically significant regional variance in Ct and Ng positivity among Dutch heterosexual STI clinic visitors. Regional variance was explained by differences in client characteristics, indicating that triage and self-selection influence positivity rates in the surveillance data. Client characteristics explained a larger part of regional variance in Ng than in Ct suggesting that Ng is more concentrated in high-risk persons.29 Furthermore, our results indicate Ng clustering among heterosexuals within low SES neighbourhoods and regions; targeted interventions in low SES regions may therefore be valuable for Ng control. STI clinics might strengthen their efforts to include young lower educated heterosexuals to improve Ct control, and also increase their efforts in reaching more low educated persons from low SES and/or migrant origin in case of Ng control. Although prevalence studies are known to have methodological and practical challenges and are scarce, they are needed to assess whether real regional differences appear. Furthermore, each STI clinic should investigate the characteristics of their clients at highest risk to develop targeted prioritising policy and ideally combine this information with data from GP patients to get a complete regional perspective.
Acknowledgments
The authors would like to thank the co-workers of the 24 Dutch STI clinics for the thorough data entry of all consultations. The authors would also like to thank Dr Jan van de Kassteele and Dr David van Klaveren for their statistical advice and to Dr Maarten Schipper for performing the multiple imputation.
References
Footnotes
Patient consent for publication Not required.
Contributors HG initiated the study, helped interpreting the data and drafted and revised the manuscript. LvO initiated the study, analysed and interpreted the data and drafted the manuscript. BvB and CJPAH helped interpreting the data and revised the manuscript draft. All authors read and approved the final manuscript.
Funding The authors have not declared a specific grant for this research from any funding agency in the public, commercial or not-for-profit sectors.
Competing interests None declared.
Provenance and peer review Not commissioned; externally peer reviewed.
Data sharing statement Results of analyses on the imputed datasets are available on request from the corresponding author after permission of the registration committee for the Dutch STI clinic database. The Corresponding Author has the right to grant on behalf of all authors and does grant on behalf of all authors, an exclusive licence (or non-exclusive for government employees) on a worldwide basis to the BMJ Publishing Group Ltd (BMJPGL) to permit this article (if accepted) to be published in BMJ open and any other BMJPGL products and sublicences such use and exploit all subsidiary rights, as set out in our licence http://group.bmj.com/products/journals/instructions-for-author.