Article Text

Abstract
Objective To determine whether the association between highest educational attainment and stroke differed by sex and age; and whether potential mediators of observed associations differ by sex.
Design Prospective cohort study.
Setting Population based, New South Wales, Australia.
Participants 253 657 stroke-free participants from the New South Wales 45 and Up Study.
Outcome measures First-ever stroke events, identified through linkage to hospital and mortality records.
Results During mean follow-up of 4.7 years, 2031 and 1528 strokes occurred among men and women, respectively. Age-standardised stroke rate was inversely associated with education level, with the absolute risk difference between the lowest and highest education group greater among women than men. In relative terms, stroke risk was slightly more pronounced in women than men when comparing low versus high education (age-adjusted HRs: 1.41, 95% CI 1.16 to 1.71 and 1.25, 95% CI 1.07 to 1.46, respectively), but there was no clear evidence of statistical interaction. This association persisted into older age, but attenuated. Much of the increased stroke risk was explained by modifiable lifestyle factors, in both men and women.
Conclusion Low education is associated with increased stroke risk in men and women, and may be marginally steeper in women than men. This disadvantage attenuates but persists into older age, particularly for women. Modifiable risk factors account for much of the excess risk from low education level. Public health policy and governmental decision-making should reflect the importance of education, for both men and women, for positive health throughout the life course.
- education
- socioeconomic disparities
- stroke
- cohort study
- data linkage
This is an open access article distributed in accordance with the Creative Commons Attribution Non Commercial (CC BY-NC 4.0) license, which permits others to distribute, remix, adapt, build upon this work non-commercially, and license their derivative works on different terms, provided the original work is properly cited, appropriate credit is given, any changes made indicated, and the use is non-commercial. See: http://creativecommons.org/licenses/by-nc/4.0/.
Statistics from Altmetric.com
Strengths and limitations of this study
A strength is the large study population and large number of outcome events, allowing stratification by sex.
This is one of just a few studies on this topic to have included both men and women and both fatal and non-fatal stroke outcome events.
Breadth of data enabled adjustment of many potential confounders/mediators, allowing identification of candidate mediators of the observed association.
Limitations include the ‘healthy cohort’ effect which may mean findings are less generalisable to the general population.
We could not identify non-fatal strokes for which participants were not admitted to hospital.
Introduction
Socioeconomic disparities in health are well recognised, with lower socioeconomic position (SEP) associated with greater risk of mortality and disease, including cerebrovascular disease.1 Based on cause-specific mortality studies, absolute socioeconomic inequalities in health appear to be greater for men than women.2–4 There is, however, accumulating evidence that the SEP–cardiovascular disease relationship might actually be steeper in women than men.5 6 This has been investigated far less in relation to stroke, with the few, generally small, existing studies having reported conflicting findings.7–9 Furthermore, few studies have explored whether the potential underlying mechanisms of the SEP–stroke association might differ by sex.
Age differences in the SEP–stroke association have also been rarely studied.7 10 There are conflicting views as to whether SEP disparities in health persist into older age. Some believe that the inequality gap narrows with age, while others propose that this is an artefact of mortality selection.11 12 It is important to determine whether lower SEP poses a particular disadvantage to women’s health in terms of stroke risk, and to ascertain whether such an effect, if it exists, persists over the life course in order to inform approaches to reducing health inequalities.
Valid examination of sex and age differences in SEP inequalities in disease relies on careful measurement of SEP in both sexes. Educational attainment is a particularly useful SEP measure since it is easy to measure, elicits a high response rate, is relevant regardless of age and employment status and performs well regardless of sex.13 In addition, since education is generally completed in young adulthood and is strongly related to parental characteristics, it also partly captures early life SEP.13 Importantly, this also minimises potential for reverse causation between SEP and health outcomes (and their risk factors).
Using data from the 45 and Up study, a large Australian prospective cohort study, we aimed to determine whether the association between highest educational attainment and stroke differed by sex and age; and whether potential mediators of observed associations differ by sex.
Methods
Study population
We included participants from the Sax Institute’s 45 and Up Study, a prospective cohort recruited between 2006 and 2009 from New South Wales (NSW), Australia, general population aged 45 years or over. Recruitment methods are described in detail elsewhere.14 Briefly, potential participants were randomly sampled from the Department of Human Services (formerly Medicare Australia) enrolment database and mailed a self-administered questionnaire and information leaflet. For this study, the cohort was linked to the NSW Admitted Patient Data Collection, the Australian Capital Territory (ACT) Admitted Patient Collection and the Australian Bureau of Statistics Death Data, with linkage performed by the Centre for Health Record Linkage.15 We excluded participants with a previous hospitalised stroke record or self-reported stroke at baseline.
Education
Education was self-reported, with participants provided with the following list and asked to provide their highest attained qualification: college/university degree; certificate/diploma/trade/apprenticeship; higher school or leaving certificate (or equivalent); school or intermediate certificate (or equivalent), typically awarded at the end of year 10 when children are aged 14, with successful completion required for the completion of the higher school certificate); or no qualifications.
Stroke
We identified incident stroke from hospital admission discharge records and mortality records and defined all strokes based on international Classification of Diseases (ICD) -10 codes (I60, I61, I63 and I64). Ischaemic stroke was defined using I63 and I64 (since the majority of ‘undetermined’ strokes coded as I64 will be ischaemic).16
Covariates
Definitions of all included covariates are given in online supplementary table 1. We adjusted for demographic and other socioeconomic measures (including marital status and geographical remoteness). While area-based deprivation was available, we did not adjust for it since in univariate analyses it was not associated with stroke risk (perhaps because area is not measured at a small enough level). We also did not analyse or adjust for average household income, for two reasons. First, household income is a less reliable marker of SES, particularly among retired people (a substantial proportion of the cohort under study) because although actual household income might be low in this group, they often possess other financial assets, information on which was not collected. Second, average household income was missing in a substantial proportion of people (21%), with higher rates of missing data among women and older people. Thus, we did not include income in our models, focusing instead on education level. We also adjusted for: psychological distress (as measured by the Kessler Psychological Distress scale17), a range of lifestyle factors (including fruit, vegetable and fish intake); history of disease/stroke risk factors (including physical comorbidity based on a modified Charlson Comorbidity Index18 using hospital admission data in the 5 years prior to recruitment) and among women, reproductive factors.
Supplemental material
Statistical analyses
We performed analyses using Stata V.12. We calculated stroke rates by sex, education level and age group, age standardised to the Australian sex-specific standard population. We initially categorised age as follows: 45–59, 60–69, 70–79 and ≥80 years. For the purpose of investigating interactions, we later collapsed the two lowest and two highest groups, to dichotomise age into <70 and ≥70 years.
Overall, the frequency of missing values was less than 5% for most covariates, with the exception of geographical remoteness, which was less complete. Missing values were widely spread across participants, with 33% of men and 43% of women having missing values for at least one variable. Missing data patterns indicated that data were likely to be missing at random but not missing completely at random. We, therefore, used multiple imputation by chained equations to impute missing values of included covariates. We imputed data for men and women separately, since we had additional sex-specific covariates for women, performing 35 imputations for men and 45 imputations for women.
We used Cox regression to obtain HRs with 95% CIs for the association between education level and stroke. We used age as the time axis, following participants from recruitment date and censoring for stroke event date, non-stroke death and end of follow-up (31 December 2012). We obtained sex-specific unadjusted HRs, before serially adjusting for groups of covariates including: other sociodemographic factors, psychological distress, lifestyle factors and disease history. Thus, we treated all covariates as common sources (confounders) in our analyses. Since some of these covariates might actually lie on a possible causal pathway between education level and stroke, we acknowledge that this assumption may not be valid and discuss the implications of this in our discussion. Our primary analysis included the multiple imputed dataset. In sensitivity analyses, we restricted our outcome to ischaemic strokes and also performed a complete case analysis. There was no clear violation of the proportional hazards assumption for education or any covariates in any analyses.
We investigated effect modification by sex and age by testing for multiplicative interaction (through testing for statistical interaction in the models). Since additive interaction is more important for understanding public health, we also investigated supra–additive interaction19 between education (comparing the lowest vs highest education categories) and stroke, by calculating the relative excess risk of interaction (RERI) and synergy index with accompanying 95% CIs. An RERI of greater/lesser than 0 and a synergy index of greater/lesser than 1 indicate that the combined effects of each exposure is more or less than expected from adding the individual effects.
Results are reported in accordance with the Strengthening the Reporting of Observational Studies statement.20
Patient and public involvement
We did not include patient or public involvement in the conduct of the present study.
Results
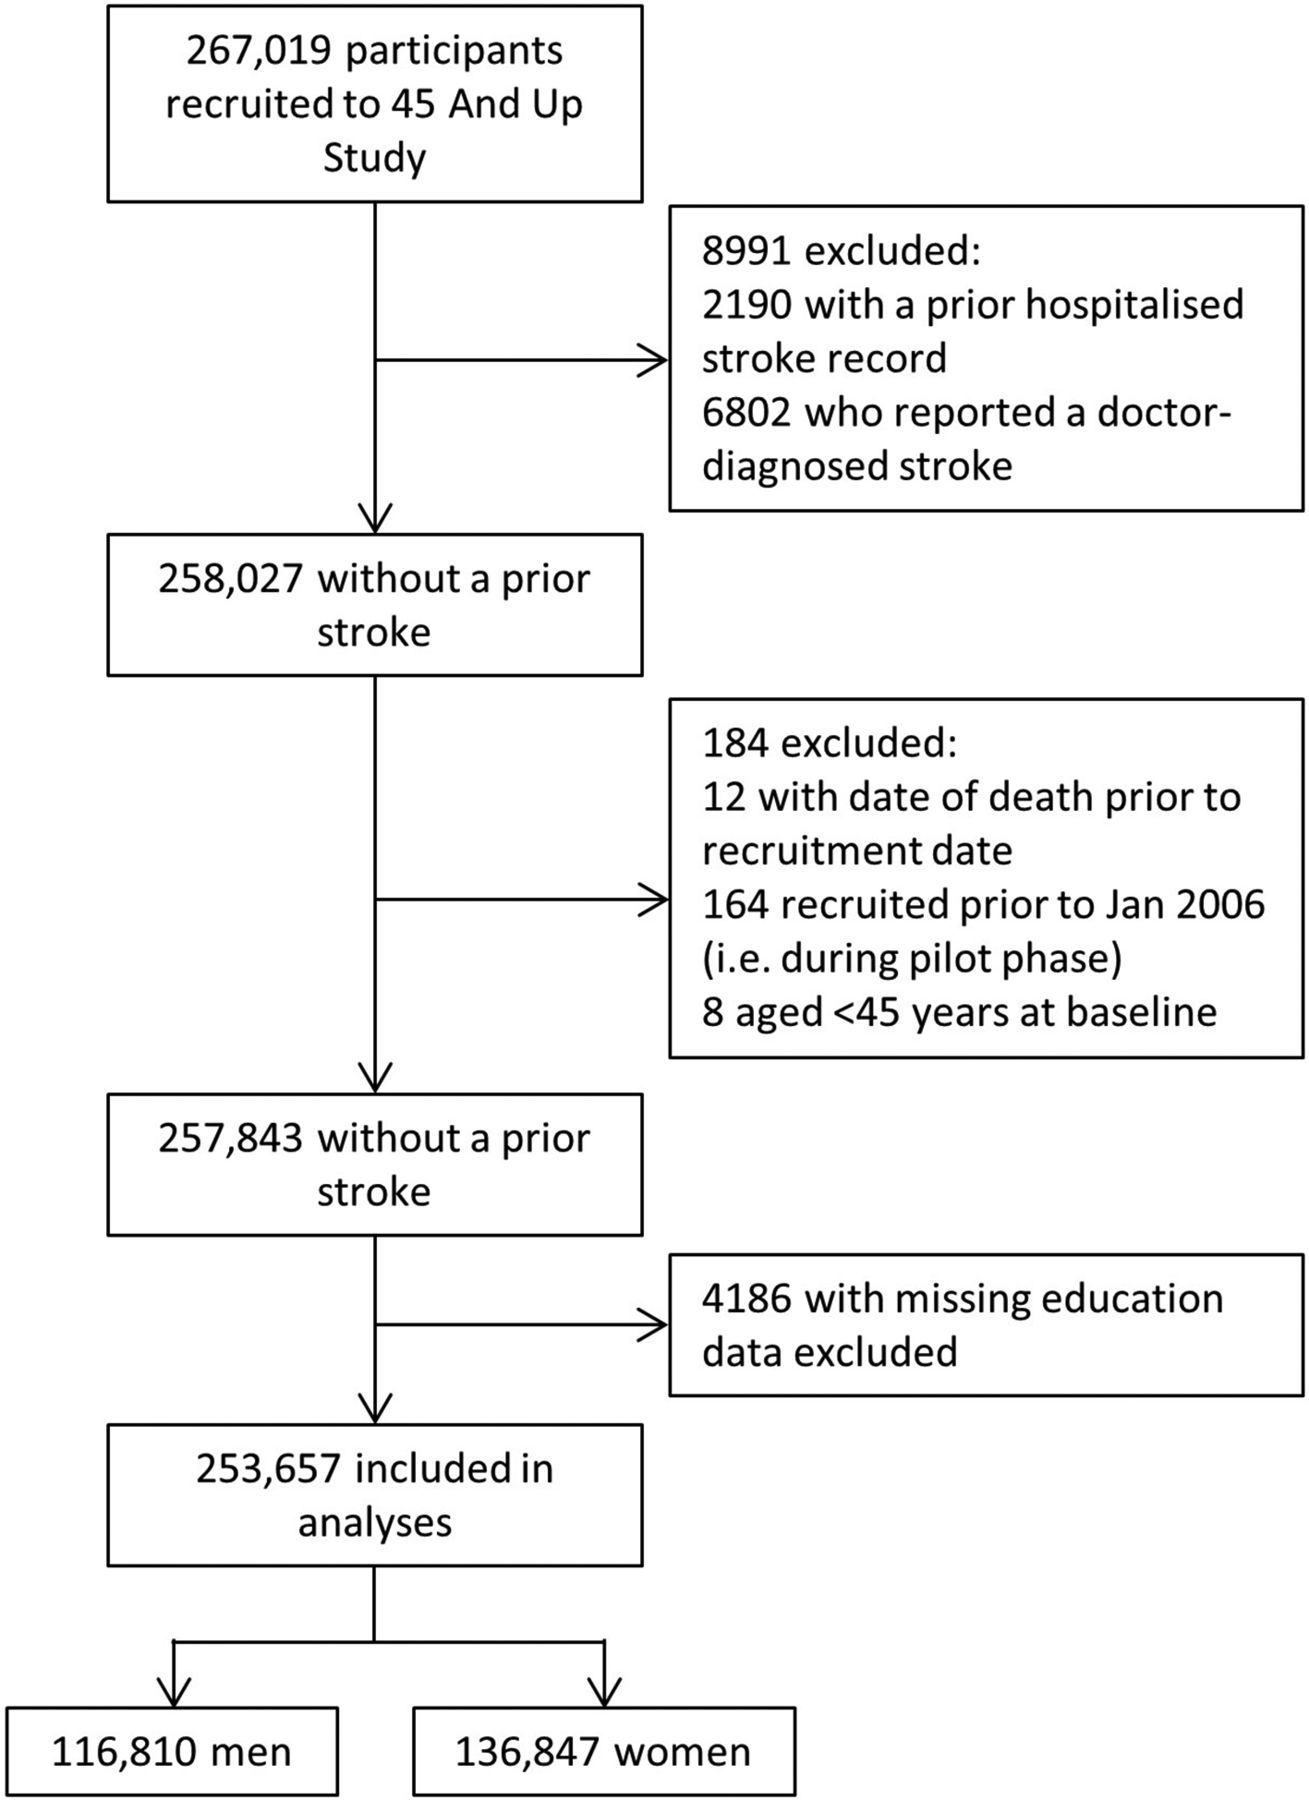
Among 257 843 participants eligible for inclusion, we excluded 4186 (1.6%) with missing information on education, ultimately including 253 657 participants (figure 1). Compared with included participants, excluded participants were older and more likely to be: female; from areas of higher deprivation and less healthy (online supplementary table 2).

Flow diagram of included participants from the 45 and Up study.
We included 116 810 men and 136 847 women (mean±SD age in years 63.3±11.0 and 61.4±10.9, respectively). Sex-specific cross-tabulations of characteristics by education level are given in online supplementary tables 3 and 4. Distribution of education level differed by sex and age. The proportion with a college or university qualification was slightly higher in men than women (25.6% vs 22.2%) and the proportion with no qualifications slightly higher in women than men (12.4% vs 10.7%). The proportion with no qualifications or a school/intermediate certificate was higher among older age groups (and was greater in women than men), whereas the proportion with a college/university degree was higher among younger age groups (with far less disparity between women and men). Lower educational status was associated with poorer lifestyle behaviour and clinical stroke risk factors, with similar patterns observed in men and women. Similarly, most characteristics were associated with stroke risk (online supplementary table 5).
Absolute and relative stroke risk by education, sex and age
Mean follow-up was 4.70 (±SD 0.98) years. Among men, 2031 strokes (1696 ischaemic) occurred during 545 543 person-years of follow-up and among women 1528 strokes (1225 ischaemic) occurred during 644 362 person-years.
The pattern of absolute stroke risk was not linear with education level. For both men and women, absolute stroke rates were lowest in the group with highest educational attainment. The stroke rates for each of the other education categories were higher, but generally similar to each other, particularly for men. Among women, the stroke rates in the three middle categories of educational attainment are very similar, with the rate in the group with no qualifications even higher (figure 2A and table 1). In contrast, among men, in comparison to the highest education category, stroke rates for each of the other education categories were higher, but to a similar extent, with CIs for estimates overlapping. If anything, the stroke rate in those with no qualifications was slightly lower than in those with a trade/apprenticeship or school certificate (figure 2C and online supplementary table 6). Among those with no qualifications, the stroke rate was slightly greater in women than men and the absolute risk difference between lowest and highest education categories was greater in women than men (table 1). After stratifying by age group, a similar pattern was observed for those aged under 70 years (figure 2B and online supplementary figure 1) and, among women, for those aged 70 years or over.

Absolute stroke risk by education level among men and women, showing age-standardised stroke incidence (per 1000 person-years) for (A) all ages; (B) age 45–69 years and (C) age 70 years or over (at baseline).
Sex-specific age-standardised incidence rates (per 1000 person-years) for stroke, by education level
In relative terms, having no qualifications was significantly associated with increased stroke risk in men and women, but was slightly more pronounced in women than men (age-adjusted HRs 1.41, 95% CI 1.16 to 1.71 and 1.25, 95% CI 1.07 to 1.46, respectively; table 2). Among women, a similar magnitude of effect was observed for the middle three categories of education level versus the highest level, each of which was associated with about a 20% increased risk of stroke (table 2, model 1). This pattern persisted when stratifying by age group, although effect estimates were larger in those aged 45–69 than 70 years or over for both sexes. The association between education and stroke among those aged 45–69 was slightly stronger in women than men (HR lowest vs highest education level: 1.73, 95% CI 1.20 to 2.49 and 1.58, 95% CI 1.19 to 2.10, respectively). The association between education and stroke was somewhat weaker in men aged 70 years or over, but persisted among women in this age group, with having no qualifications associated with a 21% increased risk of stroke (HR 1.21, 95% CI 0.96 to 1.52), although this was not statistically significant (online supplementary table 6). However, having only a school certificate was statistically significantly associated with increased stroke risk in men aged 70 or over (HR 1.21, 95% CI 1.02 to 1.44). Similar associations were found when we restricted our analyses to ischaemic strokes only.
Serially adjusted HRs for the association between education level and stroke, stratified by sex
Sex and age interactions with education
Although the effect of education on stroke risk appeared to be slightly greater among women than men, there was no evidence of statistical interaction on either the multiplicative or additive scale. Although the RERI and synergy index were less than 0 and 1, respectively, CIs did not exclude the possibility of no interaction (online supplementary table 7). Similarly, there was no clear evidence of statistical interaction between age and education for men or women (online supplementary table 7).
Fully adjusted education–stroke associations
Adjusting for confounding by marital status and geographical remoteness had little effect on the associations (table 2). Following additional adjustment for behavioural factors and disease history, which could confound and/or possibly mediate a potentially causal association between education level and stroke risk, the magnitude of effect was attenuated and, for almost all education categories, was no longer statistically significant (fully adjusted HRs for lowest vs highest education level in men and women: 1.10, 95% CI 0.94 to 1.30 and 1.21, 95% CI 0.97 to 1.51, respectively; table 2). While the same pattern of association was observed in the complete case analysis, when compared with the analysis of the imputed dataset, the magnitude of effect was slightly greater for all education categories (online supplementary table 8).
Discussion
We found an inverse, although non-linear, association between education level and stroke risk in both men and women, which was slightly more pronounced in women than men. The association weakened somewhat in older ages for men and, to a lesser extent, for women. Modifiable lifestyle factors explained much of the increased stroke risk in both sexes.
Our study benefits from the key strengths. We included a very large stroke-free study population, among which a large number of strokes occurred, providing sufficient power to stratify by sex. The breadth of data collected allowed us to adjust for a wide range of potential confounders/mediators, including those less commonly adjusted for in previous studies, to identify candidate mediators through which education level might affect stroke risk. There are, however, some limitations. First, the participation rate in the 45 and Up Study is about 18% and given the ‘healthy cohort effect’, it is unlikely to be representative of the general NSW population aged 45 and over.14 However, the cohort is heterogeneous across collected variables. Thus, while people with a low education level may well be under-represented in this cohort, given the cohort size and heterogeneity, this is unlikely to have had an effect on internal comparisons of exposure and outcome.14 Second, it is important to recognise that the meaning of education differs by birth cohort. The consequences of having no high school education may differ among those born in the 1950s versus the 1920s, for example. However, we did take this into account by examining the association between education and stroke risk within different age groups. Third, we were unable to identify non-fatal strokes for which people were not admitted to hospital (estimated to be about 15% of all strokes, but likely higher among older people21) or strokes that occurred outside NSW and the ACT (which will have been few in number). Fourth, misclassification of stroke diagnosis may have occurred within hospital and mortality records. However, a recent systematic review of the accuracy of hospital and mortality records suggests that the use of appropriately selected, stroke-specific codes (rather than broad cerebrovascular disease codes) yields positive predictive values of greater than 70% in most studies and greater than 90% in some studies.16 Finally, since we do not have time-varying information on covariates, we cannot be certain that all covariates are indeed confounders and not mediators in the relationship between education and stroke. We may therefore have overadjusted our analyses by including possible mediators, thereby underestimating the association between education and stroke.
Our finding that education level is associated with stroke risk is consistent with the findings from many existing studies.7 9 22–26 We did not however observe an incremental increase in stroke risk with decreasing education level. This is in keeping with some other studies where education was classified into more than three groups and where a non-linear pattern of association with stroke was observed.7 24 This may reflect a true non-linear relationship between education level and stroke in some settings. In the present study, the distribution of other stroke risk factors, such as history of diabetes, hypertension and key lifestyle factors was very similar among those with a diploma/trade/apprenticeship, higher school certificate or school/intermediate certificate. This might help explain why similar stroke rates were seen in these groups. Also, among men, the similarity in stroke risk between each of these education groups and the group with no qualifications is intriguing. As discussed below, this might reflect that men are able to compensate for having no qualifications to a greater extent than women.
Our study makes an important contribution to the small body of existing literature on SEP–sex interactions on stroke risk and indeed circulatory disease in general. A recent systematic review and meta-analysis concluded that there are sex differences in the relationship between education and coronary heart disease, but not stroke.5 However, the authors included studies of stroke mortality and not just stroke incidence. Results of the latter studies tended to suggest greater education–stroke inequalities in men than women. They also included studies from low-income and middle-income settings, where the SEP–stroke gradient itself might differ from high-income settings.
Findings from the very few studies that have explored interactions by age and sex on stroke risk are mixed. One reported no difference by sex,27 whereas a second found an association between low education and increased stroke risk among men but not women.23 Consistent with our findings, two studies found the education–stroke association was weaker8 or absent9 in men.
There is biological plausibility for a different SEP–stroke association among women compared with men. Sex differences in the association between household income and atherosclerotic processes in adolescence were observed in one study, which were partially explained by a stronger income–adiposity association in females.28 Similarly, the associations between SEP and carotid atherosclerosis in mid-age have been reported to be greater among men than women.29 Furthermore, based on the theory of resource substitution (which states that resources can substitute for one another), education may be more important to women’s health compared with men’s because they have fewer socioeconomic resources of other kinds (such as income, power, authority and wealth) to draw on.30 In our study, income was lower among women than men across educational categories, but there was substantial missing data on income, especially among women, which precluded more detailed analyses. While we were able to adjust for marital status, we were unable to adjust for spousal educational status, which is also thought to play a role in individuals’ health.31
We also demonstrated that the adverse effect of low education on stroke risk attenuated but did persist in older age groups. The slightly weaker association between education and stroke among elderly men may reflect mortality selection,12 since educational disparities in mortality are greater among men than women. Our findings therefore support the view that socioeconomic inequalities in health persist into older age.11 Two previous studies on education and stroke risk stratified by age group, but they did not stratify by sex. In one, low education was associated with increased stroke risk in those aged 65–74 years, but a decreased risk in those aged 75 years or over.7 In contrast, the other study found no association among those aged 65–74 years, but a trend towards reduced risk in those with high versus low education aged 50–64 years.10 Two studies of women only, with mean age less than 50 years, reported a magnitude of effect comparable to that among women aged less than 70 years in our study.25 32
Our results suggest that lifestyle factors predominantly account for the observed increased stroke risk but that psychological distress and disease history are also important, perhaps more so for women than men. It is difficult to compare our sex-specific findings to similar studies of education and stroke, given that so few studies stratified by sex. A formal mediation study, using a path analysis approach, suggested that behavioural factors account for much of the education–cardiovascular disease gradient,33 which concurs with our findings. There is evidence that, when stratifying by sex, lifestyle behaviours may account for all of the education–cardiovascular association in men, but not women.34 Our findings support this to some extent in that the slight excess stroke risk seen in women does persist after full adjustment for confounders/potential mediators. In addition, previous studies have posited a possible role for psychosocial factors as partial mediators of the association between education and stroke35 and cardiovascular disease36 in women. In line with this, adjustment for psychological distress in our study notably attenuated the effect estimates for women, but not men.
Since this is one of the few studies to date to examine the association between education and stroke risk by sex, within the same study population, further research is needed to confirm or refute the possibility of steeper socioeconomic–stroke disparities in women compared with men. Further investigation is also needed to shed more detailed understanding on the underlying mechanisms of the relationship between socioeconomic status and stroke risk and determine where these differ between men and women. Mediation analyses to unpick these mechanisms should stratify by sex and include non-conventional risk factors (such as psychosocial factors) as well as traditional cardiovascular risk factors. Such studies will inform tailored prevention strategies aimed at reducing health inequalities. Meanwhile, ongoing public health investment is needed to facilitate healthy lifestyle behaviour and reduce uptake of poor health behaviours, particularly in vulnerable socioeconomic groups.
Conclusion
Our study suggests that the education–stroke relationship is present in both men and women, but may be marginally stronger for women than men, with low education a disadvantage to women throughout the life course. The critical importance of education, of both men and women, for positive health throughout the life course should be reflected in public health and educational policy and governmental decision-making.
Acknowledgments
This research was completed using data collected through the 45 and Up Study (www.saxinstitute.org.au). The 45 and Up Study is managed by the Sax Institute in collaboration with major partner Cancer Council NSW; and partners: the National Heart Foundation of Australia (NSW Division); NSW Ministry of Health; NSW Government Family and Community Services—Ageing, Carers and the Disability Council NSW; and the Australian Red Cross Blood Service. We thank the many thousands of people participating in the 45 and Up Study.
References
Footnotes
Contributors CAJ designed the study, CLMS and GDM contributed to the analytical strategy and interpretation of the results. CAJ drafted the manuscript and CLMS and GDM commented on and approved the final draft.
Funding This work was supported by a University of Queensland Early Career Researcher Grant awarded to CAJ (grant number 2013002357).
Competing interests None declared.
Patient consent Not required.
Ethics approval The conduct of the 45 and Up Study was approved by the University of NSW Human Research Ethics Committee. Ethical approval for the present study was obtained from the NSW Population and Health Services Research Ethics Committee, the ACT Health Human Research Ethics Committee and the University of Queensland Institutional Human Research Ethics Committee
Provenance and peer review Not commissioned; externally peer reviewed.
Data sharing statement The 45 And Up study data are accessible to any bona fide researcher who has a scientifically sound and feasible research proposal, has ethics approval for the study and can cover the licence fees and costs incurred by accessing the data through the Secure Unified Research Environment provided by the New South Wales Sax Institute (https://www.saxinstitute.org.au/our-work/45-up-study/for-researchers/). Researchers accessing the data do not retain copies of the dataset and are not able to share these data with anyone else.