Article Text

Abstract
Objective The consumption of carbonated sugar-sweetened beverages (CSSBs) is associated with a range of health problems, but little is known about the sugar and energy content of CSSBs in China. The study aimed to investigate the sugar and energy content of CSSBs in Beijing, China.
Study design We carried out a cross-sectional survey in 15 different supermarkets from July to October 2017 in Haidian District, Beijing.
Methods The product packaging and nutrient labels of CSSBs were recorded by a snapshot in time to obtain company name, product name, serving size, and nutrient content, that is, carbohydrate, sugar and energy. For CSSB labels not showing sugar content, we used carbohydrate content as substitute. The sugar and energy content of CSSBs within each type of flavour were compared using Kruskal-Wallis test. The sugar content within the recommended levels was described using frequency. We also compared the sugar and energy content of top 5 CSSBs in terms of sales among three countries (China, UK and USA).
Results A total of 93 CSSB products were found. The median sugar content was 9.3 (IQR: 5.7–11.2) g/100 mL, and the energy content was 38 (IQR: 23–46) kcal/100 mL. There were 79 products labelled ‘Red’ (high) per serving based on the criteria set in the UK (>11.25 g/100 mL). We found 62.4% of CSSBs had sugar content per serving that exceeds the daily free sugar intake for adults (25 g) recommended by the WHO. Some of the branded products sold in China had higher sugar content when they were compared with those in Western countries.
Conclusions CSSBs in Beijing, China have high sugar and energy content. Reduction in sugar content and serving size of CSSBs and taxation policy on beverages will be beneficial in reducing sugar intake in China.
- sugar-sweetened beverages
- energy
- portion size
- taxation
This is an open access article distributed in accordance with the Creative Commons Attribution Non Commercial (CC BY-NC 4.0) license, which permits others to distribute, remix, adapt, build upon this work non-commercially, and license their derivative works on different terms, provided the original work is properly cited, appropriate credit is given, any changes made indicated, and the use is non-commercial. See: http://creativecommons.org/licenses/by-nc/4.0/.
Statistics from Altmetric.com
Strengths and limitations of this study
This is the first study that has investigated the sugar and energy content of carbonated sugar-sweetened beverages (CSSBs) sold in Beijing, China, where there has been a rapid increase in the consumption of CSSBs in parallel with the obesity epidemic over the past three decades.
One of the strengths of the study is the cross-country comparison in sugar content and serving size of CSSBs between China and the UK, where a sugar reduction programme has been carried out, resulting in a reduction in the sugar content of CSSBs.
The findings of our study provide valuable evidence for the development of a strategy to reduce the amount of sugar added to soft drinks, and therefore reducing sugar consumption and preventing obesity, type 2 diabetes and dental caries in China.
The limitation of this study included its cross-sectional study design and the substitution of sugar with carbohydrates for CSSBs that did not have sugar content information on the labels.
Introduction
Over the past 30 years, the consumption of sugar-sweetened beverages (SSBs) has increased rapidly in parallel with the urbanisation and infiltration of Western diet in China.1 2 The SSBs are likely to contribute to an increase in obesity, hypertension, type 2 diabetes and other metabolic disorders.3–6
Free sugar consumed by people includes all monosaccharides and disaccharides added to foods by the manufacturer, cook or consumer, plus sugars naturally present in honey, syrups and unsweetened fruit juices.7 The most common form of free sugar is SSBs. Carbonated sugar-sweetened beverages (CSSBs) are popular SSBs consumed by Chinese children,3 4 and they are available and convenient for children to buy in supermarkets. Non-CSSBs contain natural sugars (lactose and fructose) which are not included in the definition of free sugars, while all sugars in CSSBs are almost free sugar. CSSB products are important contributors of free sugar intake.8 Free sugars have little or no nutritional value, being a major hidden source of empty calories contributing to obesity-related diseases.9 Chinese children who consume CSSBs have higher prevalence of childhood obesity, particularly abdominal obesity,4 5 and the number of Chinese obese children is the highest in the world.10 Previous studies reported the sugar and energy content of CSSBs were high in Western countries, such as Canada, UK and USA.8 11 12 However, the sugar and energy content of CSSBs commonly consumed by the Chinese population are unclear.
In a single-serve CSSBs, the serving size will determine the total sugar content for consumers’ consumption.13 Several criteria can be used to evaluate the sugar content of CSSBs based on their serving size. In the UK, guidance on front-of-pack, colour-coded labelling used different colours to identify whether the sugar content of a beverage was high or not.14 In this guidance, two criteria for ‘Red’ labels were used to identify high-sugar content per 100 mL or per serving. The WHO15 and the Chinese Dietary Guidelines (CDG)16 recommended that a daily restriction of 25 g intake of free sugars would have additional benefits in reducing non-communicable diseases. In 2011, China’s Ministry of Health released the National Food Safety Standard for Nutrition Labeling of Pre-packaged Foods.17 However, the sugar content is not mandatory in nutritional labelling.18 Therefore, some CSSBs have sugar content and others have only carbohydrate content on the label.
Several countries have introduced sugar tax on SSBs to reduce the amount of sugar added. The UK’s sugar tax policy was announced in 2017 and will be implemented from April 2018. Despite the tax policy not yet being implemented, several manufacturers have already reformulated their products by reducing the sugar content.19 In China, there is no such policy and little data are available on the amount of sugar in SSBs.
We conducted a cross-sectional study to investigate the sugar and energy content of CSSBs sold in 15 different supermarkets in Haidian District, Beijing, China. The primary objective of the study is to investigate current sugar (carbohydrate) and energy content of CSSBs in Beijing, China. In addition, we compared the sugar content of CSSBs with the recommended levels of sugar intakes by the UK and the Chinese standard of nutrition labels, and compared the sugar levels of the same branded products in different countries.
Methods
From July to October 2017, we conducted a cross-sectional survey of product packaging and nutrient labels of CSSBs in Haidian District, Beijing.
Selection of supermarket chains
Data on supermarket chains in Haidian District, Beijing, were acquired from the location-based service, open-platform Amap,20 and included name, total number of branches and the addresses of each supermarket chain. First we included nine supermarket chains in this district which were in the top 10 Grocery Market Share of China. The ranking came from the Kantar Worldpanel research covering grocery purchasing habits in a representative sample of 40 000 households in China.21 Second we included supermarket chains with more than four branches, adding six supermarket chains to our study sites.
Altogether 15 supermarket chains were selected in this study (Wu Mart, Yonghui Superstores, Wal-Mart, Cuiwei, Merry Mart, Carrefour, Xingfu, Hualian, Century Mart, Chaoshifa, Jingkelong, Vanguard, Auchan, Shijijiajia and Shijihualian).
We investigated the nearest supermarket for each supermarket chain from our school campus. We assumed that the products were similar in different branches of each supermarket chain.
Selection and categories of CSSBs
Imported and local products, supermarket own label and branded products of CSSBs in 15 large supermarkets were included. Products labelled zero carbohydrate/energy or without nutrition labels were excluded.
CSSBs were categorised into the following types of flavours referring to the categories of CSSBs from a previous study in UK: cola, flavoured cola, ginger ale, orange, lemonade and others.8
Data collection
This study was conducted according to the protocol of a cross-sectional survey of the amount of free sugars and calories in CSSBs in the UK.8 We followed the methods used in this study to compare the sugar content of CSSBs between China and other countries. The product packaging and nutrient labels of CSSBs were recorded in a snapshot in time to obtain company name, product name, serving size, and nutrient content, that is, carbohydrate, sugar and energy. Although nutrient content per 100 mL was used in the Chinese standard of nutrient labels,17 we standardised nutrient content per 330 mL to make some comparisons with previous studies in different countries.8 11 12
When any CSSBs previously photographed were found again in a subsequent supermarket, its information was not photographed and recorded. We did not find any new product of CSSBs sold in the last two supermarkets (Shijijiajia and Shijihualian). For some branded CSSBs sold with the same formulation in different serving sizes, we only included the first recorded product with the same formulation.
To make some comparisons of CSSBs in different countries, several brands of CSSBs were specifically analysed in this study. Five brands (Coca-Cola, Sprite, Fanta, Pepsi Blue and Mirinda) were chosen because they were the top 5 brands in terms of sales in China and took up 83.8% volume of CSSBs sold in 2017.22 For each brand, we selected one representative product, including Coca-Cola Classic, Sprite, Fanta Orange, Pepsi Blue and Mirinda Orange. We looked up the nutrition labels of the same products online in two Western countries, namely the UK and USA. The UK will launch a taxation policy on beverages next year, while no national taxation policy has been made in the USA.
Statistical analyses
The EpiData software was used for data entry and all data were double-checked. A further 5% of entries were randomly selected and rechecked against the original source, and no error was found.
Spearman’s rank correlation coefficient was used to reflect the relationship between carbohydrate and sugar content. For CSSB labels not showing sugar content, we used the carbohydrate content as substitute because the carbohydrate content is very similar to the sugar content of CSSB products. The carbohydrate and energy content per 100 mL and per 330 mL of CSSBs overall and within each flavour type were described using median and IQR. Differences among types of flavour were explored using Kruskal-Wallis tests.
The sugar content within the recommended levels of sugar intake by the UK and China standard was described using frequency. We categorised each CSSB into three groups according to the sugar per 100 mL criteria of the UK guidance on front-of-pack, colour-coded labelling for drinks14: (1) red: >11.25 g/100 mL, (2) amber: >2.5 g and ≤11.25 g/100 mL, and (3) green: ≤2.5 g/100 mL. Differences in serving size among the three types were explored using Kruskal-Wallis test. Because the serving sizes ranged from 200 mL to 750 mL, we identified the CSSBs with or without ‘red’ label for sugars per serving (>13.5 g/serving if serving size >150 mL) according to the serving criteria of the UK guidance. The recommendation for daily sugar intake from the WHO15 and the CDG16 was 25 g, so we also identified the CSSBs with or without carbohydrate content <25 g/serving.
According to the Chinese standard of nutrition labels,17 we also identified the CSSBs meeting or not meeting the nutrition claim of low sugar (carbohydrate ≤5 g/100 mL).
To compare the same branded products in different countries, we listed the sugar and energy content per 100 mL in the five CSSBs produced from three countries (China, UK and USA).
All statistical analyses were conducted using SAS V.9.4 software. A p value <0.05 was considered statistically significant.
Patient and public involvement
Patients were not involved because this study included no human participants.
Results
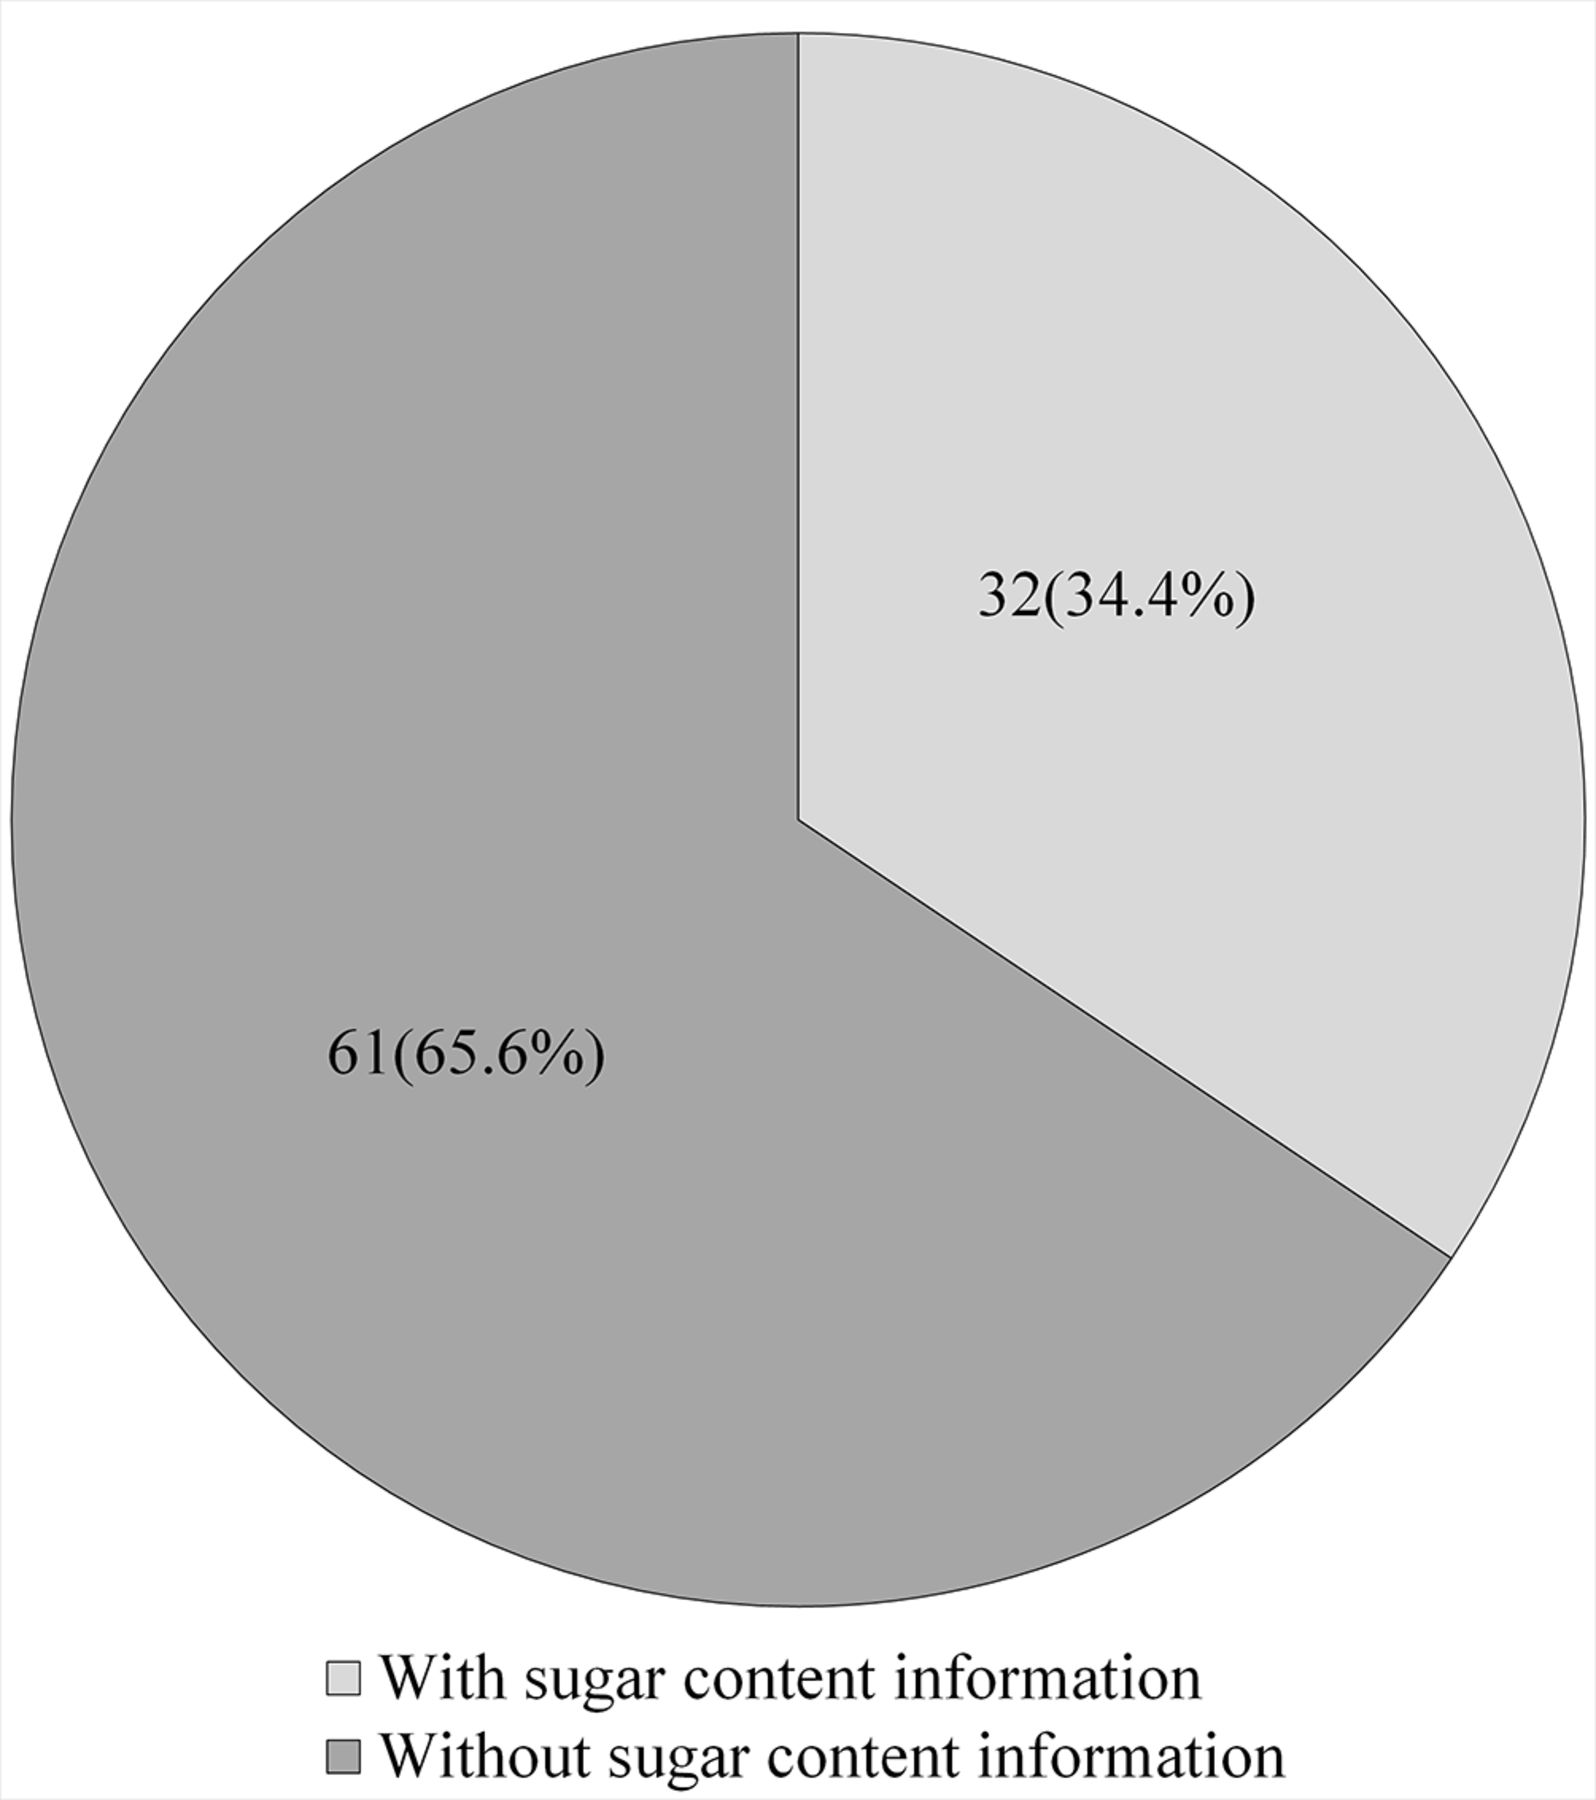
As shown in online supplementary figure 1, a total of 93 CSSB products in the 15 supermarkets in Haidian District, Beijing, were included in our analyses. The carbohydrate and energy content had a Spearman’s rank correlation coefficient of 0.9974 (p<0.0001). Figure 1 shows the sugar content information according to the Chinese standard of nutrition labels. Of 93 CSSBs, 32 (34.4%) had sugar content information on their nutrition labels, while others showed only carbohydrate content to reflect products’ sugar content. In these 32 CSSBs, the Spearman’s rank correlation coefficient between carbohydrate and sugar content was 0.9985 (p<0.0001). The paired difference between sugar and carbohydrate content was 0.05±0.17 g/100 mL.
Supplementary file 1
Sugar content information in Chinese CSSBs. In the 32 CSSBs with sugar content information, the Spearman’s rank correlation coefficient between carbohydrate and sugar content was 0.9985 (p<0.0001). The paired difference between sugar and carbohydrate content was 0.05±0.17 g/100 mL. CSSBs, carbonated sugar-sweetened beverages.
Table 1 shows the sugar and energy content of the included CSSBs. Overall, the median sugar content was 9.3 (IQR: 5.7–11.2) g/100 mL or 30.7 (IQR: 18.8–37.0) g/330 mL. The median energy content was 38 (IQR: 23–46) kcal/100 mL or 126 (IQR: 77–151) kcal/330 mL.
Description of median (IQR) sugar and energy content per 100 mL of CSSBs by different flavours
There were no statistical differences in sugar and energy content among the different types of flavours. More than half of CSSBs (n=51) were flavoured cola with a relatively lower median of 7.6 g/100 mL (25.1 g/330 mL) sugar and 31 kcal/100 mL (102 kcal/330 mL) energy content. Cola and lemonade CSSBs had relatively higher sugar and energy content, with the same median sugar content of 9.7 g/100 mL (32.0 g/330 mL), and similar median energy content of 39 kcal/100 mL (130 kcal/330 mL) and 40 kcal/100 mL (131 kcal/330 mL), respectively.
Figure 2 shows the proportion of different sugar contents per 100 mL and per serving in Chinese CSSB products according to the UK criteria set for sugar intake. As for sugar content per 100 mL, there were 7 CSSBs (7.5%) with ‘Green’ labels, 65 (69.9%) with ‘Amber’ labels and 21 CSSBs (22.6%) with ‘Red’ labels, according to the criteria of sugar per 100 mL in the UK front-of-pack, colour-coded labelling (shown in figure 2A).

Different types of Chinese CSSBs using the UK front-of-pack, colour-coded labelling. (A) Proportion of three UK front-of-pack, colour-coded groups in Chinese CSSBs. The three groups were categorised according to the 100 mL criteria of the UK guidance on front-of-pack, colour-coded labelling for drinks: (1) red: >11.25g/100 mL, (2) amber: >2.5 g and ≤11.25 g/100 mL, and (3) green: ≤2.5 g/100 mL. (B) Proportion of Chinese CSSBs with ‘Red’ label per serving in the three UK front-of-pack, colour-coded groups. The serving criteria of the UK guidance on front-of-pack, colour-coded labelling for drinks was >13.5 g/serving if the serving size is >150 mL. (C) Proportion of Chinese CSSBs with sugar content exceeding the WHO recommendation in three UK front-of-pack, colour-coded groups. The recommendation for daily sugar intake from the WHO was 25 g, so we also identified CSSBs with or without carbohydrate <25 g/serving. CSSBs, carbonated sugar-sweetened beverages.
The median serving sizes in CSSBs with ‘Green’, ‘Amber’ and ‘Red’ labels were 450 mL, 330 mL and 500 mL, and they had significant difference (shown in online supplementary table 1). None of the ‘Green’ CSSBs, 58 of 65 (89.2%) ‘Amber’ CSSBs and all 21 ‘Red’ CSSBs have received ‘Red’ label per serving based on the serving criteria in the UK (shown in figure 2B). Among the 93 CSSBs, 62.4% of their sugar content per serving exceeded the WHO daily free sugar intake recommendation. None of the ‘Green’ CSSBs, 37 (56.9%) ‘Amber’ CSSBs and all 21 ‘Red’ CSSBs exceeded the WHO recommendation (shown in figure 2C).
Figure 3 shows the nutrition claim of low sugar in the CSSBs according to the Chinese standard of nutrition labels. Of 93 CSSBs, there were 22 (23.7%) meeting the Chinese nutrition claim criteria of low sugar. In these 22 CSSBs, 68.2% (n=15) were ‘Amber’ CSSBs and 31.8% (n=7) were ‘Green’ CSSBs according to the UK criteria. The rest of the 71 CSSBs did not meet the criteria for low sugar, 70.4% (n=50) were ‘Amber’ CSSBs and 29.6% (n=21) were ‘Red’ CSSBs.

Nutrition claim of low sugar in Chinese carbonated sugar-sweetened beverages. According to the Chinese standard of nutrition labels, the criterion for nutrition claim of low sugar was carbohydrate ≤5 g/100mL.
Table 2 shows the comparison of sugar and energy content of five branded CSSB products in China, UK and USA. For the Coca-Cola Classic, the USA product showed the highest sugar content of 11.0 g/100 mL but the lowest energy content of 39 kcal/100 mL. Sprite, Fanta Orange and Pepsi Blue in the UK showed the lowest sugar content of 6.6 g/100 mL, 4.6 g/100 mL and 11.0 g/100 mL, and the lowest energy content of 28 kcal/100 mL, 19 kcal/100 mL and 41 kcal/100 mL. Mirinda Orange in China showed the highest sugar content of 9.6 g/100 mL and energy content of 39 kcal/100 mL.
Comparison of sugar and energy content of carbonated sugar-sweetened beverages among China, the UK and the USA
Discussion
To our knowledge, this is the first cross-sectional survey on CSSB products sold in Chinese supermarket chains. Our results provide valuable data on the current sugar and energy content of CSSBs, which provide evidence for future work on reducing the large amount of sugar added to CSSBs and reducing the consumption of CSSBs in China.
In this study, carbohydrate content was used to substitute sugar content of Chinese CSSBs, and we found that sugar content was similarly high when it was compared with those in Western countries. The average free sugar of CSSBs in the UK was 30.1±10.7 g/330 mL.8 In Canada, the mean total sugar of pop/soda and iced teas with added sugar was 10.6±5.0 g/ 100 mL,23 while in the USA the median added sugar content in caloric sodas/energy drinks was 11.3 g/ 100 mL.12 The high sugar content suggested that there is a global challenge, including China, to control the high levels of sugar in CSSBs.
We also found high sugar content in CSSBs accompanied by high energy content. A positive relationship of nearly linear pattern between sugar and energy content was found in this study, which was similar to those of Canadian soft drinks.11 Both in China and the UK, the average energy content per 330 mL CSSBs was around 126 kcal,8 which was >5% total energy intake in a person of healthy body weight consuming 2000 kcal per day.24 Sugar contributed most of the energy in the CSSBs, and higher consumption of CSSBs might result in higher energy intakes, and subsequently higher weight gain and other cardiovascular diseases.25
Some types of flavours of CSSBs had higher sugar content, and they also took larger share of off-trade value sales in China. The cola flavour showed relatively higher sugar, which was similar in a study carried out in the UK.8 In 2017, 10 099.4 million litres of CSSBs were sold while 4765.9 million litres were cola flavour,22 which might lead to larger sugar intakes. Furthermore, the lemonade flavour of CSSBs also had higher sugar content, and 72.7% volume of non-cola-flavoured CSSBs sold in China were lemonade flavour.22 More than half of the CSSBs were flavoured cola with different juice flavours. Previous studies suggested that Chinese children enjoy juice beverages,3 4 which may result in Chinese companies producing more CSSBs with juice flavours.
Serving size is an important factor that influences the sugar content of CSSBs. Although in China the proportion of ‘Red’ CSSBs was only 22.6% according to the UK 100 mL criteria, we were more concerned about the 65 ‘Amber’ CSSBs instead of the ‘Red’ ones because of their higher sugar content per serving. According to the UK serving criteria, 89.2% of ‘Amber’ CSSBs were labelled ‘Red’, and more than half of ‘Amber’ CSSBs exceeded 25 g sugar, which was the daily recommendation from WHO15 and CDG.16 These findings may be due to larger serving sizes in ‘Amber’ CSSBs, leading to higher sugar content per serving. Large serving sizes of nutrient-poor but energy-dense beverages may be an important contributor to obesity, especially among children.13 As for children, the serving size influenced beverage consumption because children consumed more when more beverages were provided.26 There were few ‘Green’ CSSBs with proper serving size and they did not exceed the recommendations. However, it was not the best option to drink these products too much because they will cause similar problems. The most important concern is that the sugar content of CSSBs may be too high for children. Since the serving size of the included CSSBs ranged from 200 mL to 750 mL, it is necessary to restrict the serving sizes of some CSSB products in China.
Improvement in the Chinese standard of nutrition labels is needed. First, only 32 (34.4%) CSSBs had sugar content information in their nutrition labels. Sugar was not obligatory in the Chinese nutrition labels, which was compulsory in other countries, such as the UK14 and USA.27 Sugar content information was the most important criterion for adults and children to assess the healthiness of a beverage,28 which highlighted the limitation of the voluntary policy in China and promotion of better nutrition labelling.18 Second, some of the CSSB products meeting the criterion of the Chinese nutrition claim were also ‘Amber’ CSSBs, suggesting that the current Chinese standard of low sugar was set up higher than the UK criteria.
Although some national brand companies, for example, Coca Cola and PepsiCo, took the largest market shares in different countries, the nutrition labels of the same products were different. This raised more concern on the importance of setting the same nutrition label system for beverages across different countries. It seemed strange that the classic Coca-Cola in the USA showed higher sugar but lower energy content. However, we found that the sugar written in the table of ingredients was different (fructose syrup and white granulated sugar in China, sugar in the UK, high fructose corn syrup in the USA), which may lead to the different energy content since different countries use different sugars. The lower sugar and energy content of CSSBs in the UK may have resulted from the early success of a new policy of a two-tiered Soft Drinks Industry Levy (SDIL). The SDIL was adopted to drive product reformulation and lower sugar consumption. Before the SDIL came in the UK, manufacturers began to reformulate their products in advance to avoid taxation.19 Although not all states in the USA had launched related policy, prediction model suggested that taxation was effective in controlling SSBs.29 This raised concern whether there were differences in the same products of CSSBs among different countries under different policy environments. The results of the study suggested that Chinese government could learn from the experience in the UK and launch stricter policy on beverages.
Based on our study, we put forward some suggestions for the reduction of sugar in CSSBs. First, reducing sugar in CSSBs will be an effective method because a 40% reduction in sugar instead of substitution would effectively reduce overweight, obesity and type 2 diabetes according to a prediction model in the UK.30 Although artificial beverages have no calories, they were unlikely to be healthy alternatives to CSSBs.31 Water may be the best substitute for CSSBs since they have no sugar and artificial sweeteners.16 Second, restriction of serving size on single-serve CSSBs is also needed, especially for those with ‘Red’ and ‘Amber’ labels in China. In Australia, the restriction of 375 mL serving size on single-serve SSBs predicted reduced mean body weight of 0.12 kg and an estimated cost offset of $A750.8 million.32 Third, to better improve the Chinese standard of nutrition labels, enforcement of labelling sugar information and lowering the criteria of nutrition claim of low sugar should be used to control sugar intake from CSSBs, even in all packaged beverages and food. Finally, taxation could lead to a significant reduction in CSSB consumption. A tax on beverages could substantially reduce body mass index and healthcare expenditures, and increase healthy life expectancy as demonstrated by Long et al 29 and Stacey et al.33 Taxation on sugar will also be effective in pushing the manufacturers to reformulate their products.19
Some limitations to this study should be considered. First, the study was cross-sectional based on the available CSSB packaging and nutrition labels in 15 large supermarkets of one district in Beijing. CSSB products are also available to the public online and in other smaller independent stores. However, we included supermarkets in this district according to their quantity and quality (market shares). Besides, we had included the top 7 brands of CSSBs and most of their series products, which took up 91.8% of volume sold in 2017.22 Second, carbohydrate content was used to substitute sugar content of CSSBs in this study, but the carbohydrate and sugar content might not be the same. Nevertheless, in the 32 CSSBs with sugar content in their nutrition labels, the Spearman’s rank correlation coefficient between carbohydrate and sugar content was 0.9985, which suggested high correlation. The paired difference between sugar and carbohydrate content was 0.05±0.17 g/ 100 mL, so the results of the study well reflected the sugar content of CSSBs in China.
Conclusion
CSSBs in Beijing, China have high sugar and energy content, and their large serving sizes contributed to higher levels of sugar per single-serve beverage. The current Chinese standard of nutrition label needs further improvement and enforcement of labelling sugar information and the criteria of nutrition claim of low sugar. Cross-country comparisons of CSSBs suggested that taxation policy may be useful in reducing the sugars in CSSBs. Overall, reduction in sugar and serving size of CSSBs, improvement in the Chinese nutrition label, and taxation policy on beverages will be beneficial in reducing sugar intake in China.
Acknowledgments
We sincerely thank Xuefei Wang, Tianjiao Li and Lan Cheng for their assistance with this work.
References
Footnotes
FJH and HW contributed equally.
Contributors HW, FJH had full access to all of the study data, and takes responsibility for the integrity of the data and the accuracy of the data analysis. Study concept and design: LL, HW. Acquisition, analysis or interpretation of data: LL, CL, CJ, YP, KMH, FJH, GAM, HW. Drafting of the manuscript: LL. Critical revision of the manuscript for important intellectual content: LL, CL, CJ, YP, KMH, FJH, GAM, HW. Administrative, technical or material support: HW, FJH. Study supervision: HW.
Funding This work was supported by grants from Beijing Natural Science Foundation (grant number 7162106) and the National Natural Science Foundation of China (grant number 81573170).
Competing interests KMH is an employee of Consensus Action on Salt, Sugar and Health (CASSH), a non-profit charitable organisation. FJH is a member of the Consensus Action on Salt and Health (CASH) and its international branch World Action on Salt and Health (WASH). FJH does not receive any financial support from CASH or WASH. GAM is Chairman of Blood Pressure UK (BPUK), Chairman of CASSH and Chairman of WASH. BPUK, CASSH and WASH are non-profit charitable organisations. GAM does not receive financial support from any of these organisations.
Patient consent Not required.
Ethics approval Ethical permission was not required for this survey because it included no human or animal participants.
Provenance and peer review Not commissioned; externally peer reviewed.
Data sharing statement No additional data are available.