Article Text

Abstract
Objectives To comprehensively survey the sugar and nutrient contents of yogurt products available in UK supermarkets, in particular those marketed to children.
Design A cross-sectional survey of yogurt products available in the UK’s supermarkets in November 2016.
Methods Data were collected from five major online UK supermarkets and a process flow strategy was used to place yogurts into eight categories: children’s, dairy alternatives, dessert, drinks, fruit, flavoured, natural/Greek style and organic. A comprehensive database of product information for 921 unique products was created and analysed.
Results The total sugar, fat, protein, calcium and energy contents were highly variable across categories, and the ranges were extremely broad. Although lower than the dessert category, the medians (range) of the total sugar content of children’s (10.8 g/100 g (4.8–14.5)), fruit (11.9 g/100 g (4.6–21.3)), flavoured (12.0 g/100 g (0.1–18.8)) and organic (13.1 g/100 g (3.8–16.9)) yogurt products were all well above 10 g/100 g, and represented >45% of total energy. Only two out of 101 children’s yogurt and fromage frais products surveyed qualified as low sugar (≤5 g/100 g). Natural/Greek yogurts had dramatically lower sugar contents (5.0 g/100 g (1.6, 9.5), largely lactose) than all other categories. While low-fat (<3 g/100 g) products had less sugar and energy than higher fat yogurts, nonetheless 55% (285 of 518 low-fat yogurts) contained between 10 and 20 g sugar/100 g. Within the children’s category, fromage frais had higher protein (5.3 g/100 g (3.3, 8.6) vs 3.2 (2.8, 7.1); p<0.0001) and calcium contents (150 mg/100 g (90, 240) vs 130.5 mg/100 g (114, 258); p=0.0015) than yogurts.
Conclusions While there is good evidence that yogurt can be beneficial to health, products on the market vary widely in total sugars. Fewer than 9%, and only 2% of the children’s, products surveyed were low enough in sugar to earn ‘green’ in UK front of the pack labelling. Reformulation for the reduction of free sugars in yogurts is warranted.
- yogurts
- sugar
- children
- obesity
This is an open access article distributed in accordance with the Creative Commons Attribution Non Commercial (CC BY-NC 4.0) license, which permits others to distribute, remix, adapt, build upon this work non-commercially, and license their derivative works on different terms, provided the original work is properly cited, appropriate credit is given, any changes made indicated, and the use is non-commercial. See: http://creativecommons.org/licenses/by-nc/4.0/.
Statistics from Altmetric.com
Strengths and limitations of this study
This was a comprehensive market survey that analysed the nutrient contents of 921 supermarket products identified by the search term yogurt/yoghurt in five major UK supermarkets, representing 75% of UK grocery market share, online in November 2016.
A systematic process flow strategy was determined a priori and used for categorising products.
The energy and nutrient contents of products within categories are individually presented readily permitting differences and ranges between categories to be seen.
Products were identified by supermarket categorisation and some products included in this market survey for completeness did not contain yogurt cultures (eg, fromage frais, desserts), which may have skewed results.
The nutrient information used here came from the manufacturers and supermarkets online and may not have been accurate or up to date; and the survey did not include less well-known yogurt brands, produced or sold by small-scale local food manufacturers, or yogurts sold in dessert shops.
Introduction
The association between dairy foods and disease risk has often been contradictory, likely due to inherent diversity in the nutrient contents and food matrices of different dairy products.1 Yogurt is the product of milk fermented with the lactic cultures Streptococcus thermophiles and Lactobacillus delbrueckii subsp bulgaricus, which can be enhanced with other probiotic cultures such as Lactobacillus acidophilus and Bifidobacterium bifidus.2 Consumption of fermented dairy products has long been considered to be beneficial to digestive and overall health.3 The beneficial probiotic and immune regulatory effects of yogurts underpin their recommendation as a healthy food for babies and children.4 Multiple regulatory bodies, including the European Food Safety Authority, have approved health claims related to yogurt consumption and reduction in symptoms caused by lactose maldigestion.5 In addition to probiotics, yogurt is a good source of protein, calcium, iodine and vitamin B12, and its consumption has been associated with lower risk of obesity and cardiometabolic risk in both children and adults.6 7
Evidence is accumulating that frequent yogurt consumption may be associated with healthier metabolic profiles in both children and adults.8 9 In adults, increased yogurt consumption has been associated with lower levels of circulating triglycerides, glucose and lower systolic blood pressure9; and several recent meta-analyses have demonstrated that increased yogurt consumption is inversely associated with the risk of developing type 2 diabetes (T2D).10–13 Notably, across three large American cohort studies (the Health Professionals Follow-Up Study and the Nurses’ Health Studies I and II) in >190 000 adults and >30 years of follow-up, while there was no effect of dairy on incident T2D, yogurt intake specifically was inversely associated with T2D risk across the three cohorts with a pooled HR of 0.83 (0.75, 0.92) for one serving/day.12 Although confounders were statistically accounted for, an acknowledged limitation to these epidemiology studies is the evidence that yogurt is a general marker of healthy dietary habits.9 14 Data are more equivocal regarding yogurt consumption and cardiovascular disease risk, although one study suggested a possible lowered risk at higher levels of yogurt intakes (>200 g/day),15 a more recent and comprehensive meta-analysis showed no benefit.16 High-quality and adequately powered randomised controlled trials are lacking however.
Prospective cohort studies have, in general, shown inverse associations between yogurt intakes and changes in waist circumference, weight and risk of overweight or obesity; with some inconsistencies between studies.17 18 More recently, in an elderly Italian population cohort of >4000 at high cardiovascular risk, consumption of whole-fat yogurt (but not total yogurt) was associated with changes in waist circumference and higher probability for reversion of abdominal obesity and lower risk of diabetes.19 20 This is in line with a previous systematic review of observational studies on the relationship between dairy fat, obesity and cardiometabolic disease; in 11 of 16 studies included in the review, high-fat dairy intake was inversely associated with measures of adiposity.21 While dietary guidelines vary by region, most countries make dietary recommendations for the consumption of dairy products because of the strong evidence for the role of dairy products in meeting nutrient intake requirements.22 In both the USA and UK, current dietary guidelines recommend low-fat and low-sugar dairy products because of obesity-related concerns; however, a growing number of recent studies suggest that high-fat dairy consumption is associated with a lower risk of obesity and diabetes.21 23–25 Large cohort studies in Sweden (n=1782 men 40–60 years old)23 and the USA (n=18 438 women ≥45 years old in the Women’s Health Study)24 have found high-fat dairy to be protective against developing central adiposity and becoming overweight or obese at follow-up. These data have fed into ongoing wider debate regarding dietary guidance related to fat, refined carbohydrates and cardiovascular disease risk.26
In the UK, on average, children consume more yogurt than adults, and children under 3 years of age have the highest intakes.27 Yogurt contributes a significant percentage of the daily Reference Nutrient Intake of key nutrients to babies and children up to 10 years of age, providing, for example: 10%–19% calcium, 11%–20% phosphorus, 10%–21% riboflavin and 17%–54% vitamin B12.27 Yogurts are often recommended to be part of children’s diets due to their high calcium content and its positive effect on bone development.28 Calcium also has a positive effect on teeth and high intakes of milk and yogurt products in multiple studies have been associated with reduced tooth erosion.29 However, although there is good evidence to suggest that yogurt can be beneficial to health, products on the market may vary widely in sugar content and yogurt marketed specifically to children may be higher in free or added sugars (see table 1 for definitions of free, added and total sugars).30 31 Dairy is a significant contributor to the intakes of free sugars by children and adults.32 Diets high in free sugars are now unequivocally linked to obesity and dental caries, prompting the WHO and other regulatory bodies in updating dietary guidelines to strongly advocate for restricting free sugar intakes to less than 10% of total energy.33 34 With an alarming 58% of women and 68% of men along with one in three of UK children aged 10–11 years overweight or obese in 2015,35 the UK’s guidelines more stringently recommended the restriction of free sugars to less than 5% of total daily energy.36 As part of a plan to combat childhood obesity, in April 2018 the UK government implemented an industry soft drinks levy and commissioned a structured programme of monitored sugar reduction as part of wider reformulation tackling calories, salt and saturated fat.37 The initial focus was on the top nine food categories (after soft drinks and fruit juices and smoothies) that contribute the most to children’s sugar intakes. These are: chocolate, confectionery, biscuits, breakfast cereals, cakes, morning goods (such as croissants, buns and waffles), ice cream, yogurt and sweet spreads/sauces. yogurt was one of the products identified and highlighted for a 20% reduction of sugar by 2020, with guidelines given for energy per portion size of 120 kcal sales weighted average; 175 kcal maximum per portion and an allowance made for lactose (3.8 g/100 g).37
Definitions
In this context then, the aims of this work were to perform a comprehensive survey of yogurt products within the major UK supermarkets, in order to identify products marketed at children and to evaluate their nutrient contents, in particular sugar, compared with other categories.
Experimental methods
Data collection
Data were collected from five major UK online supermarkets (Asda, Morrisons, Sainsbury’s, Tesco and Waitrose) that account for 75% of the UK grocery market share.38 Websites were searched from 7 October 2016 to 16 November 2016 using ‘yogurt’ or ‘yoghurt’ as a search term (in four of five supermarkets the same number of products was returned). After considering the product groupings commonly used by online supermarkets, eight categories (children’s, dairy alternatives, dessert, drinks, flavoured, fruit, natural/Greek, organic) and a systematic process flow strategy for product placement (figure 1) were decided on a priori. These product groupings, and those typically used by supermarkets for both inventory and marketing reasons, go beyond the standard broad subgroupings used in dietary surveys such as the UK National Dietary and Nutrition Survey (NDNS), where the main food group ‘15: yogurt, fromage frais and other dairy desserts’ has only three broad subsidiary groups of either: ‘yogurt’; ‘manufactured fromage frais and other dairy desserts’; or ‘homemade fromage frais and other dairy desserts’.39 As dairy desserts for the NDNS include ‘chocolate and fruit cream desserts, mousse, milk jelly, junket, buttermilk desserts, fruit fools, crème caramel, panna cotta, chilled soya desserts, quark, egg custards’,39 we chose to include these products in the analyses here. Therefore, the dessert category contains both yogurt-based and other products (eg, jellies and puddings, ie, chocolate mousse, crème caramels) that contain no yogurt or fromage frais cultures. However, non-yogurt (eg, high-protein) drinks were removed from the nutrient analyses. Soya-based yogurts were placed in the ’dairy alternative’ category, whereas Greek-style yogurts with added honey or other sweeteners were placed in the ‘flavoured’ category. ‘Fruit’ was defined liberally, for example, many products were made with either curd or purees and for lemon products in particular, often with juice. In the case of natural yogurts, if organic, they went in organic category. In scrutinising the children’s category (products included were defined as ‘children’s’ if either the supermarket or product itself defined it as such, or if spokescharacters, celebrities, cartoons, toy giveaways, games or kids’ clubs were incorporated into brand image), the ingredient lists were used to evaluate presence or absence of yogurt or fromage frais cultures.
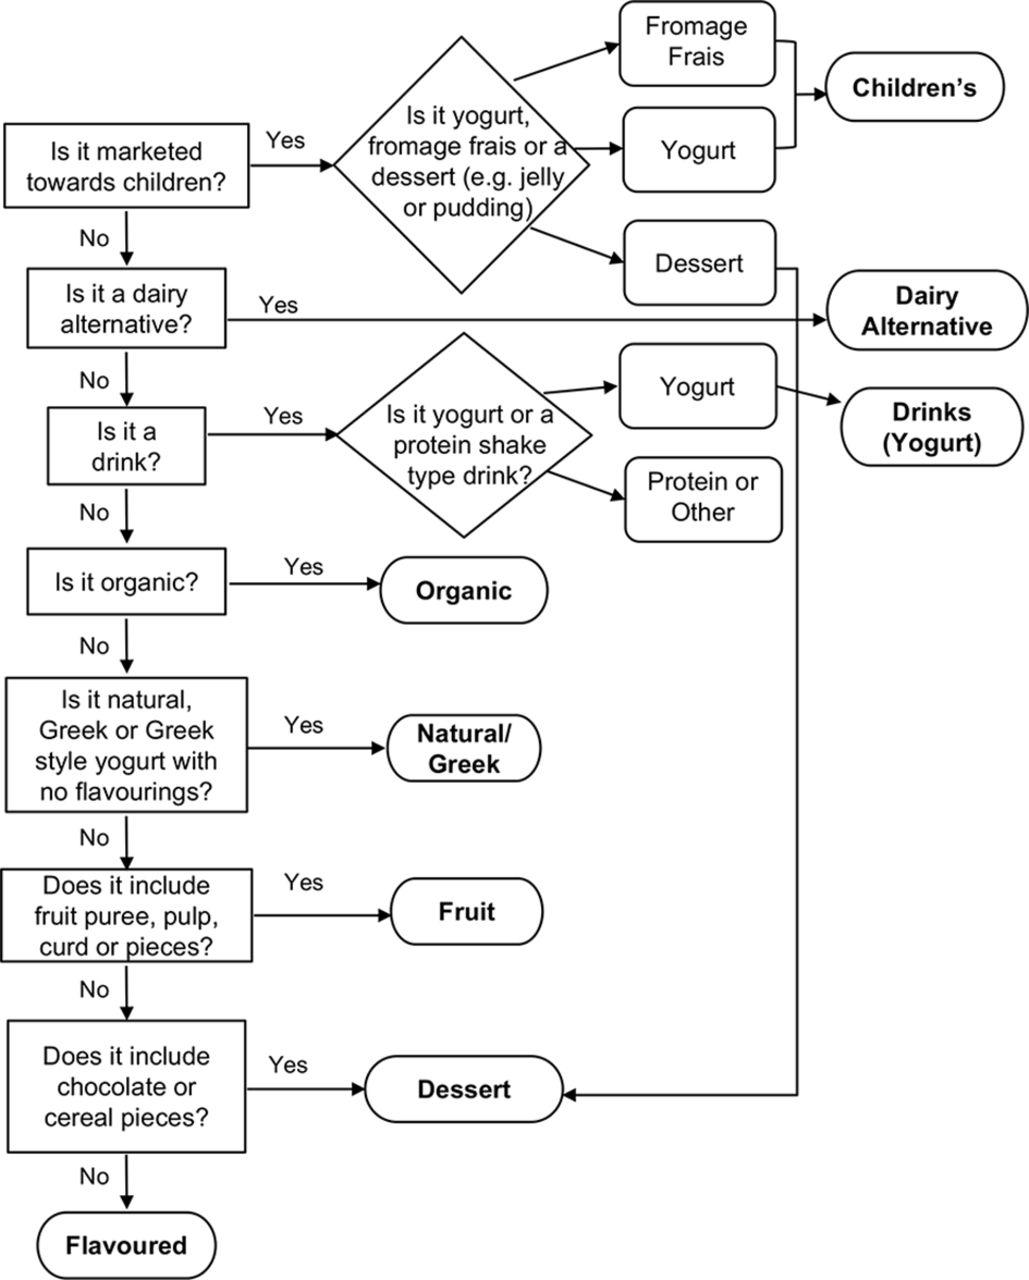
Process flow diagram of category decisions. Data were collected using yogurt as a search term within the UK’s top five online supermarkets between 7 October 2016 and 16 November 2016. Products were classified into different categories as shown.
For the classification of low fat and low sugar, the cut-offs defined by European Union (EU) regulations2 currently used for voluntary, front-of-pack, traffic light coloured labels in the UK40 were used. In this scheme, green designates low, amber designates medium and red designates high levels of reference intakes. Low fat is defined as ≤3 g of fat/100 g or ≤1.5 g/100 mL for drinks; low sugar is defined by a maximum of 5 g total sugars/100 g. For labelling, high fat and high sugar (red) are defined at >17.5 g fat/100 g and >22.5 g sugar/100 g, respectively. Notably for sugar, the current EU reference intakes are for 90 g sugar in a 2000 kcal diet; this represents 18% of total energy from sugars and is much higher than the recent UK and WHO targets of 5%–10% of energy from free sugars (25–50 g sugar/day in a 2000 kcal diet).2 40
Data were screened for duplicates and a non-redundant database of product information was created that included: nutrient information, serving size, size of pack, claims on pack and ingredients. Nutrient information was confirmed from the brand’s own website where possible and a subset was examined during in-store visits. Information on macronutrients, including energy, fat, saturated fat, carbohydrates, sugar, fibre and protein, was collected, as well as any information on micronutrients. Data for macronutrients have been expressed as g/100 g product as well as % energy, as both are needed to evaluate its nutritional merits; for example, a yogurt with a lower energy content per 100 g may have a higher % energy from sugar than a product with a higher energy content. All data were independently double-checked and 5% of all entries were randomly selected and verified.
Data analysis
Pivot tables in Excel were used for building and manipulating the product database and statistical analyses were done utilising GraphPad Prism V.7.0 c. Normality was examined using the D’Agostino-Pearson omnibus normality test and comparisons across all categories were made using the non-parametric Kruskal-Wallis test with Dunn’s multiple comparisons. For comparisons of two categories, again in not observing normal distributions, the non-parametric, two-tailed Mann-Whitney tests were applied.
Patient and public involvement
Patients and the public were not involved in this research.
Results
Nine hundred and twenty-one products identified online during the period of the survey were initially included in the analysis. At the time of survey, although national branded products dominated the products available (n=648 national vs n=273 own brand products), only 65 products were available in all five supermarkets. Following the process flow strategy (figure 1) removed 23 non-yogurt, for example, high protein type, beverages from the analyses and the remaining 898 products were classed as either: children’s (n=101), dairy alternatives (n=38), dessert (n=161), drinks (n=70), flavoured (n=79), fruit (n=317), natural/Greek (n=61) or organic (n=71).
In assessing nutrient contents across the surveyed products, the sugar content varied enormously both within and across our product categories (figure 2A). With the exception of the natural/Greek category, the median total sugar contents of all categories were well above the 5 g/100 g maximal threshold considered for a low-sugar nutrition label claim.2 40 Products within the dessert category, unsurprisingly, had the highest median and broadest (range) of total sugar at 16.4 g/100 g (1.5–32.6) (figure 2A). However, the children’s, flavoured, fruit and organic categories all had relatively high, and similar, median total sugar contents ranging from 10.8 g/100 g (children’s) to 13.1 g/100 g (organic). As the natural/Greek category by definition contained no added sweeteners, it had the lowest median amount of total sugars per product (5 g/100 g (1.6, 9.5)). These sugars will be ~80% lactose (table 1), but notably the range observed here suggests many products will have higher than the allowance of 3.8 g/100 g specified for lactose in the UK sugar reduction programme guidelines. The dairy alternatives and drinks categories also had total sugar medians higher than 5 g/100 g, nonetheless these were still significantly lower than the children’s, flavoured, fruit and organic categories with median (range) of 9.2 g/100 g (0.4–12.5) for dairy alternatives and 9.1 g/100 g (2.3–16.5) for drinks (figure 2A).

Nutrient and energy contents of UK yogurt products across categories. (A) Sugar. (B) Fat. (C) Protein. (D) Calcium. (E) Energy. (F) Energy/serving. Data were tested for normality and analysed using the Kruskal-Wallis and Dunn’s multiple comparison tests; categories with unlike letters were significantly different. Median is indicated by black line. Dashed lines indicate thresholds defined by European Union (EU) regulations2 for nutrition claims for low sugar (A) and low fat (B).
Somewhat in contrast to sugar, as seen in figure 2B, many yogurt categories (children’s, dairy alternative, drinks, fruit, natural/Greek) had median levels of fat lower than the thresholds considered ‘low-fat’ for nutrition claims (3 g/100 g for food and 1.5 g/100 mL for drinks).2 While flavoured and organic yogurts were just over this threshold with medians for fat of 3.6 g/100 g (0, 9.6) and 3.9 g/100 g (0, 10.1), respectively, the dessert category contained the highest median amount of fat and had the broadest range at 5.2 g/100 g (0–26.7) (figure 2B). The drinks category had the lowest median fat contents at 1.5 g/100 g (0, 3.0), but the fruit and natural/Greek categories were also relatively low with medians of 1.6 (0, 8.9) and 1.7 (0, 10.1) g/100 g, respectively (figure 2B).
The natural/Greek and the children’s categories had the highest median protein contents at 5.4 (2.2, 11.0) and 5.3 (2.8, 8.6) g/100 g yogurt (figure 2C). The higher protein median for the children’s category was influenced, as expanded on below, to a significant degree by a large percentage of higher protein fromage frais products. The dessert, fruit, flavoured and organic categories had very similar median protein contents at 4.0–4.5 g/100 g, whereas drinks and dairy alternatives contained the least amount of protein at 2.7 (1.3, 5.9) and 3.6 (0.6, 5.2) g/100 g (figure 2C). Calcium values were less frequently reported, but median values between yogurt categories were broadly similar ranging from 116 to 150 mg/100 g (figure 2D). Mimicking protein, the natural/Greek and the children’s categories had the highest calcium contents. The dessert category, again not surprisingly, contained significantly more energy/100 g (figure 2E) and more energy/serving (figure 2F) than any other category. Although the children’s category had the least energy/serving (figure 2F), this was clearly due to smaller serving sizes. When expressed as kcal/100 g, the median energy of children’s yogurts was similar to products in the dairy alternative, flavoured, fruit and organic categories (ranging from 79 to 100 g/100 g), and these were significantly higher than the median (65 g/100 g) of the natural/Greek category (figure 2E).
In examining the macronutrient content (as % energy) of yogurts across categories, it was clear that the majority of carbohydrates in yogurt products are derived from sugars (table 2). Carbohydrate content ranged from the extremes of 34.7% (natural/Greek) to 62.4% (drinks) of energy content, but all other categories were tightly bunched at 48.5%–56.7% carbohydrate content. The natural/Greek category was significantly higher in protein (32.3%) than any other category, while the dessert category had the least amount of protein (10.8%) and highest percentage of fat (32.6%; table 2). Although fruit and flavoured yogurts had very similar sugar contents (table 2), fruit yogurts contained small, but appreciably more, amounts of fibre compared with flavoured or natural/Greek yogurts (0.3 (0, 2.4) vs 0 (0, 0.9) g/100 g).
Macronutrients across yogurt categories
It has previously been reported from an analysis of a US database that low-fat products, including yogurts, contain more sugar than their higher fat counterparts.41 However, in comparing products below (n=518) and above (n=380) the ≤3 g/100 g threshold for low-fat product labelling, we did not observe this here. Low-fat yogurt products had significantly lower amounts of sugar in comparison to higher fat yogurts (10.7 (0.1, 21.5) vs 13.1 (0, 32.6) g/100 g; figure 3A) and much lower median and tighter range of fat contents (1.4 (0–3.0) vs 5.5 (1.6–26.7) g/100 g; figure 3B). Low-fat yogurts contained more protein than higher fat products (4.3 (0, 11.0) vs 3.9 (0.1, 9.5) g/100 g; figure 3C) and much lower energy per 100 g (81 (28, 143) vs 125 (36, 445) g/100 g; figure 3D).
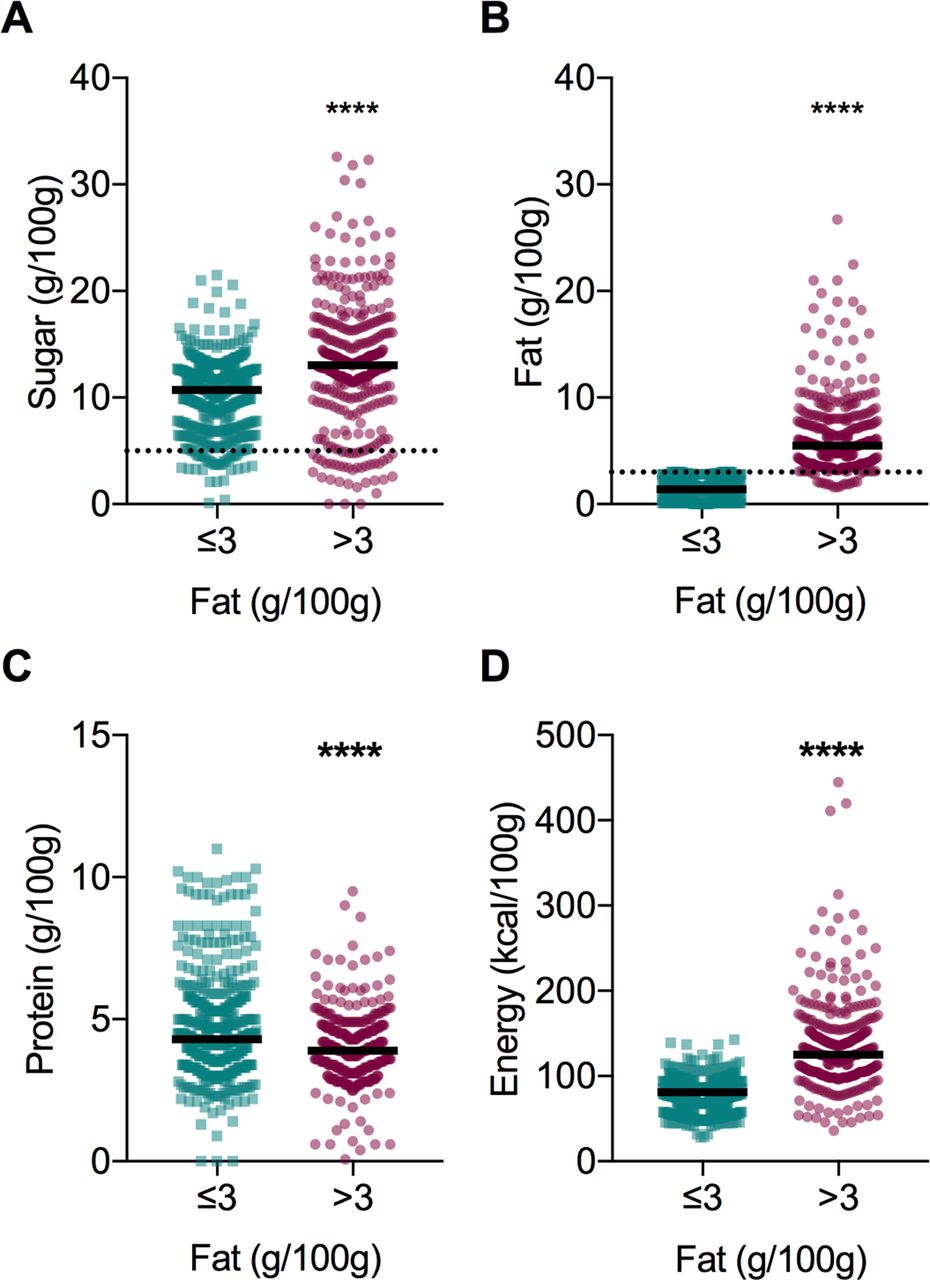
Macronutrients compared across low-fat (≤3 g/100 g; n=530) and higher fat (>3 g/100 g; n=383) products. (A) Sugar. (B) Fat. (C) Protein. (D) Energy. Data were tested for normality and analysed using the Mann-Whitney test. Median is indicated by black line. ****P<0.0001.
While fromage frais is also a fresh lactic fermented milk product, it is made with cheese cultures rather than yogurt cultures. In most of the categories, less than 5% of products were fromage frais and were not separated out. However, in the children’s category, fromage frais dominated, representing 60% of products (n=62 vs n=39 yogurts) so their nutrient contents were assessed separately (figure 4). While there was no difference in the sugar content of children’s yogurt and fromage frais (figure 4A), fromage frais products had lower fat (figure 4B; p<0.0001), higher protein (figure 4C; p<0.0001) and higher calcium (figure 4D; p<0.01) contents compared with children’s yogurts. Although there was no difference in energy/100 g (figure 4E), the energy/serving was significantly lower for fromage frais (figure 4F; p<0.0001) reflecting its often smaller serving size.

Nutrients in children’s yogurt (n=39) and fromage frais (F Frais; n=62) products. (A) Sugar. (B) Fat. (C) Protein. (D) Calcium. (E) Energy. (F) Energy/serving. Data were tested for normality and analysed using the Mann-Whitney test. Median is indicated by black line. **P<0.01; ***P<0.001; ****P<0.0001.
Discussion
We have comprehensively evaluated yogurt products sold in the major UK supermarkets in November 2016, examining nutrient contents across categories, including those products marketed to children. Our results highlight that the total sugar content of yogurts is relatively high in all categories, with the exception of natural/Greek yogurts. Very few products, less than 9%, qualified for a low-sugar (≤5 g/100 g) claim for front-of-pack labelling, and almost none in the children’s category. This is concerning given both the continued increase in childhood obesity and prevalence of tooth decay among children starting school (28%).42 Tooth extractions are shockingly the primary reason children aged 5–9 are admitted to hospital with general anaesthetic in the UK.43 Moreover, in 2015/2016 more than one in five children in Reception (ages 4–6), and one in three children in Year 6 (ages 10–12) were measured as obese or overweight in England.44 While yogurt may be less of a concern than soft drinks and fruit juices, the chief sources of free sugars in both children and adult’s diets,39 what is worrisome is that yogurt, as a perceived ‘healthy food’, may be an unrecognised source of free/added sugars in the diet. Indeed, a potentially surprising observation from our data was that, after the dessert category, it was organic yogurts that had the highest median sugar content (13.1 g/100 g). While the organic label refers to production, the well-documented ‘health halo’ effect means that consumers most often underestimate the caloric content and perceive the nutritional contents of organic products, including yogurts, more favourably.45
An additional challenge for even an educated consumer is understanding that the total sugars on the label include, in the case of yogurt, the intrinsic milk sugar, lactose, plus sugars added as sweeteners during processing. UK labelling laws do not require the declaration of free sugars on nutrition labels and the UK’s sugar reduction guidelines focus on total sugars for this reason. Interestingly, although some have argued it is difficult to measure, the inclusion of added sugars (under total sugars) on food labels has been recently mandated in the USA; companies have until 2020 or 2021 to implement depending on their size.46 Notably, added sugars in the USA do not include the sugars in juiced or pureed fruits and vegetables that are defined as free sugars by the UK and WHO. It has been argued for public health purposes, the emphasis in communication should be free sugars,47 and it will be interesting to see how food product companies and consumers navigate these changes. Our study highlighted other potential challenges and mixed messages for consumers, arising from marketing and packaging. Many products that were suggested for children’s lunch boxes on supermarket websites were very high-sugar desserts (from jelly to dairy based) rather than yogurt or fromage frais. Retailers could play a positive role in promoting health here by establishing boundaries for inclusion in lunch box recommendations. Furthermore, the portion sizes for children’s yogurts varied enormously and were often identical to adult portion sizes. Equally there was little consistency in portion size in adult yogurts either, and particularly for larger pots (400–500 g) of yogurt the serving size was either not given or was different from the equivalent smaller pot of yogurts (100–150 g/serving). In multiple products with added plant stanols marketed for their cholesterol-lowering merits, none would meet a low-sugar claim and several were extremely high in sugar. In light of data linking high sugar consumption to high cholesterol levels,48 arguably these products should be scrutinised for reformulation with a view to potential added health benefits in terms of obesity and dental caries.
The UK guidelines for sugar reduction in the yogurt and fromage frais category do not apply to dairy desserts, natural/unsweetened yogurt/fromage frais and yogurt/dairy drinks (although ‘any sugar-sweetened yogurt and dairy drinks that are excluded from the soft drinks industry levy will become part of the sugar reduction programme’).37 But it was interesting to note the median of sugar content in plain, natural/Greek yogurts (5.0 g/100 g), which is predominantly lactose, was higher than the allowance of 3.8 g/100 g that the UK guidelines agreed on for lactose. It should be noted that the guidelines have been made, in consultation with industry, on sales weighted averages so are not directly comparable here. This is calculated by weighting the sugar level of individual products by their volume sales, so that high-selling products with high sugar levels will push sales weighted average upwards. For yogurt, the reported baseline sales weighted average was 12.8 g/100 g, with a 20% reduction aim for 11.0 g/100 g product; the report suggests reformulation, reducing portion size and shifting portfolio of sales are all viable mechanisms to help achieve this.37 While median sugar values are not directly comparable to sales weighted averages, our study suggests the organic (13.1 g/100 g), fruit (11.9 g/100 g) and flavoured (12.0 g/100 g) categories require the greatest changes. Children’s yogurt and fromage frais products had a somewhat lower median of sugar 10.8 g/100 g, possibly meeting government guidelines (not clear as not sales weighted). However, given the recommendations that 4–6 year-olds should have no more than 19 g of sugar a day, a single pot of yogurt can contribute substantially to sugar intakes of children. The sugar content of children’s yogurts and fromage frais varied dramatically and there was no difference between the sugar contents of yogurts and fromage frais per 100 g of product. However, as fromage frais has a much smaller serving size (median 47 g vs 90 g for yogurt), fromage frais products contained much less sugar per serving than yogurt (5.4 vs 9.2 g sugar/serving); with a single serving of yogurt on average delivering close to half of a child’s daily maximal recommended intake of sugar.
Reformulation is likely to be challenging; beyond acting as a sweetener, added sugar in foods acts as a bulking and colouring agent, and the use of sugar in foods is dictated by physical and chemical properties that are difficult to substitute.49 In addition, in general consumers ‘liking’ for yogurt is correlated positively with sweetness.50 Lactic fermentation yields a sour taste that sugar attenuates. Consumers have been shown to prefer yogurt containing 10%–13% added sugar but may accept products with 7% added sugar while rejecting products with 5% or less added sugars as too sour, or adding sweeteners (caster sugar, jam or honey) themselves before consuming.50–53 When Saint-Eve and colleagues53 precisely measured sugar added by 204 French subjects to natural yogurt they found on average participants added 13.6 g of sugar to their yogurts, more than total content of many commercial sweetened yogurts. Participants underestimated how much sugar they were adding but still perceived their addition of sweetener to be the healthier option.53
Although we have focused our attention on the sugar content of yogurts per se, it is important to consider other nutrients, not least because of the impact on the glycaemic response. Notably, our work illustrates that natural/Greek yogurts have a dramatically different macronutrient profile from all other categories, containing much higher protein (32.4% energy vs range of 10.8%–20%) and much lower carbohydrate (34.7% vs 48.5%–60.4%) than all other categories. The observed glycaemic index (GI) of yogurts is generally much lower than predicted values calculated from their carbohydrate contents, with unsweetened yogurts having the lowest GI of all; this is contributed both to the fact that lactose has a low GI, and because yogurts’ protein content will reduce the glycaemic response.54 Similarly, while some studies suggest lactose may be less cariogenic than other sugars,55 it is recognised that the food components in unsweetened dairy products provide a buffering capacity that is protective to teeth enamel.56 We might underscore, therefore, that it is yogurts sweetened with added sugars that are primarily of concern here. In particular perhaps, for young children who derive a significant amount of their free sugar intake, which does not include lactose, from yogurt products (12% for 1.5–4 year-olds and 6% for 4–10 year-olds),39 at a time when taste preferences are being established for life.57 Yogurt without added sugars remains a nutritious food for all ages and should ideally be introduced unsweetened during early childhood weaning. Although a drop in daily free sugars intake in the UK has been recently observed, currently consumption is well over 10% in all age groups, much higher than the 5% target.39 While clearly in terms of dietary sugar intakes and obesity or dental caries, yogurt is not the concern sugar sweetened beverages are, which contribute to 25%–40% of free sugar intake in 1.5–4 year-olds,39 nonetheless the rationale for reduction and reformulation across a broad range of products as part of a systemic approach to prevent obesity is robust.34 58
We had preconceived that low-fat yogurts would contain more sugar than their higher fat alternatives, in part because of a previous, short report from an American database analysis that showed low-fat products, including yogurts, contain more sugar than their higher fat counterparts.41 In contrast, low-fat products surveyed here had significantly lower sugar than higher fat products (10.3 vs 13.1 g/100 g in higher fat). However, we note that although low-fat products did have less sugar on average, nonetheless 55% of low-fat products had between 10 and 20 g sugar/100 g. With an energy intake of 2000 kcal/day, 5% of energy amounts to 25 g of sugar, and a single serving of yogurt in all categories surveyed, other than natural/Greek, can easily provide half or more of this. On the other hand, a 150 g serving of the median sugar (16.4 g/100 g) dessert product could provide a person the recommended 25 g daily limit of sugar. Nonetheless, low-fat products had lower energy, fat and sugar contents, and were slightly higher in protein, in comparison to higher fat products. This profile appears consistent with current UK and US dietary guidelines that recommend low-fat dairy products out of concerns for obesity and cardiovascular disease. It is notable that evidence is accumulating that higher fat, rather than low-fat, dairy is associated with a lower risk of obesity and diabetes,21 23–25 including several studies that suggest full fat milk is associated with reduced risk of overweight and obesity in children.25 59 60
The study has some limitations. We would have liked to have included products sold outside the five major online supermarkets but this would have created difficulties in data collections and setting the boundary of inclusion. However, the supermarkets included covered 75% of the grocery market and is therefore representative of the overall market, and as such provides a useful database for discussion. Ideally data collection should take place in as narrow a time frame as possible and we took only a month here. However, manufacturers may have made changes to products since this snapshot and it would be interesting to repeat the survey in future years. As nutrient data were collected from online information, provided by supermarkets or the brand’s own website, these data may not always be up to date or accurate. We did not incorporate analysis of price here; it would be interesting to assess if sugar or other nutrients relate to price.
Conclusions
While there is good evidence that yogurt can be beneficial to health, products on the market vary widely in nutrient content. In a comprehensive survey of the UK supermarket yogurt products, we highlight here that the median sugar contents of children’s, fruit, flavoured and organic yogurt categories were well above 10 g/100 g and represented >45% of total energy derived. Organic yogurts (including organic yogurt with added fruit or flavourings, and so on) had the highest median sugar content (13.1 g/100 g). Notably, natural/Greek yogurts had a dramatically different macronutrient profile from all other categories, containing much higher protein (32.4% vs range of 10.8%–20% energy) and much lower carbohydrate (34.7% vs 48.5%–60.4% energy) contents than all other categories. While natural/Greek yogurts contained the least amount of sugars, their median total sugar (5.0 g/100 g, largely lactose) was higher than the agreed allowance (3.8 g/100 g) for lactose. Although low-fat products had less sugar and energy than higher fat yogurts, nonetheless 55% of low-fat products contained 10–20 g sugar/100 g. Within the children’s category, fromage frais had higher protein and calcium contents/100 g than yogurts and was marketed with smaller serving sizes. Less than 9%, and only 2% of children’s, products surveyed were low enough in sugar to earn ‘green’ in UK front-of-the pack labelling; and many products recommended by supermarkets for lunch boxes were high-sugar desserts. We conclude not all yogurts are as healthy as perhaps consumers perceive them and reformulation for the reduction of free sugars is warranted.
References
Footnotes
Contributors JBM designed the study, analysed the data and wrote the manuscript. AH carried out the study, analysed the data and contributed to a preliminary draft. BAF helped design and interpret the study and revised the manuscript critically for important intellectual content.
Funding This research received no specific grant from any funding agency in the public, commercial or not-for-profit sectors.
Competing interests None declared.
Patient consent Not required.
Provenance and peer review Not commissioned; externally peer reviewed.
Data sharing statement No additional data are available.