Article Text

Abstract
Objectives To develop a method for calculating age-specific hospital catchment populations (HCPs) for children and young people (CYP) in England. To show how these methods allow geographical variation in hospital activity to be investigated and addressed more effectively.
Design Retrospective, secondary analysis of existing national datasets.
Setting Inpatient care of CYP (0-18 years) in England.
Participants Hospital Episode Statistics (HES) data were accessed for all inpatient admissions (elective and emergency) for CYP from birth to 18 years, 364 days, for 2011/2012–2014/2015. In 2014/2015, 857 112 admissions were analysed, from an eligible population of approximately 11.9 million CYP.
Outcome measures For each hospital Trust, the catchment population of CYP was calculated; Trust-level admission rates per thousand per year were then calculated for admissions due to (1) any diagnostic code, (2) primary diagnosis of epilepsy and (3) epilepsy listed as primary diagnosis or comorbidity.
Results Estimated 2014/2015 HCPs for CYP ranged from 268 558 for Barts Health NHS Trust to around 30 000 for the smallest acute general paediatric services and below 10 000 for many Trusts providing specialist services. As expected, the composition of HCPs was fairly consistent for age breakdown but levels of deprivation varied widely. After standardising for population characteristics, admission rates with a primary diagnosis of epilepsy ranged from 14.3 to 157.7 per 100 000 per year (11.0-fold variation) for Trusts providing acute general paediatric services. All-cause admission rates showed less variation, ranging from 4033 to 11 681 per 100 000 per year (2.9-fold variation).
Conclusions Use of age-specific catchment populations allows variation in hospital activity to be linked to specific teams and care pathways. This provides an evidence base for initiatives to tackle unwarranted variation in healthcare activity and health outcomes.
- variation
- paediatrics
- children and young people
- health services research
- hospital catchment population
This is an open access article distributed in accordance with the Creative Commons Attribution Non Commercial (CC BY-NC 4.0) license, which permits others to distribute, remix, adapt, build upon this work non-commercially, and license their derivative works on different terms, provided the original work is properly cited and the use is non-commercial. See: http://creativecommons.org/licenses/by-nc/4.0/
Statistics from Altmetric.com
Strengths and limitations of this study
We adapt methodology for estimating hospital catchment populations, which has been validated and used extensively by Public Health England for adult and all-age populations.
A strength of this study is the use of Hospital Episode Statistics, which contain high-quality data on the vast majority of hospital care for children and young people in England.
Another strength is the ability to standardise for population differences, including age, sex and deprivation, so that fair comparisons can be made between services.
Although there were very low levels of missing postcode overall (1.2%), a small number of Trusts reported missing postcode data on over 5% of patients, meaning that the catchment populations for these Trusts should be interpreted with caution.
Background
In 2012, the Chief Medical Officer expressed concern about the poor health outcomes experienced by children and young people (CYP) in England compared with other West European countries. She argued that one key route to improving these outcomes would be through understanding and addressing the wide geographical variation in health services and outcomes within England.1 More recent evidence shows that this variation persists—for example, the rates of hospital admission for elective tonsillectomy in CYP by Clinical Commissioning Groups (CCGs) ranged from 84 to 485 per 100 000 population (5.7-fold variation) while asthma admission rates varied from 60 to 639 per 100 000 population (10.6-fold variation).2 However, with some exceptions, greater awareness has not resulted in effective action to tackle geographical variation, and there has been limited research to understand the causes of variation.
One important limitation of previous work has been that geographical analysis of healthcare activity has been restricted to CCGs or Local Authority areas. These geographical areas are defined by their responsibility for commissioning services within their designated population, whereas provision of most health services is by individual NHS Trust. Each area is often served by many different NHS Trusts, preventing variation being attributed to specific hospital services. A second important limitation has often been the inability of policy makers and researchers to adjust for population risk (ie, to understand the proportion of variation that can be accounted for by population differences).
In the USA, hospital service areas allow analysis of health outcomes in the population served by specific hospital or networks.3 In the UK, a number of different methods have been used to calculate hospital catchment populations (HCPs) for adults,4 of which the most widely used is the proportionate flow method used by Public Health England (PHE).5 6 However, the marked differences in referral pathways, clinical networks and hospital activity between paediatric and adult services limits the application of published catchment populations to study variation in CYP.
This article describes how we adapted the use of PHE methods to calculate age-specific HCPs for paediatric services, both unadjusted and adjusted for population characteristics (sex, age, deprivation). These represent estimates of the number of CYP who would have been admitted to each Trust had they needed hospital care, disaggregated by age, sex and deprivation. We analyse data on epilepsy admissions as a practical example to illustrate how these methods may be useful to guide commissioning, operational and policy decisions. Potential application of these methods to other conditions is also discussed.
Methods
Data
Hospital Episode Statistics (HES) data7 were accessed for all inpatient admissions (elective and emergency) for CYP from birth to 18 years, 364 days, for 2011/2012–2014/2015. For each admission, we analysed:
geographic data on the admitting NHS Trust and the lower layer super output area (LSOA).8 These are the smallest geographical unit for which Census data are available and can be derived from the patient’s postcode;
sociodemographic data on sex, age (by single year). Adjustment for these variables is needed as inpatient activity during childhood is known to vary markedly with age and between males and females9;
ICD10 codes of the primary diagnosis and any secondary diagnoses. For the second set of analyses, we focused on admissions for epilepsy (ICD10 codes G40, G41).
HES data were then linked to Office of National Statistics (ONS) data on Index of Multiple Deprivation (IMD) and the CYP population within each LSOA,10 disaggregated by single year of age and sex (based on ONS 2012 mid-year estimates by age, sex).
Note that the term ‘HCP’ refers to the catchment population of an NHS Trust–an administrative unit that may include more than one hospital site. We retained the term HCP as the term NHS Trust is not widely understood, especially by readers who are not familiar with the English NHS.
Derivation of hospital catchment populations
Derivation involved five steps as described below.
1. HES data were used to count the number of patients in each age and sex group admitted from each LSOA to
Any provider (NHS Trust).
Each individual provider.
HESIDs (unique patient identifiers within the HES data) were used to ensure that each patient was only counted once; if a patient had multiple admissions while living at the same address, we selected only the first admission.
2. Within each age and sex group, we calculated the proportion of patients from each LSOA that was admitted by each provider, as a proportion of patients who used any provider.
For band i (age and sex), LSOA j, the number admitted to provider a is denoted by miaj
. The total number admitted by LSOA and band i for each year is denoted by  then,
then,

where  represents the proportion of patients that went to each provider.
3. For each LSOA, this proportion was multiplied by the LSOA resident population in that age-sex group  to give the LSOA catchment population for each provider
  .
.
The catchment population of provider a for band i (age and sex) is then:

4. The provider-specific catchment populations for each LSOA were summed to give the total catchment population for that provider.
Thus, the total catchment population C for provider a, band i (age and sex):

5. Adding in information on IMD decile, the total catchment population for provider a, band I (age and sex), IMD D is:
 (j)
(j)
where

Notes:
We excluded patients with missing or invalid age at start of episodes (<0.1%) or with no valid English LSOA (1.2% of episodes; median proportion of episodes at Trust level=0.6%). Nine Trusts (6.2%) had missing LSOA data on >5% of episodes (range 5.1%– 26.1%), reflecting either a high proportion of patients who live in Wales or incomplete coding. These Trusts are identified in tables 1 and 2 and their estimated HCPs should be interpreted with caution. See online supplementary appendix table A1 for further details.
Supplementary file 1
Paediatric hospital catchment populations in London by year, standardised for age, sex and deprivation
Supplementary file 5
Some patients moved residence during the analysis period and had admissions to the same Trust from different postcodes of residence. We counted these patients once in each LSOA. Significant numbers of patients are treated in a region other than their region of residence and catchment areas of Trusts therefore cross regional boundaries.
Use of hospital catchment populations to investigate variation in epilepsy admission rates for CYP
In order to illustrate the use of HCPs, we calculated unadjusted and adjusted admission rates for all-cause and epilepsy admissions per thousand CYP. The median, IQR, range and ratio of highest: lowest Trust-level admission rates were calculated. Following previous studies,2 we then recalculated the range and ratio of highest:lowest admission rates excluding the five highest and five lowest Trusts. This is a form of sensitivity analyses that is recommended in order to minimise distortion from a small number of outliers in the reliability of diagnostic coding.
Next, the ratio of observed versus expected admissions was calculated for each Trust. To do this, the expected admission rates for each Trust (unadjusted) were calculated by multiplying the national epilepsy admission rate per thousand CYP by the total catchment population for that Trust. The adjusted values for expected admission rates used a similar approach, based on the national epilepsy admission rate per thousand and the Trust catchment population within each age-sex-IMD group. The expected total number of admissions for each Trust was the sum of expected admissions within each age-sex-IMD group.
In each case, we then derived the ratio of observed versus expected epilepsy admissions, highlighting those Trusts with admission rates that differed by more than 2 or 3 SD from the expected rate for the population served.
All analyses were performed using SAS. No ethical permission was needed for these secondary analyses of anonymised, routinely collected data.
Patient involvement
Concerns about geographical variation in the quality, accessibility and capacity of NHS services for CYP have been raised repeatedly in consultations in CYP and families.1 No patients or families were directly involved in designing or performing these analyses.
Results
In 2014/2015, 857 112 admissions were analysed, from an eligible population of approximately 11.9 million CYP. The Trust serving the largest number of CYP was Barts Health NHS Trust, with an estimated paediatric HCP of 268 558, compared with the national median HCP of 71 379. Sixteen Trusts had estimated catchment populations of <10 000. This may reflect the fact that they provide specialist services (eg, Great Ormond Street Hospital, Papworth Hospital NHS Foundation Trust) or that only specific groups of CYP are admitted (eg, inpatient care for new born babies) or young people (usually aged 16 or over) who were admitted under the care of adult specialists (eg, Birmingham Women’s NHS Foundation Trust, Liverpool Women’s Hospital NHS Trust). The smallest catchment populations for Trusts providing acute general paediatric services were around 30 000 (eg, Northern Devon Healthcare NHS Trust=34 821 Sheffield Teaching Hospitals NHS Foundation Trust=27 899).
Table 1 presents the standardised HCPs for each NHS Trust in London where CYP were admitted. These data illustrate the impact of reconfiguration and mergers of Trusts during the period 2011/2012–2014/2015 on the HCP for each Trust. For example, London North West Healthcare NHS Trust was newly formed in 2014 and took on the workload of North West London Hospitals NHS Trust. Similarly, Barnet and Chase Farm Hospitals NHS Trust merged with the Royal Free Hospital in 2014, with the result that much of Barnet’s HCP was transferred across to the HCP of Royal Free Hospital. Standardised HCPs for all NHS Trusts in England are shown in online supplementary appendix table A2.
Supplementary file 2
Online supplementary appendix table A3 presents the HCPs for each Trust in England where CYP were admitted in 2013/2014, disaggregated by IMD quintile. In four cases, greater than 60% of the CYP population served by a Trust lived in the most deprived quintile of areas (Homerton University Hospital NHS Foundation Trust (77.4%); Sandwell and West Birmingham Hospitals NHS Trust (65.0%), Royal Liverpool Broadgreen Hospitals NHS Trust (62.7%), Barts Health NHS Trust (60.4%)). In contrast, two Trusts served a population where more than 60% lived in the least deprived quintile: Frimley Park Hospital NHS Trust (61.1%), Royal Surrey County NHS Foundation Trust (60.3%).
Supplementary file 3
The age breakdown varied much less between Trusts. The proportion of all 0–18 s who were in the 0–3 age band varied from 27.9% in Chelsea & Westminster Hospital NHS Foundation Trust, to 19.2% at the Robert Jones and Agnes Hunt Orthopaedic Trust (see online supplementary appendix table A4).
Supplementary file 4
Table 2 presents admission rates by Trust for primary diagnosis of epilepsy, any diagnosis of epilepsy, and all-cause admissions per 100 000 CYP in 2014/15. Excluding Trusts that do not provide acute general paediatrics services (see explanation above), standardised admission rates with a primary diagnosis of epilepsy ranged from 14.3 to 157.7 per 100 000 per year (11.0-fold variation). The median value was 71.3 per 100 000, with an IQR from 55.8 to 90.3. Excluding the five Trusts with the highest and lowest admission rates, the range reduced to 30.9 to 124.9 vs 30.9 per 100 000 per year (4.0-fold variation). All-cause admission rates showed much less variation, with all-cause admissions in Trusts providing acute paediatric services ranging from 4033 to 11 681 per 100 000 per year (2.9-fold variation), with a median of 7130 and an IQR from to 5890 to 8390 per 10 000 per year. Excluding the highest and lowest five, the range was from 4439 to 10 200 to 4439 per 10 000 per year (2.3-fold variation). Moderate agreement was observed between all-cause and epilepsy-specific admission rates (r2=0.25).
In figure 1, unadjusted and adjusted admission rates for primary diagnosis of epilepsy byTrust are presented. This figure illustrates, first, that relatively little of the observed variation can be explained by random chance among relatively small units; second, it shows that only a small degree of the observed variation can be explained by differences in the age, sex and deprivation of the population served by each Trust.
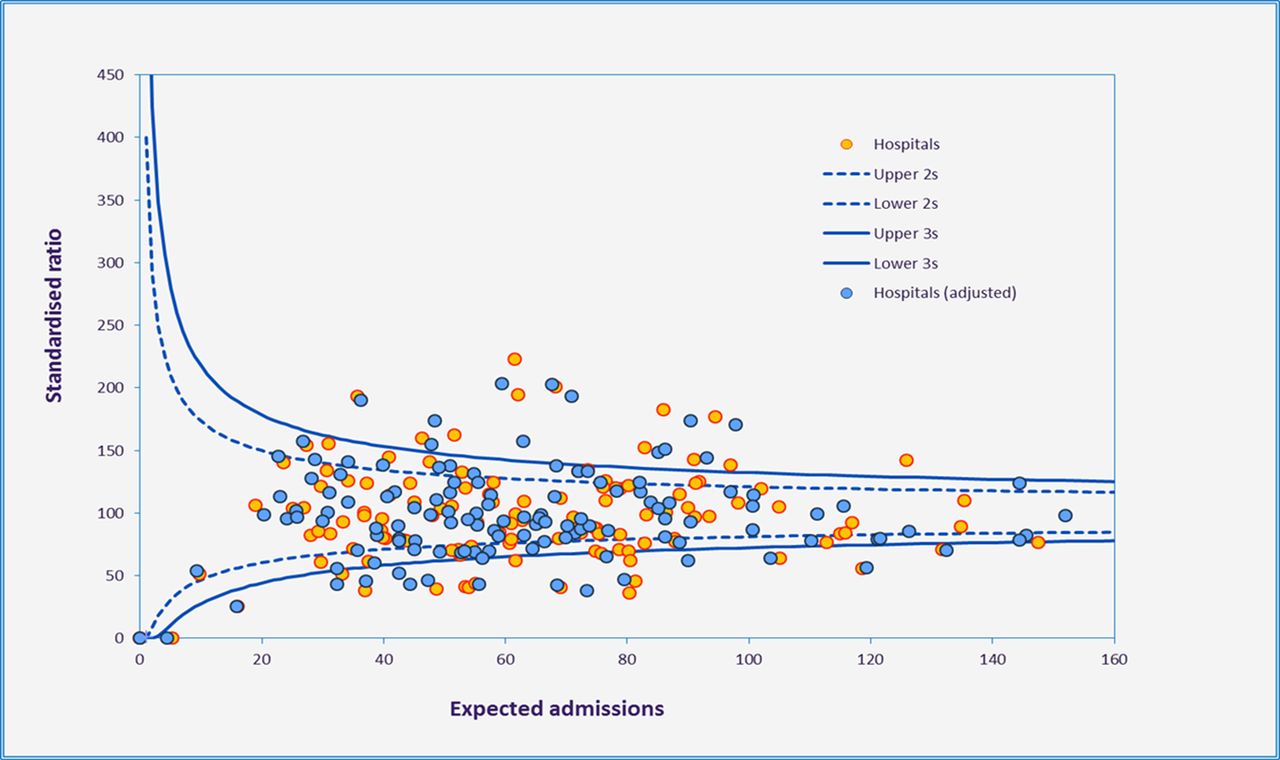
Funnel plot showing ratio of observed: expected paediatric epilepsy admissions in English Hospital Trusts, 2014/2015.
Discussion
This study demonstrates the feasibility of estimating age-specific catchment populations for Trusts within the English NHS. We then show two ways in which these findings may be applied to inform planning of health services and support quality improvement activities and research. First, we illustrate how catchment populations in London have changed following recent mergers and other service reconfigurations. Second, we use the catchment populations to calculate admission rates per 100 000 CYP for each NHS Trust. These data show that admission rates vary 11-fold between Trusts providing acute general paediatric services for epilepsy admissions (4-fold when excluding extremes) and 2.9-fold (2.3-fold) for all-cause admissions in this age group.
Strengths of this study are the use of robust methodology for estimating HCPs, which has been validated and used extensively by PHE for adult and all-age populations. Another strength of the study is the quality and completeness of HES, which are subject to extensive cleaning and quality assurance processes and cover 98%–99% all hospital care in England.11 12 This includes the vast majority of healthcare provided for CYP resident in the UK, making HES data the largest unified dataset of its kind in the world. These data may be particularly useful in performing national-level analyses of variation, where chance findings of very high or low admission rates due to small numbers of patients with a particular condition attending a specific hospital are likely to even out. Another strength is the ability to adjust or standardise for population differences, including age, sex and deprivation, so that fair comparisons can be made between services.
One important limitation of this study is that in order to maximise data in each LSOA (median CYP population is approximately 300), all inpatient activity within this age group is included. Our model does not account of the fact that parents or CYP who live a similar distance from two hospitals might, for example, choose to attend Hospital A if their child needed elective surgery by an Ear, Nose and Throat surgeon but attend Hospital B for acute abdominal pain. In adult populations, there is some evidence that patients are willing to travel further to access elective care compared with emergency care.13 As noted above, caution must be used in interpreting results for any specific hospital, especially when looking at single conditions affecting a relatively small number of patients. Another caveat is that these data will be most useful in comparing like with like—for example, all District General Hospitals providing acute general paediatric care or all tertiary children’s hospitals. As illustrated in table 2 and online supplementary appendix table A4, calculated admission rates for specialist hospitals, or those only providing care for neonates or CYP over the age of 16, may be very high or very low compared with those of general hospitals. Finally, for the small number of hospitals where postcode information is less than 95% complete, the HCPs and admission rates should be interpreted with caution (see Methods section and online supplementary appendix table A5 for further details).
Paediatric admission rates by Trust for primary diagnosis epilepsy, any diagnosis epilepsy, all-cause admissions, per 100 000, 2014/2015, England
To our knowledge, this study is the first to report HCPs for paediatric care in England. Previous studies in adult populations and other countries have described a range of methods for estimating catchment populations, including proportionate flow or Norris-Bailey methods (as used in this study),6 k-means clustering of multivariate data,14 kernel analyses15 and ‘de facto service areas’ in which the population of each LSOA is allocated to the catchment population of a single hospital using a Bayesian approach.4 Advanced versions of these techniques are being increasingly used to study variation in preventable hospitalisations.16 17 Further research using different methodological approaches to calculate HCPs for CYP would be a useful way to investigate the robustness of our model and may allow clearer ways of presenting maps of HCPs.
The most useful approaches to do this are likely to be based on further analyses of HES data. Compared with HCPs based on survey data (as reported in early studies of geographical variation),18 use of HES data has the advantage of being efficient (as it is based on existing, routinely collected data that have already been extensively cleaned and quality assured), robust (as it uses data collected at the time of use, rather than being based on retrospective patient/family recall or on hypothetical questions about where care would be accessed if needed in the future) and has high levels of completeness (as it is not limited by survey response rate).
As in adult populations, we believe that age-specific HCPs for CYP will provide a useful evidence base to support operational decisions, quality improvement work and future research related to hospital services.19 For example, data used to calculate each catchment population can be used to create a detailed map (eg, a chloropleth map) of all CYP served by any hospital. As well as tracking changes in the HCP following reconfiguration (as shown in table 1), in the future HCP mapping, data could be used to model the impact of service reconfiguration and merger plans, so reducing the uncertainty and disruption to services that often occurs at present. Regarding quality improvement projects, existing indicators are often published at Local Authority level, across a population that may be served by many different hospitals. Previous research has shown that indicators mapped directly to specific clinical teams promote clinical engagement and accountability.20 Further, they can identify specific strengths or weaknesses of individual services and so inform tailored quality improvement initiatives. Last, HCPs have potential to open up exciting new avenues of research within paediatric services. For example, the national clinical audit for paediatric epilepsy (Epilepsy12) has collected detailed information on paediatric epilepsy services in England since 2011, but to date it has not been possible to link these data to admission rates, due to lack of an appropriate denominator. Such linkage would allow robust investigation of the impact on improving performance in different aspects of epilepsy care on unit-level admission rates (ie, the degree to which performance in the Epilepsy12 audit accounts for the unexplained variation shown in figure 1). Similarly, attempts to study and reduce geographical variation by specialist networks such as those for paediatric surgery or gastroenterology services have been limited by lack of appropriate denominator data. HCPs will allow admission and activity rates to be compared between areas and facilitate study of unmet need and/or overuse of admissions or procedures.
Conclusion
This paper presents a method for calculating HCPs for the care of CYP in the English NHS. We then show how this method allows comparison of paediatric admission rates between hospitals, adjusting for population characteristics including sex, age and deprivation. Last, we illustrate how these adjusted admission rates may be useful for the purposes of commissioning and improving services as well as for quality improvement and research activities.
Footnotes
Contributors SA, CS-J, CRC and DSH were involved in the design of this study and in revising the manuscript. SA and CSJ performed all analyses. SA and DSH wrote the first draft of the manuscript.
Funding This work was supported by The Health Foundation (Improvement Science Fellowship to DH; award Reference Number 7383).
Competing interests None declared.
Patient consent Not required.
Ethics approval Not applicable.
Provenance and peer review Not commissioned; externally peer reviewed.
Data sharing statement SAS code used for all analyses is available from the authors on request.