Article Text

Abstract
Objectives Cardiovascular mortality in Western Asia is high and still rising. However, most data documented on risk prediction has been derived from Western countries and few population-based cohort studies have been conducted in this region. The current study aimed to present the process of pooling data and cardiovascular disease (CVD) mortality incidences for four Iranian cohorts.
Methods From the Iran Cohort Consortium, the Golestan Cohort Study (GCS), Tehran Lipid and Glucose Study, Isfahan Cohort Study (ICS) and the Shahroud Eye Cohort Study (ShECS) were eligible for the current study since they had appropriate data and follow-up visits. Age-standardised CVD mortality rates were estimated for ages 40–80 and 40–65 years. Cox regression was used to compare mortalities among cohorts. Adjusted marginal rates were calculated using Poisson regression.
Results Overall, 61 291 participants (34 880 women) aged 40–80 years, free of CVD at baseline, were included. During 504 606 person-years of follow-up, 1981 CVD deaths (885 women) occurred. Age-standardised/sex-standardised premature CVD mortality rates were estimated from 133 per 100 000 person-years (95% CI 81 to 184) in ShECS to 366 (95% CI 342 to 389) in the GCS. Compared with urban women, rural women had higher CVD mortality in the GCS but not in the ICS. The GCS population had a higher risk of CVD mortality, compared with the others, adjusted for conventional CVD risk factors.
Conclusions The incidence of CVD mortality is high with some differences between urban and rural cohorts in Iran as a Western Asian country. Pooling data facilitates the opportunity to globally evaluate risk prediction models.
- cardiovascular diseases
- mortality
- cohort studies
- epidemiology of cardiovascular diseases
This is an open access article distributed in accordance with the Creative Commons Attribution Non Commercial (CC BY-NC 4.0) license, which permits others to distribute, remix, adapt, build upon this work non-commercially, and license their derivative works on different terms, provided the original work is properly cited and the use is non-commercial. See: http://creativecommons.org/licenses/by-nc/4.0/
Statistics from Altmetric.com
Strengths and limitations of this study
The main strength of this study is the assessment and comparing of cardiovascular disease (CVD) mortality incidence rates using harmonised data of four large Iranian population-based cohorts. These values supplied much useful information about CVD mortality compared with non-cohort studies with less reliable International Statistical Classification of Diseases and Related Health Problems coding (ICD).
A high incidence of CVD mortality and premature CVD mortality was evident in Iranian populations. Regional differences were found in prevalence of risk factors and also in CVD incidence adjusting for conventional risk factors.
Study limitation includes that we adjusted the differences for traditional risk factors while there are other risk factors for CVD which were not measured in all of the cohorts.
Background
Cardiovascular disease (CVD) mortality has declined in many industrialised countries, while more than 80% of premature deaths due to CVD and other non-communicable diseases occur in low-income and middle-income countries.1
Like most countries in Western Asia, CVD is the first cause of death in Iran, responsible for 46% of deaths. High prevalence of CVD risk factors has also been reported in this region.2 Mean age-standardised cholesterol level and body mass index (BMI) of both genders and the mean systolic blood pressure (SBP) of Iranian women are higher than the global average.3 The prevalence of diabetes in Iran, in the population aged 25–64 years, reached from 8% in 2005 to approximately 11% in 2011.4 Therefore, identifying high-risk individuals is one of the main goals of primary level prevention and interventions such as lifestyle changes and/or medicinal treatments.
Two main strategies, population based and individual based, have been proposed by WHO for CVD prevention, both of which require measuring the risk of CVD to shift the risk distribution to lower levels and treat high-risk cases.5 In spite of high incidence of CVD outcomes in developing countries, most of the knowledge related to risk prediction had been derived from cohort studies in developed countries. Large population-based cohort studies are scarce in Western Asia; although some studies have been conducted in Iran during the past two decades. The Iran Cohort Consortium was established in 2015 with the aim of greater collaboration between these cohorts6; data pooling was defined as the first project to assess the incidence of CVD mortality, using harmonised data. The pooled data have advantages such as increasing the sample size and raising the statistical power for the development of CVD prediction models.7–9 The current study clarifies the data preparation and describes the prevalence of traditional risk factors as well as the incidence of CVD mortality in the cohorts.
Methods
Based on availability of the minimum variables required and having at least 5 years of follow-up, four studies were selected from the cohorts listed by Iran Cohort Consortium: the Golestan Cohort Study (GCS: 50 045 individuals aged 40–75 years in phase 1, of them 11 418 of the participants were randomly selected for laboratory measurements in the second phase), Tehran Lipid and Glucose Study (TLGS: 15 005 individuals in phase 1 and 3550 new participants in phase 2, aged ≥3 years, of them 6402 were aged 40–80), Isfahan Cohort Study (ICS: 6504 individuals aged ≥35 years, of them 5251 individuals were aged 40–80) and the Shahroud Eye Cohort Study (ShECS: 5190 individuals aged 40–64 years); details of all involved cohorts have been published elsewhere.10–15 Cohorts under study are explained in the online supplementary material in brief. Bearing in mind the statistical and clinical advantages of using individual participant data,9 16 17 all the variables required for modelling were integrated. Data assessment and harmonisation were done for both exposures and outcomes to define common variables. All variables were assessed for missing values. For the current study, we considered individuals aged between 40 and 80 years. To predict CVD mortality in CVD-free individuals, participants with positive or unknown history were excluded.
Supplementary file 1
Patient and public involvement
In all cohorts under study, health workers or healthcare volunteers, who were in close contact with local community and well respected by people, helped the investigators to explain the study to participants and invite them based on the study objectives although they were not involved in the design of the studies directly. A written informed consent was obtained from participants. We will ask the cohorts’ investigators to disseminate the main findings of the current study to the participants with their own discretion.
Technical information
Data related to age, educational status, history of diabetes and hypertension, history of taking antihypertensive and glucose-lowering medications, history of CVD and cigarette smoking had been acquired by interview at the initiation of the studies. Anthropometric indices (including height, weight, waist and hip circumference), SBP and diastolic blood pressure (DBP) were measured through clinical examinations.10–13 Serological data such as serum lipids (total cholesterol and triglyceride) and serum glucose had already been obtained in most cohorts. Self-reported diabetes was defined as a self-report of physician diagnosis and/or taking diabetes medication. Diabetes was considered as fasting blood glucose levels ≥7 mmol/L or blood sugar ≥11.1 mmol/L, whichever was available, or use of glucose-lowering medication. Hypertension was defined as SBP ≥140 mm Hg and/or DBP ≥90 mm Hg, and/or intake of antihypertensive drugs. BMI was calculated as the weight in kilograms divided by the square of the height in metres. Smoking was considered as smoking cigarettes at least once a day.
Time to event for each participant was defined as the interval between the time of inclusion in the study and death caused by CVD, the date of the latest follow-up and/or date of death due to other causes, whichever had occurred earlier. Cohorts under study have defined algorithms to confirm the end points.10–13 In all cohorts, the participants were followed up actively by phone interviews and were asked for any occurrence of major diseases that have taken place since the previous follow-up. In the case of any medical event leading to hospital admission or death, complementary data, using hospital records and/or home visits, were gathered. In case an out-of-hospital death was reported, data were collected from the death certificate and verbal autopsy. Verbal autopsies were carried out by trained experts using predefined questions including medical history, signs and symptoms before death. To confirm the diagnosis, an adjudicated committee, consisting of multiprofessional specialists, reviewed the documents.
To estimate the incidence of CVD mortality, the outcome was defined as deaths caused by ischaemic heart disease (International Statistical Classification of Diseases and Related Health Problems, 10th revision (ICD10) codes I20–I25), sudden cardiac arrest (I46.1) or death caused by cerebral infarction (ICD10 codes I60–I69).
Statistics
Demographic characteristics and distribution of the variables were assessed. CVD mortality rates (per 100 000 person-years) were estimated in each cohort by sex (except for those from the second phase of the GCS, as they were duplicates). To make CVD death rates more comparable, direct standardisation was done using two different populations, the Iranian census data of 2011 and European standards populations verified by WHO.18 Crude and adjusted CVD mortality rates were also estimated for the population aged 40–65 years at the start of the cohort studies; CVD mortality in this age range could be assumed approximately as premature CVD mortality, given both the maximum follow-up of 10 years in the current study and 75-year life expectancy in Iran. Since the age range between 30 and 40 years was not available in the data of some cohorts, as an ancillary analysis, we estimated the premature CVD mortality rate in the TLGS according to WHO definition in people aged ≥30 years at baseline and <70 at the end of 10 years of follow-up.
HRs for CVD death were compared across the cohorts using multivariable Cox proportional hazard regression, adjusting for traditional risk factors of CVD including age, sex, hypertension, smoking, self-reported diabetes and BMI. Death rates were also calculated separately for the ICS and GCS populations based on their location of residence (urban or rural). The marginal mean of CVD mortality rates across cohorts, location of residence and gender were calculated using Poisson regression, adjusted for age and other conventional risk factors.
Selection bias in cohort studies can arise from either unwillingness to participate at the beginning or lost to follow-up,19 which may result in the underestimation of mortality rates; to check the potential effect of dropouts on CVD mortality incidence rates, we analysed data by inverse probability weighting of lost to follow-up.20 21 The weights for predicting no follow-up were estimated using a logistic regression model including age, sex, education, hypertension, BMI and smoking as exposures, which might be associated with no follow-up. We also estimated all-cause mortality rates among individuals aged 40–65 years.
History of CVD was not among the data obtained at the beginning of ShECS. We designed a questionnaire to ask all participants about the history of CVD at initiation of the study, retrospectively. To reduce the effect of recall bias, we used two approaches. First, transparent questions were designed to maximise the likelihood of correct responses. Relevant questions were also asked of the deceased individuals’ close family members. Second, we conducted a sensitivity analysis and included all events, regardless of CVD history at baseline in this cohort. All analyses were performed with STATA software V.12 (Stata Corp, College Station, Texas, USA).
Results
In total, 80 294 individuals were included in the cohort studies. After removing those aged below 40 and above 80 years (14 205), and those having history of CVD (4327) or unknown history (471) at the beginning, a total of 61 291 individuals (34 880 women) remained (see online supplementary figure 1). The gender proportion was almost similar in all cohorts (range of 50.5% to 58.6% for women, table 1). The median follow-up was over 10 years in TLGS and ICS, and close to 10 years in the first phase of GCS. The median follow-up was approximately 5 years in ShECS and GCS2. Although laboratory data had not been measured in GCS1, glucose and lipid measurements were available in the second phase (see online supplementary table 1).
Characteristics of the Iranian cohort studies included in the pooling project to define prediction models for CVD mortality
Given the inclusion criteria of the pooling project, the mean ages were nearly the same from 50.8 years in the ShECS to 55.3 years in the GCS2. More pronounced differences were observed in the literacy status of the cohorts, where the literacy status of ‘high school and higher’ ranged from 8% in the GCS to over 40% in the ShECS. Mean BMI exceeded the normal cut-off point of 25 kg/m2 in all the studies (table 2). General characteristics of individuals for each sex are reported in online supplementary table 2.
General characteristics of the individuals included in the pooling project at baseline of the cohorts
Overall, of 61 291 persons, 1255 (2.0%) individuals had no information on follow-up, and 1981 (885 women) deaths were reported over 504 606 person-years. In all the cohorts, the age-standardised CVD death rate using the Iranian national census was higher among men than in women; the most difference was seen in TLGS men (452 per 100 000 person-years; 95% CI 360 to 543) compared with women (204 per 100 000 person-years; 95% CI 138 to 270, table 3). CVD mortality rates differed between the cohorts, especially among women (table 3); CVD mortality rates in women varied from 204 per 100 000 person-years (95% CI 138 to 270) in TLGS to 463 per 100 000 person-years (95% CI 425 to 499) in GCS, which also exhibited higher mortality rates in men. Using TLGS as the reference, multivariable Cox model adjusted for age, sex, hypertension, smoking, self-reported diabetes and BMI resulted in significant regional differences in CVD mortality rates of GCS in both men (HR 1.72, 95% CI 1.38 to 2.14) and women (HR 2.65, 95% CI 1.95 to 3.60).
CVD mortality rates per 100 000 person-years in three population-based cohort studies in Iran, ages 40–80 years
CVD mortality rates in individuals aged 40–65 years are illustrated in table 4. The incidence of age-standardised CVD deaths using the Iranian national census varied from 76 per 100 000 person-years (95% CI 31 to 121) to 274 per 100 000 person-years (95% CI 251 to 298) in women and from 145 per 100 000 person-years (95% CI 74 to 215) to 374 per 100 000 person-years (95% CI 342 to 406) in men; in both genders, the lowest CVD death rate was observed in the ShECS and the highest in the GCS. Significant differences were detected between the CVD mortality rates of GCS and TLGS in men (HR 1.92, 95% CI 1.38 to 2.63) and women (HR 3.03, 95% CI 2.01 to 4.59). We also estimated standardised all-cause mortality rates using the Iranian national census in individuals aged 40–65 years at baseline; the values were 329 (95% CI 274 to 385), 518 (95% CI 438 to 599), 880 (95% CI 848 to 912) and 286 (95% CI 213 to 359) per 100 000 person-years in TLGS, ICS, GCS and ShECS, respectively.
CVD mortality rates per 100 000 person-years in four population-based cohort studies in Iran, ages 40–65 years
To consider the potential effect of dropouts, we re-estimated crude CVD mortality rates applying the inverse probability weights of no follow-up; since the results did not change, for simplicity, the results without weighting are reported. Sensitivity analysis of ShECS showed that the standardised CVD mortality rate rose to 229 per 100 000 person-years (95% CI 163 to 295), which was still lower than the Golestan mortality rate.
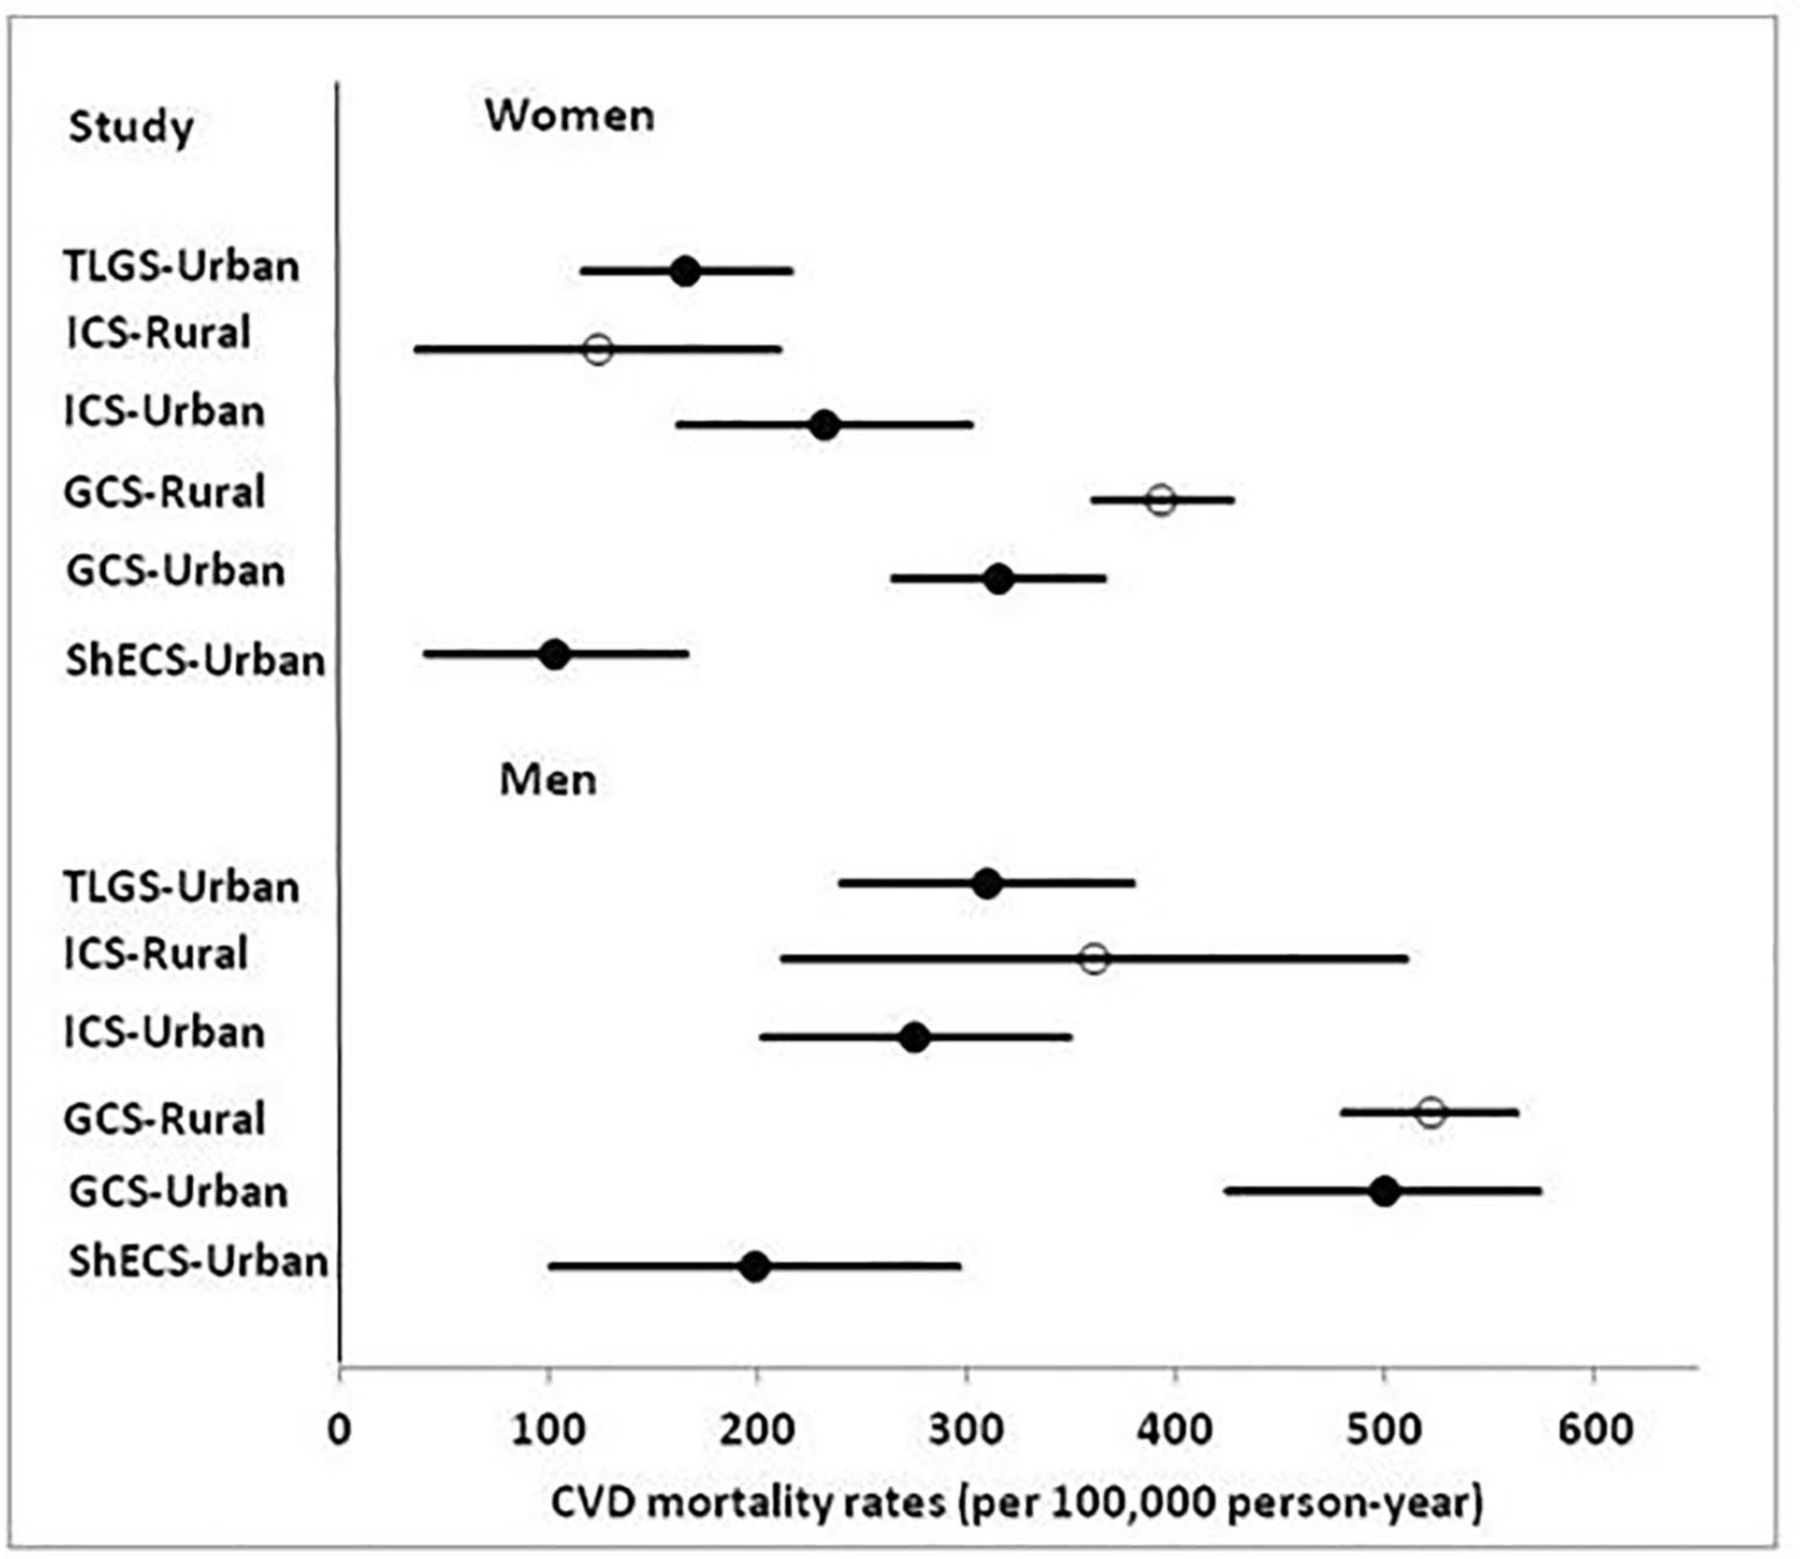
Online supplementary figure 2 illustrates the Kaplan-Meier survival curve and Cox age-adjusted survival estimates plotted on the same graph, for each cohort separately. Fully-adjusted CVD mortality rates by cohort, residential area and gender are illustrated in figure 1. The death rate among rural women in GCS was higher than in urban women, although urban and rural men in this cohort showed no differences.

Adjusted CVD mortality rates across cohorts, location of residence and genders. CVD, cardiovascular disease; GCS, Golestan Cohort Study (phase 1); ICS, Isfahan Cohort Study; ShECS, Shahroud Eye Cohort Study; TLGS, Tehran Lipid and Glucose Study. Adjustment was for age, sex, hypertension, smoking, self-reported diabetes and body mass index.
Discussion
We presented the prevalence of CVD risk factors and the incidence of CVD mortality in four cohorts from the Western Asia region using harmonised data. A high incidence of CVD mortality and premature CVD mortality was evident in urban and rural Iranian populations with some differences among different cohorts.
A study in urban and rural communities in 17 countries showed that the rates of CVD events were higher in low-income and middle-income countries than in high-income countries. Rural communities had also the higher rates of CVD events despite the lower risk factor burden.22 According to WHO report in 2010, the age-standardised rates of CVD and diabetes-related deaths in Iran were 421 per 100 000 in men and 348 per 100 000 in women.23 These rates were much higher when compared with those of developed countries; for example, the values in the Netherlands were 151 per 100 000 in men and 93 per 100 000 in women. The same report showed CVD and diabetes-related mortalities to be 191 and 122 in American men and women.23 Cardiovascular and diabetes mortality in some countries like Egypt had the same pattern (427 per 100 000 in men and 384 per 100 000) as Iran, however, the incidence in some neighbouring countries was lower; these estimates in Turkey equalled 268 per 100 000 in men and 245 per 100 000 in women.23
In the current study, CVD mortality rates in the population aged 40–80 years ranged between 482 and 776 in men and 263 and 571 in women across the cohorts studied.
Previous studies have shown that traditional risk factors of CVD have increased in the past two decades in Iran.4 24 CVD risk factors also have a high prevalence in other countries in the region. According to WHO, the highest prevalence of diabetes in 2008 was reported in both the Eastern Mediterranean Region and the Region of the Americas (11% for both).23 The prevalence of hypertension in most countries of the West Asia was over 30% in 2008.2 Despite high incidence of CVD mortality in all the cohorts under study, GCS showed a higher risk for CVD mortality in population aged 40–65 years, which remained even after controlling for traditional risk factors. The high CVD mortality rate in Golestan warrants further study. There is a high prevalence of hypertension in the Golestan cohort. According to previous studies, only 46% of those with hypertension were aware of their disease.25 A national study in Iran in 2005 showed that 53% of deaths among individuals, aged over 30 years, were due to CVD, and that hypertension had the highest impact.3 If SBP had been controlled at normal levels, about one-third of the ischaemic heart diseases and half the cerebrovascular attacks potentially could have been prevented.26 Although statistical adjustment for hypertension attenuated the estimated differences between the GCS and other cohorts, the residual confounding regarding the quality of treatment is yet another concern. Literacy status of the GCS differed considerably from the other cohorts, likely due to the higher proportion of the rural population. Educational status is one of the most important factors affecting individuals’ health literacy.27 28 Adjusting for educational status did not eliminate the differences between cohorts; residual confounding regarding the precise measurement of education is still a concern. The CVD mortality rate differed significantly between the urban and rural female populations of the GCS. The coverage of diabetes and hypertension management was lower in rural versus urban areas. Increasing the number of health centres might be effective in controlling diabetes and hypertension, and hence result in lower CVD mortality.29
Furthermore, opium use has been reported 17% in the GCS study.30 Although there is no information on opium use in other cohorts, the prevalence of drug abuse in the general population in national level, particularly for opiates, varied between 1% and 3%, bearing in mind some differences in methodologies.30–32 Considering a significant impact of opium use on death caused by ischaemic heart disease (HR 1.90, 95% CI 1.57 to 2.29) and stroke (HR 1.68, 95% CI 1.29 to 2.18),30 the higher prevalence of opium use may affect the CVD mortality in GCS.
Many studies have mentioned the association between race and CVD.33–35 A large proportion of Golestan participants were from Turkmen ethnicity and the differences in death rates could have been affected by ethnic factors. We also estimated standardised all-cause mortality rates across the cohorts. As all-cause mortality is not affected by the medical classification and coding mechanism, detecting the same patterns of mortality rates shows less probability of miscoding. It is concluded that both all-cause and cause-specific CVD mortality rates are higher in GCS than the other cohorts, considering the low probability of different coding practices and comprehensive follow-up in the GCS.
We showed that between 100 and 400 out of 10 000 individuals, aged 40–65 years, will die within the next 10 years of their life. The crude CVD mortality in the TLGS population, aged 40–65 was 235 (95% CI, 174 to 318) and 101 (95% CI, 68 to 150) per 100 000 person-years in men and women, respectively. The corresponding rates, according to WHO definition for premature CVD death, were 181 (95% CI, 140 to 240) and 65 (95% CI, 45 to 100) per 100 000 person-years. Although the latter showed that there is a kind of overestimation, CVD mortality in this age range is still considerable.
Premature CVD deaths occur in the most productive years and can place a heavy burden on the economics of a country. It has previously been shown that the highest burden of premature CVD is due to dyslipidaemia in men and due to type 2 diabetes in women; overweight and prediabetes have also been reported to be among the main determinants of these events in Iranian women.36 Considering the preventable nature of CVD mortality, expanding appropriate interventions should be prioritised in public health strategies. Such prioritisation may be assisted by a prediction model to identify those with high CVD risks.
While our study with large population and long follow-up supplied much useful information about CVD mortality compared with non-cohort and extrapolated estimates, it has some limitations. We adjusted for conventional risk factors while there are other risk factors for CVD such as diet, glomerular filtration rate, serum cystatin C or C reactive protein. These risk factors had not been measured in all cohorts.37–39 Moreover, selection bias may affect the results, although we checked it using inverse probability weighting20 21; the potential effect of unwillingness to participate is still under debate.
Furthermore, the baseline history of CVD was not available in ShECS; however, we collected the relevant data and tried to check its effect in a sensitivity analysis. The time periods of the studies were not equal either, which makes comparisons rather difficult in some cases, though such issues have also been observed in many data aggregation projects before.40 41 Moreover, we could not estimate the premature rates of CVD mortality according to WHO definition, since we did not have a population aged 30 to 40 years at the baseline of some cohorts; so the results of estimating premature CVD mortality may have some kind of overestimation and any interpretation should be made with caution.
Conclusions
Using a harmonised data of four population-based cohorts, we confirm the higher incidence rates of CVD mortality in Western Asia compared with developed countries, with some differences between regions. Since the majority of CVD deaths, especially premature ones, can be averted through appropriate individual and population-wide interventions, detection of high-risk individuals for optimum service delivery is necessary. Such interventions may be assisted by a prediction model to identify those with high CVD risks.
Acknowledgments
The authors express appreciation to the participants and personnel of the cohort studies for their collaboration. We also thank health workers and healthcare volunteers who helped the cohorts under study to invite the participants. We wish to acknowledge Ms N. Shiva for the English editing of the manuscript. This paper is a part of the PhD thesis of Noushin Fahimfar, the first author, in the Department of Epidemiology and Biostatistics in Tehran University and Medical Sciences.
References
Footnotes
Contributors NF designed the study’s analytic strategy, did statistical analysis and wrote the first draft of the manuscript and interpreted the results. DK supervised the work and contributed in the study design, statistical analysis, writing the manuscript and interpreting the results. SGS did some statistical analysis and contributed in writing the manuscript and interpreting the results. RM and FA provided the intellectual input and designs, supervised the data collection, endorsed the protocols to be followed in the study and commented on the draft manuscript. MAM and FF contributed in the study design, provided technical advice for statistical analysis and interpreted the results. HR, MHE, FH, HP, MM, HH, MS and AP contributed in data collection, harmonising the data and preparing the manuscript with critical appraisal. EWS and AF supervised the work, provided technical advice for statistical analysis, interpreted the results and revised the manuscript critically. All authors approved the manuscript to be published.
Funding This research received no specific grant from any funding agency in the public, commercial or not-for-profit sectors.
Competing interests None declared.
Patient consent Not required.
Ethics approval This study was approved by the institutional review board of Tehran University of Medical Sciences, Tehran, Iran.
Provenance and peer review Not commissioned; externally peer reviewed.
Data sharing statement No additional data are available.