Article Text

Abstract
Objectives To investigate the variation in sugar and energy content of cakes and biscuits available in the UK.
Design We carried out a cross-sectional survey in 2016 of 381 cakes and 481 biscuits available in nine main UK supermarkets.
Methods The sugar and energy content was collected from product packaging and nutrition labelling of cake and biscuit products.
Results The average sugar content in cakes and biscuits was 36.6±7.6 and 30.0±9.2 g/100 g, respectively. The mean energy content was 406±37 for cakes and 484±38 kcal/100 g for biscuits. There was a large variation in sugar and energy content between different cake and biscuit categories and within the same category. 97% of cakes and 74% of biscuits would receive a ‘red’ (high) label for sugar.
Conclusions This research makes available baseline data of the cakes and biscuits market in the UK for future evaluation of the recently launched sugar-reduction programme. The study showed that reductions in sugar and energy content of cakes and biscuits are possible, since there was a large variation in sugar and energy content between different cake and biscuit categories and within the same category. A reduction in sugar and energy content, and overall cake and biscuit consumption, can help reduce overall sugar and energy intake in the UK and thus reduce the risk of obesity and dental caries.
- sugar
- energy
- calories
- cakes
- biscuits
This is an open access article distributed in accordance with the Creative Commons Attribution Non Commercial (CC BY-NC 4.0) license, which permits others to distribute, remix, adapt, build upon this work non-commercially, and license their derivative works on different terms, provided the original work is properly cited and the use is non-commercial. See: http://creativecommons.org/licenses/by-nc/4.0/
Statistics from Altmetric.com
Strengths and limitations of this study
This paper for the first time investigates and documents the sugar and energy content of cakes and biscuits sold in the UK.
The results demonstrate that the amount of sugar and energy can be reduced, since there was a wide variation in sugar and energy content between different categories of cakes and biscuits, as well as within the same category.
This study was based on the amount of sugar and energy provided on product nutrition labelling in-store; hence, we relied on the accuracy of the data provided on the label.
Introduction
In July 2015, a new free sugars (sugar) recommendation was announced by the Scientific Advisory Committee on Nutrition due to the link between excess sugar intake and obesity, type 2 diabetes and dental caries risk,1–7 which are all major public health problems in the UK,8–14 and contribute to significant healthcare costs.15 Free sugars includes all monosaccharides and disaccharides added to foods by the manufacturer, cook or consumer, plus sugars naturally present in honey, syrups and unsweetened fruit juices and excludes lactose when naturally present in milk and milk products, as well as sugars contained within the cellular structure of foods (ie, whole fruits and vegetables).16
In 2014, average intakes of sugar exceeded the UK recommendations (less than 5% of energy intake) in all age groups. The average sugar intake in adults is 60 g/day, which is equivalent to 240 kcals and contributes to 12% of energy intake. Some children have a higher sugar intake, 54 and 73 g/day in 4–10 and 11–18 year-olds, respectively.17 This is likely to be an underestimate of how much sugar they actually consume18 19 because under-reporting consumption of high-sugar foods and drinks is highly prevalent in surveys that rely on self-reported data.20–23
The UK government recently announced in its Childhood Obesity: A Plan for Action (2016) a sugar-reduction programme, where it is asking manufacturers to reduce sugar by 20% by 2020 in each of the nine categories of food and drink that contribute most to sugar intake in children’s diets. Cakes, morning goods (eg, croissants) and biscuits are main contributors of sugar intake in children (4–10 years), teenagers (11–18 years) and adults (18–64 years), contributing to 9%, 9% and 7% of sugar intake, respectively.17
Manufacturers can choose to achieve the 20% reduction in a number of ways: by reformulating their products (without increasing overall calories), reducing portion size or promoting their lower-sugar products. The main aim is to gradually reduce the amount of added sugar until 2020.24 Sales weighted averages (SWA) address the most popular products on the market and were used to set category-specific sugar-reduction targets per 100 g of a product. SWA for cakes is currently 34.9 g, with the aim of bringing it down to 27.9 g per 100 g by 2020.24 For biscuits, the SWA is 32.8 g to be reduced to 26.2 g per 100 g.24 The SWA allows for flexibility in the levels of sugar in different products within a category, for example, a biscuit manufacturer can continue to sell a high-sugar biscuit if the remainder of their portfolio is lower, however if the high-sugar product is a big seller, the amount of sugar will have to be reduced through reformulation, smaller portions, or price promotions will have to be removed to reduce the overall sale.24 Calorie caps for single-serve cakes and biscuits are set at a maximum of 325 kcal.24
Traditionally, cakes were considered treats for special occasions, such as birthdays, but now only 3 in 10 people buy cakes for this reason.25 Cakes are consumed more frequently, and the market is changing with the rise in small cakes. The volume sales of small cakes have been growing substantially and has now overtaken large cakes, with a market share of 44% and 37%, respectively.26 These cakes are likely to be consumed as regular snacks, contributing to the increase in sugar intake.17
Biscuits are also widely consumed in the UK; 9 in 10 adults eat sweet biscuits regularly, with 55% of people eating them at least once a week.27 A Mintel report published in 2015 estimated that values sales in the market would grow by 4% by 2019.27 Biscuits are not often viewed as a ‘treat’ like chocolate and desserts. Instead they may be consumed as a regular staple with a hot drink, and therefore contribute to excess sugar intake.27
Supermarket own label products dominate the cake market in the UK, equating to 56% of shares by value.25 Premier Foods manufactures the two biggest brands on the market, Mr Kipling and Cadbury cakes, with 15% and 6% of shares by value, respectively.25 In 2014-2015, the biscuit market was dominated by United Biscuits (26%), own label products (23%) and Mondelez International (11%) by value share.27
The purpose of this study was to document the levels of sugar and energy in cakes and biscuits in the UK as the data available are generally owned by commercial companies and not in the public domain for comparison and monitoring. This research aims to (a) evaluate the sugar and energy content listed on the labels of cakes and biscuits sold in the UK, (b) report the variability in sugar and energy content, (c) assess the sugar content in relation to the UK’s new daily recommendation for sugar intake and by cake and biscuit manufacturers in the UK and (d) compare current serving sizes with the maximum calorie cap of 325 kcal suggested in the sugar-reduction programme.
Methods
The data were collected from product packaging and nutrition labelling in 2016. The survey was designed as a comprehensive survey of all cake and biscuit products available in a snapshot in time, using one large outlet per each of the nine main supermarkets.
Data collection
For each cake and biscuit, the data collected included the company name, brand name, product name, pack weight, serving size, total sugars (g) and energy (kcal) content per 100 g as well as per suggested serving size. All data were double-checked after entry, and a further 5% of entries were checked against the original source in a random selection of products.
Data on total energy content was collected since it encompasses the fat, carbohydrate, protein and sugar content of products.
Stores
Data were collected from each of the major UK supermarkets (Aldi, ASDA, Lidl, Marks and Spencer, Morrisons, Sainsbury’s, Tesco, The Co-operative and Waitrose) as these supermarkets collectively hold over 93.2% of the grocery market share.28
Product categories
Only products with similar formulation/product description were categorised together (tables 1 and 2). Any uncategorised products contributed to the all products data reported. The products were also categorised separately into supermarket own label and branded. Some product categories were excluded from the study (online supplementary file 1).
Supplementary file 1
Description and examples of cake categories
Description and examples of biscuit categories
Inclusion/exclusion criteria
We included own label and branded cake and biscuit products. We excluded products without nutrition information labelling, such as in-store self-serve bakery items.
Analysis
Per 100 g: Some brands sell the same formulation in different serving sizes. The 100 g data only included an example of one formulation regardless of the different serving sizes.
Per serving: The per-serving data included all the different sugar and energy content available per suggested serving size, or per pack size ≥ 10 g or <150 g for cakes and ≥ 10 g or <90 g for biscuits.
High, medium and low criteria for sugar content: The sugar content was compared with the UK front-of-pack colour-coded labelling for foods: sugars—red/high >27 g/portion or >22.5 g/100 g, amber/medium >5.0 and ≤22.5 g/100 g, green/low ≤5.0 g/100 g.29
Maximum sugar intake: The sugar content was also compared with the maximum daily recommendation for sugar intake (30 g for adults and 19g for 4-6 year-olds).16
Calorie cap: The energy content per serving was compared with the maximum calorie cap of 325 kcal suggested in the sugar-reduction programme.30
Manufacturer: The sugar and energy content was compared between manufacturers, where a manufacturer had five or more products in the sample.
Statistical analysis
Comparison among products
Independent Samples t-test was used to compare the levels of sugar and energy between supermarket own label and branded products.
Data are reported as mean, SD and range as indicated. Significance in all tests carried out was deemed as being p<0.05. The data was analysed using SPSS software V.22.
Results
Cakes
Nutrition information was collected for 381 products.
Sugars
Figure 1 and table 3 show the sugar content in different categories of cakes per 100 g. A total of 381 products were included in the per 100g analysis. The average sugar content in cakes was 36.6±7.6 g/100 g. There was a large variation in sugar content between different categories of cakes and within the same category of cake (eg, among all chocolate cake products) ranging from 11.3 to 62.0 g/100 g. On average, Battenberg (56.4±7.3 g/100 g) contained the highest amounts of sugar, ranging from 46 to 62 g, followed by Genoa (45.9±3.7 g/100 g) and red velvet cakes (44.2±4.2 g/100 g), while blueberry muffins (24.6±1.4 g/100 g) contained the lowest amount of sugar. The high amount of sugar in Genoa cakes is partly due to the added dried fruits. Branded cakes had a slightly higher sugar content per 100 g compared with supermarket own label (37.7 g vs 36.3 g), but the difference was not statistically significant (p=0.137). Ninety-seven per cent of cakes would receive a ‘red’ (high) label for sugar (>22.5 g/100 g) (figure 1).
A total of 370 products provided nutrition information per suggested serving size and were included in the per serving analysis (table 4). The mean sugar content in cakes was 16.9±7.6 g/serving. Red velvet cakes contained the highest sugar content per serving (28.2±9.8 g, almost an adult’s entire maximum daily intake for sugar), followed by coffee and walnut cakes (24.9±2.8 g).
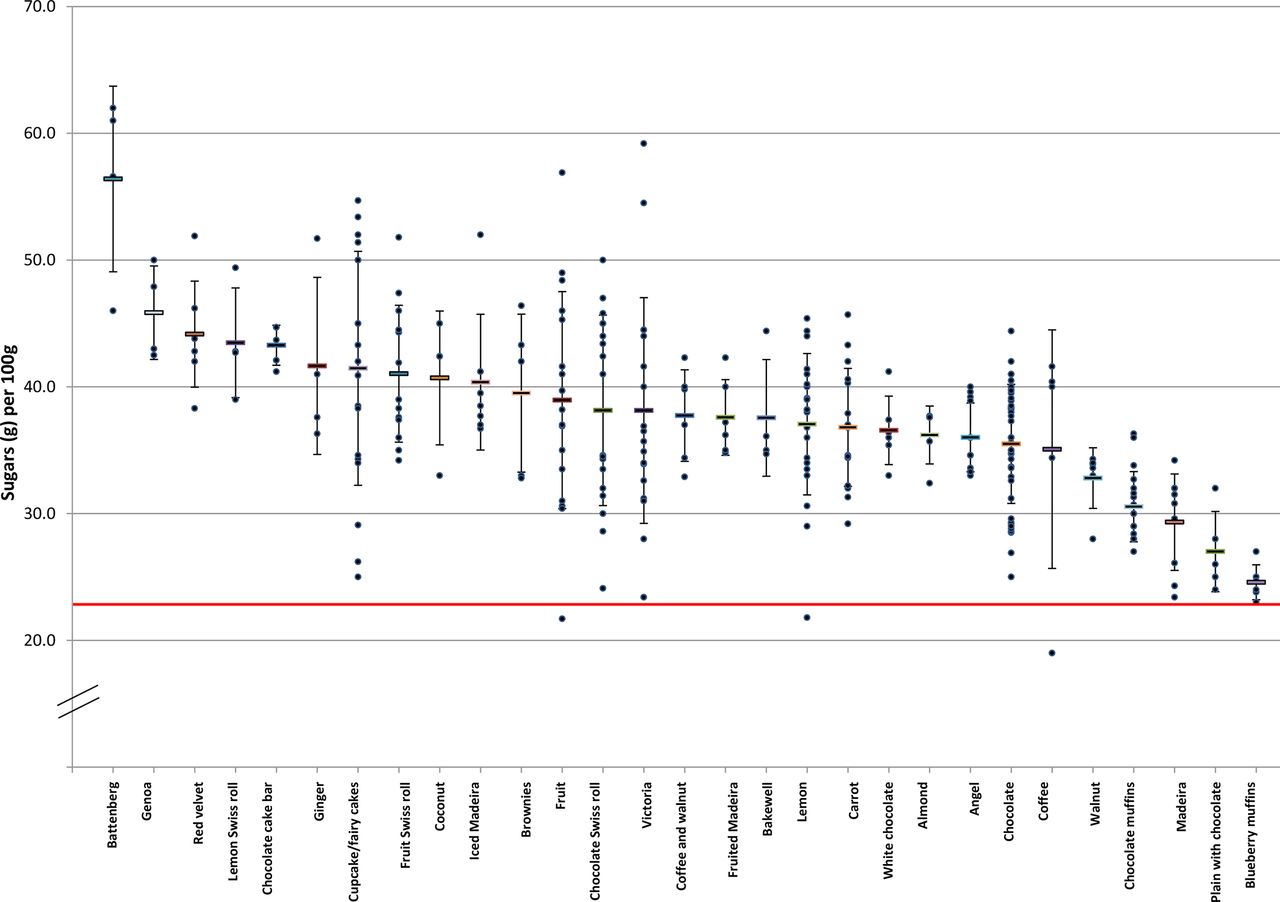
Sugar content in different cake categories (g/100g), red line denotes the red (high) label criteria for sugar (>22.5 g).
Sugar and energy content in cakes per 100 g
Sugar and energy content in cakes per serving
On average, a serving of cake contains over half of an adult’s (30 g/day) and almost all of a 4–6 year-old child’s (19 g/day) maximum daily recommended sugar intake.
Energy
Figure 2 and table 3 show the energy content in different categories of cakes per 100 g. The average energy content in cakes was 406±37 kcal/100 g. There was a large variation in energy content between different categories of cakes and within the same category of cakes ranging from 273 to 502 kcal/100 g. On average, plain sponge with chocolate (446±16 kcal/100 g) contained the highest amount of energy, ranging from 421 to 457 kcal, while Genoa cakes (356±16 kcal/100 g) contained the lowest amount of energy.

Energy content in different cake categories (kcal/100g).
The mean energy content in cakes was 188±78 kcal/serving. Coffee and walnut cakes contained the highest amount of energy per serving (287±34 kcal/serving) and Bakewell (124±30 kcal/serving) contained the lowest (table 4). A total of 19 products exceeded the maximum calorie cap of 325 kcal per serving.
Among the manufacturers with five or more cakes, the McVitie’s product range contained the highest average sugar (43.1±7.3 g) and Premier Foods contained the highest energy (424±26 kcal) per 100 g (table 5).
Sugar and energy content in cakes by manufacturer per 100 g
Biscuits
Nutrition information was collected for a total of 481 biscuit products.
Sugars
Figure 3 and table 6 show the sugar content in different categories of biscuits per 100 g. A total of 481 products were included in the per 100g analysis. The average sugar content in biscuits was 30.0±9.2 g/100 g. There was a large variation in sugar content between different categories of biscuits and within the same category of biscuits, ranging from 12.0 to 74.0 g/100 g. On average, iced biscuits (43.5±6.3 g/100 g) contained the highest amounts of sugar and shortbread biscuits (17.5±2.8 g/100 g) contained the lowest. Branded biscuits had a significantly higher sugar content compared with supermarket own label (32.8 g vs 28.3 g, P<0.001). Seventy-four per cent of biscuits would receive a ‘red’ (high) label for sugar (>22.5 g/100 g) (figure 3).
A total of 408 products provided nutrition information per suggested serving size, where the serving size was ≥10 g (table 7). The mean sugar content in biscuits was 6.2±3.7 g/serving. Breakfast biscuits with filling had the largest serving size, therefore the highest sugar content (12.0±2.4 g/serving), followed by breakfast biscuits without filling (10.2±2.1 g).

Sugar content in different biscuit categories (g/100g), red line denotes red (high) label criteria for sugar (>22.5 g).
Sugar and energy content in biscuits per 100 g
Sugar and energy content in biscuits per serving
On average, a biscuit serving (as set by the manufacturers) contains 21% of an adult’s (30 g/day) and 33% of a 4–6 years old child’s (19 g/day) maximum recommended sugar intake.
Among the 29 breakfast biscuits (filled and unfilled), 59% contained more than a third of an adult’s (≥10 g) maximum daily recommendation of sugar per serving; this is partly because one serving is 2–4 biscuits.
Energy
Figure 4 and table 6 show the energy content in different categories of biscuits per 100 g. The average energy content in biscuits was 484±38 kcal/100 g. There was a large variation in energy content between different categories of biscuits and within the same category of biscuit ranging from 331 to 585 kcal/100 g. On average, shortbread biscuits with additions (528±18 kcal/100 g) contained the highest amount of energy and fruit-filled biscuits (391±11 kcal/100 g) contained the lowest amount of energy.
The average energy content in biscuits per serving was 97±46 kcal (table 7). Only one product exceeded the maximum calorie cap of 325 kcal per serving.

Energy content in different biscuit categories (kcal/100g).
Among the manufacturers with five or more products, the Fox’s product range contained the highest average sugar content, 35.8±8.5 g/100 g, and Dr. Schar product range contained the highest average energy content, 512±10 kcal/100 g (table 8).
Sugar and energy content in biscuits by manufacturer per 100 g
Discussion
This research makes available important baseline data on the sugar and energy content of cakes and biscuits in the UK, for future evaluation of the recently launched sugar-reduction programme. This study also showed that the levels of sugar and energy in products can be reduced, since there was a large variation in sugar and energy content within the same category of cakes and biscuits. For instance, some manufacturers can produce chocolate cake bars with 22% fewer calories per 100 g. Biscuits contain less sugar compared with cakes, but people often consume more than one serving (ie, more than one biscuit).
There is extensive evidence that consuming too much sugar and energy is a major contributor to obesity and dental caries.1 16 Hence, there is an urgent need to reduce the amount of sugar and energy consumed. The sugar and energy content in cakes and biscuits can be reduced through reformulation, that is, by gradually reducing the amount of sugar and total energy.30 Indeed, evidence from modelling studies suggests that sugar reformulation programmes can potentially reduce sugar intake and improve health outcomes.31–35
Studies show that biscuits can be reformulated to reduce sugar and energy content, for example, by using prebiotic fibre (fructo-oligosaccharide),36 37 acesulfame-K, polyols,38 39 stevia, coffee silverskin40 and protein.37 The reformulated biscuits were acceptable in terms of eating quality, flavour, colour and improved nutritional value.36 38 40 Similar studies have been carried out to produce reduced sugar and reduced energy cakes and muffins.41–45 Indeed, many consumers are increasingly interested in buying cakes made with alternatives to sugar (eg, xylitol).46
Despite this, manufacturers have made little progress in reducing sugar in cakes and biscuits since 97% of cakes and 74% of biscuits would receive a ‘red’ (high) label for sugars per 100g and only one in four cake launches featured low/no/reduced fat claims in 2013 and less than 1% claimed to be low/no/reduced sugar.26
The industry should be encouraged to shift sales to new ‘healthier’ alternatives with significantly lower sugar and energy levels, since this will also help to achieve the necessary change in the SWA. However, for the full benefits of reformulation to be seen, it needs to permeate the entire cake and biscuit supply chain; and therefore argues against making new products with claims, for example, ‘x% less fat/sugar’. Owing to the huge volume of standard popular cakes and biscuits consumed, even small reductions could have a significant impact on sugar and energy intake of the entire population. Reformulating in ways such as reducing sugar, replacing icing and buttercream with low-fat yoghurt in frosting and fillings, making cakes with fruit and vegetables (eg, carrot, beetroot) and biscuits with dried fruits. Alternatives with claims, even after several years on the market, generally only account for a small proportion of sales, and are unlikely to change sugar and energy intake of the entire population significantly.24
Some portion sizes are getting bigger and pose a greater challenge.47 Research shows that larger portion sizes result in more calories being consumed and it is estimated that if larger-sized portions were removed from the diet completely, this could reduce energy intake by up to 16%.48 Therefore, the cakes and biscuits sector need to reduce portion size of the large portions available. Furthermore, many sweet biscuits are often packaged in formats that encourage greater consumption. Some consumers limit how often they eat biscuits because it is easy to eat too many biscuits once the pack is opened.49 As such, packaging formats offering portion control would help.27 However, there is a lack of research on the threshold size for smaller portions, eg, the cut-off point where consumers will consume two portions instead of one. Public Health England has defined single-serve cakes as all cakes above 10 g or ≤150 g and biscuits as all products above 10 g or ≤80 g.24 The survey showed that not many products exceeded the maximum calorie cap of 325 kcal. This may suggest the calorie cap is more applicable to cakes and biscuits served in the out-of-home than the retail sector, or that the cap is not challenging enough.
Aside from reformulation and portion size restrictions, evidence shows that consumption of cakes and biscuits is influenced by in-store promotions. One in three people stock up on cakes when on promotion.25 Therefore, reducing the level of promotion on cakes and biscuits is also necessary to reduce intake.30
Limitations
Our study was based on sugar and energy content data provided on cake and biscuit product packaging labels in store; hence, we relied on the accuracy of the data provided on the label. It is assumed that the manufacturers provide accurate and up to date information in line with regulations. However, further studies should include sugar and energy content determined through laboratory analysis to ensure greater accuracy and to achieve a better understanding of the types of sugars used. This is because we were unable to distinguish if sugars labelled on the packaging are all free sugars or if some are from milk, fruits and vegetables.
This study did not include Christmas cakes and biscuits which are typically more indulgent; therefore, depending on the time of year, results may be slightly different. Also, this survey did not include in-store bakery items as the nutrition labelling was not available on pack for these products, which may have affected the results.
Furthermore, this study did not analyse the fat and saturated fat contents of the cakes and biscuits, however total energy content was included, which would encompass the amount of energy coming from fat and therefore any potential future reductions in the amount of total energy can be achieved from reductions in fat and/or sugar.
Our data do not include sugar and energy content of cakes and biscuits in the out-of-home sector; this is due to the lack of publicly available data. Future studies should endeavour to include this type of data too, especially as purchases of these products have increased in recent years, and food eaten out of the home now accounts for a growing proportion of the total amount of food eaten. More than 25% of adults and one-fifth of children buy and consume food out of home/on the go at least once a week.50
Nevertheless, the results of this study document the sugar and energy content of cakes and biscuits sold in the UK, providing baseline data to evaluate public health interventions such as the sugar-reduction programme and potentially incentivise the cakes and biscuits industry to reformulate their products.
Conclusion
This research provides baseline data of the cakes and biscuits market in the UK for evaluation of the recently launched sugar-reduction programme. The study also showed that reduction in the sugar and energy content of cakes and biscuits is possible because there was a large variation in sugar and energy content not only between different categories of cakes and biscuits but also within the same category. A reduction in sugar and energy content and overall cake and biscuit consumption can help reduce overall sugar and energy intake in the UK and thus help to reduce the risk of obesity and dental caries.
References
Footnotes
Contributors KMH conducted the research. KMH and FJH analysed the data. SAA helped check the data. KMH wrote the first draft of the manuscript and all authors contributed to the interpretation of the results and revision of the manuscript, and approved the final manuscript.
Funding The authors have not declared a specific grant for this research from any funding agency in the public, commercial or not-for-profit sectors.
Competing interests KMH and SAA are employees of Consensus Action on Salt, Sugar and Health (CASSH), a non-profit charitable organisation. FJH is a member of Action on Salt and its international branch World Action on Salt & Health (WASH) and does not receive any financial support from Action on Salt or WASH. GAM is Chairman of Blood Pressure UK (BPUK), Chairman of CASSH and Chairman of WASH. BPUK, CASSH and WASH are non-profit charitable organisations.
Patient consent Not required.
Provenance and peer review Not commissioned; externally peer reviewed.
Data sharing statement The sugar and calorie information of each product included will be available on emailing the corresponding author.