Article Text

Abstract
Objectives Maternal, newborn and child health (MNCH) services represent opportunities to integrate postpartum family planning (PPFP). Objectives were to determine levels of MNCH–family planning (FP) integration and associations between integration, client characteristics and service delivery factors in facilities that received programmatic PPFP support.
Design and setting Cross-sectional client flow assessment conducted during May–July 2014, over 5 days at 10 purposively selected public sector facilities in India (4 hospitals) and Kenya (2 hospitals and 4 health centres).
Participants 2158 client visits tracked (1294 India; 864 Kenya). Women aged 18 or older accessing services while pregnant and/or with a child under 2 years.
Interventions PPFP/postpartum intrauterine device—Bihar, India (2012–2013); Jharkhand, India (2009–2014); Embu, Kenya (2006–2010). Maternal, infant and young child nutrition/FP integration—Bondo, Kenya (2011–2014).
Primary outcome measures Proportion of visits where clients received integrated MNCH–FP services, client characteristics as predictors of MNCH–FP integration and MNCH–FP integration as predictor of length of time spent at facility.
Results Levels of MNCH–FP integration varied widely across facilities (5.3% to 63.0%), as did proportion of clients receiving MNCH–FP integrated services by service area. Clients travelling 30–59 min were half as likely to receive integrated services versus those travelling under 30 min (OR 0.5, 95% CI 0.4 to 0.7, P<0.001). Clients receiving MNCH–FP services (vs MNCH services only) spent an average of 10.5 min longer at the facility (95% CI −0.1 to 21.9, not statistically significant).
Conclusions Findings suggest importance of focused programmatic support for integration by MNCH service area. FP integration was highest in areas receiving specific support. Integration does not seem to impose an undue burden on clients in terms of time spent at the facility. Clients living furthest from facilities are least likely to receive integrated services.
- family planning
- postpartum
- integration
- maternal and newborn health
- child health
This is an Open Access article distributed in accordance with the Creative Commons Attribution Non Commercial (CC BY-NC 4.0) license, which permits others to distribute, remix, adapt, build upon this work non-commercially, and license their derivative works on different terms, provided the original work is properly cited and the use is non-commercial. See: http://creativecommons.org/licenses/by-nc/4.0/
Statistics from Altmetric.com
Strengths and limitations of this study
This cross-sectional study gleaned detailed information on client flow patterns, documenting the various combinations of care received by individuals during each visit to public health facilities in Kenya and India.
This study addresses a gap in documentation of postpartum family planning programming and coverage measures for receipt of integrated services, which is often difficult to measure when looking at clinical records or health facility service statistics due to inadequate details on services provided or inability to link data on patients accessing multiple service areas.
The great variety in the percentage of clients receiving integrated maternal, newborn and child health and family planning services, both across facilities as well as between service areas within individual facilities, necessitated disaggregation of results to aid in interpretation, which may have been a limitation.
Analysis of family planning integration with antenatal care and child health services yielded stronger results than postnatal care due to low overall numbers of clients accessing postnatal care.
For pragmatic reasons, integration during labour and delivery services was not assessed.
Introduction
Increased contraceptive use has reduced maternal deaths by 40% over the past 20 years.1 If pregnancies are spaced over 2 years apart, infant deaths can be reduced by 10% and child deaths (ages 1–4 years) by 21%.2 Around the time of childbirth, women may not seek family planning (FP) information or services, yet they often attend antenatal care (ANC), postnatal care (PNC) or child health services. These contact points span the maternal, newborn and child health (MNCH) continuum of care and offer valuable, reliable opportunities for healthcare providers to reach women at risk of closely spaced pregnancies with FP counselling and services.2–4
Despite evidence of increased FP uptake when FP is integrated with maternal and newborn health, childhood immunisation, nutrition programmes and prevention of mother-to-child transmission of HIV (PMTCT) services,5–8 opportunities for integrated service delivery are often missed.9 10 Postpartum family planning (PPFP) programmes should take advantage of all services along the MNCH continuum of care, in facilities and communities, to provide women with FP information and services to improve birth spacing and address unmet need for contraception.11–13 An FP research prioritisation exercise in the WHO Bulletin ranked identifying the mechanisms of PPFP integration with other services as one of the top-three priority areas.14
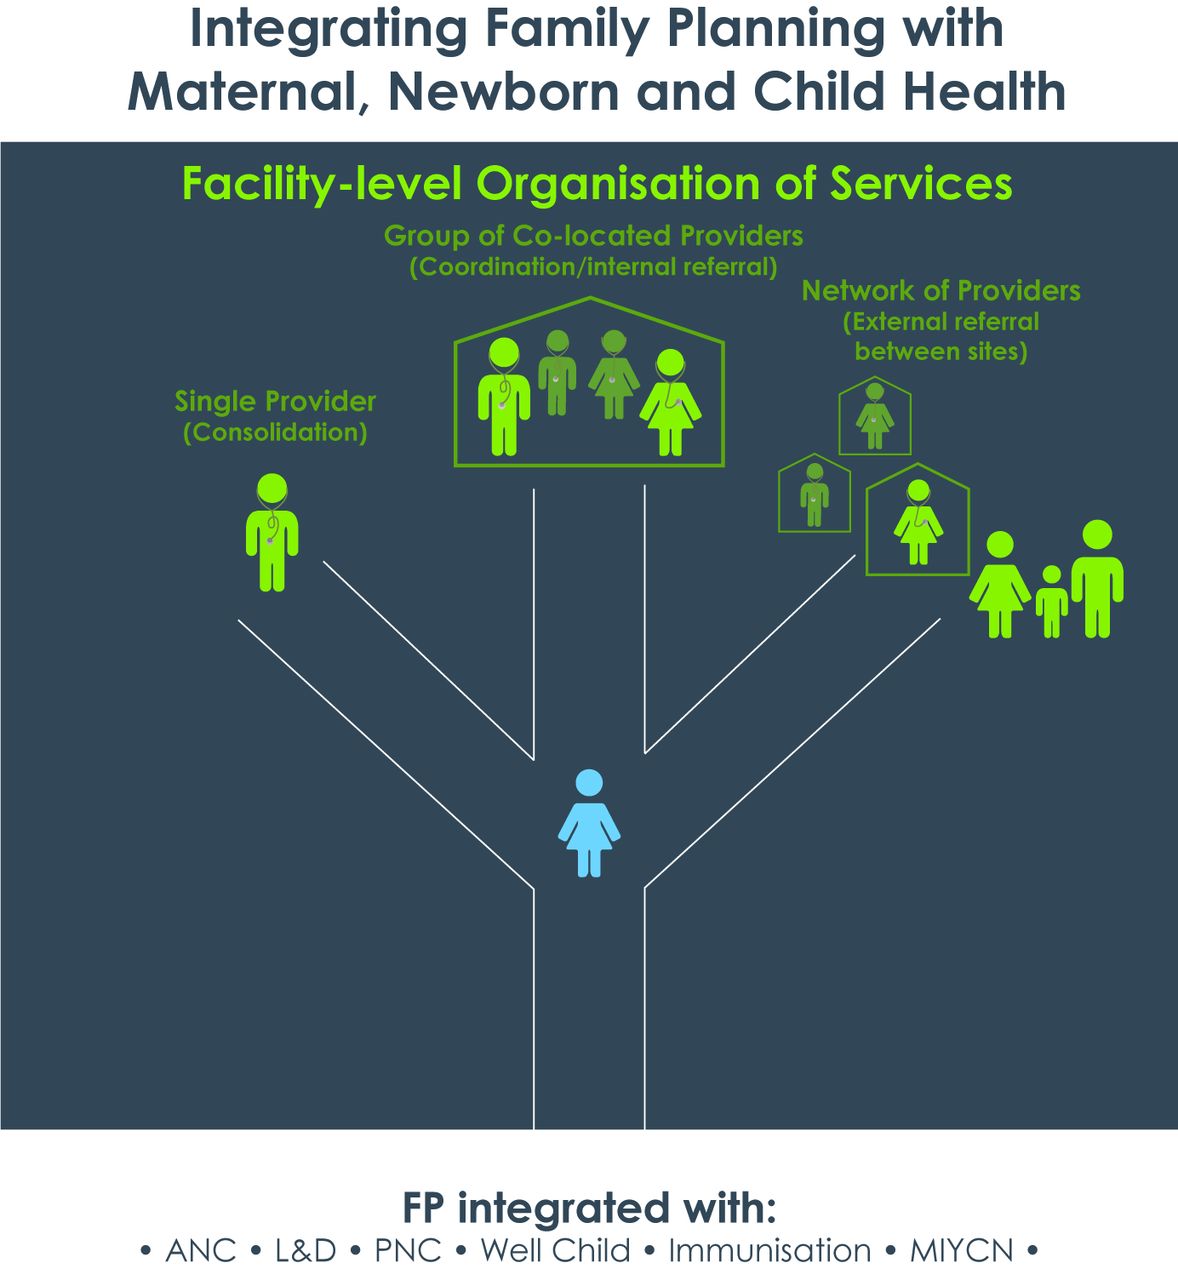
Papers have defined integration in different ways, usually along a continuum. Ahgren and Axelsson15 proposed the term ‘fully segregated’ to mean use of more than one service at a health facility is accidental or client driven versus ‘fully integrated’ in which multiple units pool resources. While Ahgren’s conceptual model was tested in Sweden, Church et al 16 developed definitions for a low-income country setting. They use the terms ‘fully stand-alone’ to describe separate service delivery (eg, an HIV clinic distinct from another facility); ‘fully integrated’ defined as all services provided in a single room by a single provider; ‘partially integrated’ meaning care provided by different providers in different rooms of a facility and ‘partially stand-alone’ to mean care from providers in different buildings in a larger compound.16 We use the terms ‘single provider’ to refer to consolidated care provided by the same person at a facility and ‘multiple co-located providers’ to refer to integrated service delivery via internal referrals between providers within the same facility, as opposed to a ‘network of providers’ where clients are referred externally to different sites.
Measurement of integrated healthcare delivery poses challenges, including determining what to measure and how to measure it in a cost-effective way.17–19 Authors of a systematic review of integrated services ascribe the difficulty in measurement to the variety in services integrated and approaches used.17 Another systematic review of studies in mostly developed settings found that measurement methods used were relatively resource intensive, such as patient and provider surveys, focus group discussions, hospital manager or policy-maker questionnaires or qualitative interviews, reviews of patient data or medical records and direct observation.20 Few reviewed studies used direct observation,20 presumably because of its resource-intensive nature, yet it is particularly useful when clinical records provide inadequate details about services rendered.21 To overcome some shortcomings of these methods, the Integra Initiative research project developed a simple client flow assessment tool to track whether clients received maternal and child health (MCH) care integrated with HIV and reproductive healthcare.9
To address the gap in documentation of PPFP programming and measurement of service integration and to strengthen the body of learning around integration of PPFP into MNCH and nutrition services, we conducted a descriptive evaluation of integrated PPFP implementation models in Kenya and India. This paper presents the results of a study component that assessed the extent to which pregnant clients and women with a child under 2 years of age accessing MNCH services at selected facilities in India and Kenya also received FP services. The assessment approach adapted the client flow tool from the Integra Initiative.9 In addition, we explored which client characteristics predicted receipt of integrated MNCH–FP services and whether integration was associated with differences in length of client visit to the health facility.
Methods
In Kenya, facilities were selected from Embu County and Bondo Sub-County, Siaya County. Embu was an early intervention site for introduction of a comprehensive postnatal care package (2006–2008) and postpartum intrauterine contraceptive device (PPIUD) work (2007–2010) through US Agency for International Development (USAID)-supported projects encompassing PPFP integration with ANC, maternity services, postnatal care and community-level maternal and newborn health promotion. In Bondo, a USAID-funded programme demonstrated feasibility of integrating maternal, infant and young child nutrition (MIYCN) and FP across ANC, PNC and child health at facility and community levels (2011‒2014).
In India, facilities were selected from Jharkhand and Bihar states. In Jharkhand, USAID programmes supported strengthening PPFP services, including PPIUD and FP integration with ANC and maternity services (2009‒2014). In Bihar, the Bill & Melinda Gates Foundation funded an expansion of the PPFP/PPIUD work with a stronger demand generation and community component (2012‒2013).
The study used a cross-sectional design to track the services a client received and determine if PPFP services (including FP counselling and/or provision of FP methods) were offered consistently as expected under the implementation model. Results presented here are a component of a larger mixed-methods descriptive evaluation of PPFP integration that included client and provider surveys and semistructured interviews with providers and key informants. Study sites included hospitals and health centres, purposively selected based on duration, intensity and level of programmatic support for PPFP integration, as well as pragmatic factors like accessibility (see table 1). A separate paper on the characteristics of successful integrated FP and MCH services provides additional background on study locations and sites,22 and related articles on the FP and MIYCN integration work in Bondo23 and the postnatal care package in Embu24 share learning from those demonstration programmes.
Study sites, interventions and tier of service
Data were collected in 2014 during May–June in India and June–July in Kenya. A one-page client flow tool was administered by research assistants (RAs) for 5 consecutive weekdays at each facility. The study team oriented facility service providers on how to complete the client flow form. RAs were positioned to screen as many eligible female clients as possible seeking care in the target service delivery areas. Inclusion criteria included clients who were: (1) seeking services at targeted MNCH service delivery areas (ANC, PMTCT, PNC, MIYCN and other child health services such as well–child visits and immunisation) in selected health facilities and (2) women aged 18–49 years who were pregnant or had a child under 2 years of age. Clients seeking labour and delivery services were excluded for practical reasons. After screening to confirm eligibility and obtaining oral informed consent, the RA asked the client to carry the client flow checklist throughout her visit at the facility. The RA documented client arrival time on the form, gave it to the client and asked her to give it to any facility staff she interacted with. Clients were asked to return the form to the RA when leaving the facility, at which point the RA documented departure time.
Study data were cleaned, coded and managed using Research Electronic Data Capture (REDCap). Cleaned data were exported to SPSS Statistics V.22 and Stata V.13 for analysis.
The unit of analysis was client visit: each completed client form that tracked the number of providers the client accessed at the health facility that day (up to five) and the services and referrals received from each provider. Records for 16 visits of clients under 18 years of age were excluded from analysis per the research protocol. Consenting clients who met the eligibility criteria but returned blank forms were also excluded, as were two records that failed logic checks (ie, had marks for both ANC and PNC services provided to the client during their visit). In total, 73 of the original 2231 records were excluded from analysis (around 3%).
The primary outcome examined was receipt of integrated MNCH–FP services, that is, the proportion of all client visits during which the client received:
Any MNCH service, defined as: ANC, PNC (postnatal check for mother and/or postnatal check for baby) and/or child health (child immunisation, child weighing/mid-upper arm circumference, iron/folate for child, vitamin A for child and/or child health in general, eg, visits where the provider wrote in the ‘other’ category that they conducted a child examination or treatment for childhood illness); as well as
Any FP service: FP counselling, lactational amenorrhoea method counselling, FP services (ie, receipt of an FP method).
See online supplementary file 1 for a sample form used for data collection.
Supplementary file 1
We disaggregated results by health facility and by MNCH service area in which the client accessed services—ANC, PNC and/or child health. Differences in the percentages of visits with MNCH–FP integration by facility and service area were anticipated based on the focus, duration and timing of PPFP programmatic support. In Bihar and Jharkhand, India, where the programme emphasised PPIUD, we expected to see higher levels of FP integration occurring during ANC visits versus PNC or child health. In Embu, we were interested to what degree integration was sustained after the end of the intensive programme phase in 2010. In Bondo, Kenya, the only study site where the programme focused on MIYCN–FP integration, we expected to see a higher percentage of visits with child health and FP integration compared with other sites.
We also explored the integration model in each site, that is, whether clients who received integrated MNCH–FP services did so from a single provider or visited multiple co-located providers (see figure 1). ANC clients were considered as having seen multiple co-located providers if they received ANC services from one provider and FP services from another provider or ANC services from one provider and ANC and FP services from another provider and so on, at the facility. Our analysis focused only on MNCH and FP services and does not include other services the client may have accessed during their visit like laboratory tests or pharmacy visits.

Types of service integration at the facility level. ANC, antenatal care; FP, family planning; L&D, labour and delivery; MIYCN, maternal, infant and young child nutrition; PNC, postnatal care.
Client characteristics as predictors of receipt of integrated MNCH–FP services were also explored. A multiple logistic regression model was used to estimate the association between overall MNCH–FP integration (ANC, PNC and/or child health visit along with FP visit) and client characteristics: country, type of client (adult alone vs adult with child), mother’s age, length of time spent travelling to facility, length of time spent at facility and number of providers seen. The logistic regression model was adjusted for the correlation between clients within the same facility. Regression analysis was used to determine the association between the client’s length of time spent at the facility as the outcome and receipt of integrated MNCH–FP services as the main exposure. Bootstrapping was used to deal with non-normality of the data. Correlation among clients within the same facility was accounted for.
The study was approved by the Johns Hopkins Bloomberg School of Public Health Institutional Review Board, the Indian Institute of Health Management Research and the Kenya Medical Research Institute. The manuscript was prepared following the STROBE statement (see online supplementary file 2).
Supplementary file 2
Results
Client characteristics
There were 2158 visits tracked: 1294 in India and 864 in Kenya (see table 2A and table 2B). Over three-quarters of client visits in Kenya involved an adult with a child (78.8%), while in India about half of visits consisted of an adult with a child (47.8%) versus an adult visiting alone. The average age of women tracked ranged from 23.1 (SD=3.0) years in Jharkhand Hospital 2 to 27.9 (SD=6.2) years in Embu Health Centre 1.
Descriptive characteristics of clients, visits tracked and number of providers clients saw by facility in India
In both India and Kenya, the average length of time the client spent travelling to the facility ranged from about half an hour to an hour. Average time clients spent at the facility fluctuated widely by facility in India. Clients in Bihar Hospital 2 spent on average 46 min at the facility, while clients in Bihar Hospital 1 and both Jharkhand sites were at the facility for longer than an hour on average (70–106 min). In Kenya, clients at all sites spent over an hour on average at the facility, from 80 min in Bondo Hospital to over 2 hours (137 min) in Embu Health Centre 1.
Descriptive characteristics of clients, visits tracked and number of providers clients saw by facility in Kenya
Integration by facility and service area
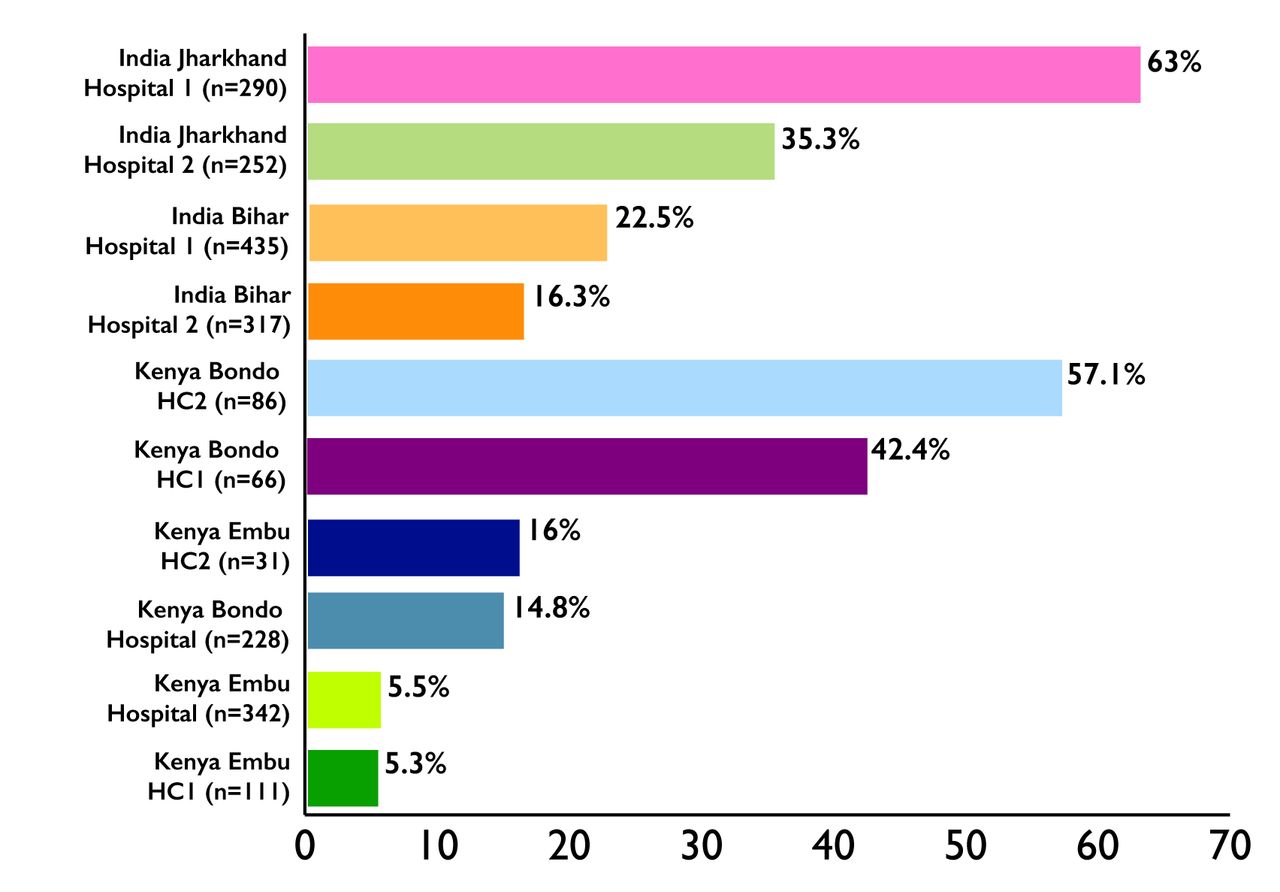
Figures 2 and 3 display the proportion of visits where clients received integrated MNCH–FP services, by facility (figure 2) and by MNCH service area within each facility (figure 3). MNCH–FP integration varied widely by facility (see online supplementary file 3 for the total and proportion of all visits where clients received integrated MNCH and FP services by facility and online supplementary file 4 for the proportion of MNCH visits where clients received integrated MNCH–FP services by service area). In India, receipt of MNCH–FP integrated services ranged from 16.3% of MNCH client visits in Bihar Hospital 2 to 63% in Jharkhand Hospital 1. In Kenya, only 5.5% of MNCH visits in Embu Hospital reflected MNCH–FP integration, compared with 14.8% in the Bondo Hospital and 57.1% in Bondo Health Centre 2.
Supplementary file 3
Supplementary file 4

Percentage of client visits with integrated MNCH and FP services received (out of MNCH visits). FP, family planning; HC, health centre; MNCH, maternal, newborn and child health.

Percentage of integrated MNCH and FP visits by MNCH service area and facility. ANC, antenatal care; FP, family planning; HC, health centre; MNCH, maternal, newborn and child health; PNC, postnatal care.
In India, analysis by service area showed higher levels of FP integration with ANC services versus PNC or child health. In Bihar, 28.1%‒35.2% of clients receiving ANC services also received FP services. By contrast, only 0%‒10.9% of clients receiving PNC and 2.2%‒4.1% of clients receiving child health services also received FP services. In Jharkhand, 71.1%‒73.2% of clients accessing ANC also receiving FP, but PNC–FP integration was also relatively high at 60% of clients accessing PNC. In Jharkhand, child health–FP integration was quite different between the two hospitals, with 55.7% of clients accessing child health services in Jharkhand Hospital 1 but only 6.2% in Jharkhand Hospital 2.
In Kenya, Bondo health centres recorded higher integration across all MNCH service areas than Bondo Hospital. Across ANC, PNC and child health services in each of the Bondo health centres, 40% to 85% of clients in each service area also received FP services. By contrast, at Bondo Hospital only 1.8% of clients accessing ANC, about one-third (34.5%) of clients accessing PNC and one-fifth (20.2%) of clients accessing child health also received FP services. Embu sites showed greater FP integration with ANC (14.3%‒28.6% of ANC clients) than in other service areas such as child health (3.1%‒10.5% of child health clients).
Integration models
Table 3 outlines the percentage of clients receiving integrated MNCH–FP services from a single provider versus multiple co-located providers, demonstrating a stark difference by site and service area. Bihar Hospital 2 showed that nearly all (97.9%) clients who received both ANC and FP received both services from a single provider, compared with only a quarter (24.6%) at Bihar Hospital 1. In Jharkhand Hospital 1, 38.9% of ANC clients who received FP counselling did so from the same ANC provider, whereas in Jharkhand Hospital 2, virtually none (1.4%) received both services from a single provider.
Total integrated MNCH–FP visits and visits in which those services were received from a single provider, by service area and facility
In Bondo Hospital in Kenya, ANC–FP integration was too rare to draw inferences, but in PNC and child health, about half (50%, 48%, respectively) of FP integration was provided by a single provider. In Bondo health centres, single provider integration was even more prevalent; Bondo Health Centre 2 recorded 100% of ANC–FP clients, 94.1% of PNC–FP clients and 91.7% of child health–FP clients received these services from just one provider. In the hospital in Embu, the majority of FP integration (80% in ANC and 71.4% in child health) were carried out by a single provider. Embu health centres had too few clients receiving integrated services to evaluate.
Client characteristics as predictors of receipt of integrated services
A logistic regression model (table 4) examining client characteristics as predictors of MNCH–FP integration estimates that the odds of integration are roughly half for clients travelling between 30 and 59 min than for those travelling less than 30 min after adjusting for country, whether the client attended with a child, client’s age, length of time spent at facility and numbers of providers seen (OR 0.520, 95% CI 0.408 to 0.662, P<0.001). Similarly, the odds of integration for clients travelling more than an hour are 0.4 times the odds of integration for clients travelling less than 30 min to the facility (95% CI 0.281 to 0.592, P<0.001). The odds of integration are 2.369 times higher for each additional provider seen at the facility after controlling for country, attendance with a child, client’s age, length of time spent at facility and length of time spent travelling to facility (95% CI 1.509 to 3.717, P<0.001). Length of time spent at the facility is not significantly associated with receipt of MNCH–FP integrated services.
Multiple logistic regression model of client characteristics as predictors of MNCH–FP integration
Integration as predictor of client experiences
A multivariate regression model was used to estimate the association between MNCH–FP integration and time spent at the facility (table 5), adjusting for other patient characteristics (country, whether or not a client attended with a child, client’s age and length of time spent travelling to the facility). The model estimates that time spent at the facility increased by 10.5 min for patients with MNCH–FP integration versus patients accessing MNCH services without FP services, but the association was not statistically significant (95% CI −0.952 to 21.92). Clients travelling 30‒59 min to the facility spent 10.2 min longer at the visit than those who travelled less than 30 min (95% CI 1.916 to 18.52, P<0.05). Similarly, clients who travelled over an hour to get to the facility spent 16.6 more minutes at the visit than those clients who travelled less than 30 min (95% CI 4.754 to 28.54, P<0.01). Whether or not a client attended with a child or the client’s age were not statistically significant predictors of length of visit.
Regression model of MNCH–FP integration as predictor of length of time spent at facility
Discussion
Findings suggest the importance of targeted programmatic support for integration along each point on the continuum of care. Results show that FP integration tended to be most prominent in the MNCH service area(s) that received support for integration and for the most part was not in evidence within non-targeted facility service areas at the same levels. In Bondo, Kenya, where the MIYCN–FP intervention model emphasised integration across ANC, PNC and child health, high levels of FP integration were found across all three service delivery platforms (with the exception of Bondo Hospital, where integration lagged particularly in ANC). In sites where PPIUD interventions emphasised PPFP counselling during ANC (Bihar and Jharkhand, India; Embu, Kenya), levels of FP integration were higher in ANC than PNC or child health. In Embu, where PNC–FP integration also took place, PNC visits at health centres were too infrequent to analyse and the few PNC visits at the hospital showed no FP integration, possibly due to attrition in service integration over time. Sites with the largest lag between the programme intervention period and the client flow assessment (Embu) recorded the lowest levels of MNCH–FP integration, suggesting the need for better means of institutionalising and sustaining interventions. This is consistent with prior research by the Integra Initiative noting declines over time in facility integration scores.25
Strengths of the study included the large sample size and use of the client flow method providing detailed information on combination of services clients received. Compared with other measures of service delivery like quality of care/observation surveys and readiness assessments, this approach reflects a simpler, less labour-intensive way to document individuals’ receipt of integrated care. While client exit surveys could provide similar information, having the provider fill out the checklist may provide more accurate data by avoiding client recall or social acceptability bias.
One challenge was devising a one-page tool with a limited checklist of items that nonetheless captured multiple dimensions of MNCH and FP service integration across different settings. For future assessments, it would be useful to distinguish between ANC 1 and later ANC visits, since ANC 1 is less likely to include FP counselling. In addition, our client flow tool had categories of child health and nutrition services that may have been difficult for providers to interpret. For example, the form contained ‘iron/folate-child,’ but children typically receive only iron supplements if needed and not folate; it also lacked a check box for treatment of sick children. The tool could be modified to have clearer child health service categories.
Similar to limitations discussed by the Integra Initiative, a ‘snapshot’ of a 5-day period at a facility may not represent a ‘typical’ client flow, if a typical pattern exists.9 In Kenya, a polio campaign took place concurrently with data collection, resulting in staff disruption. Despite daily orientation by the study teams to mitigate changes in staff assignments, providers sometimes told clients they were too busy to complete the form and left sections blank. Data collection must strike a balance between collecting sufficient information and practicality of gathering data.
Overall, the extent to which integration occurs can be a result of how services are organised, the health system context and how well services inherently fit together. A review of interventions to improve PPFP in low/middle-income countries found evidence that integration of FP with other platforms like immunisation and PMTCT may increase PPFP knowledge and uptake.6 However, there remains a need for larger studies in low-resource settings on effective means of consistent and systematic PPFP implementation.18 Human resource constraints can affect delivery of integrated services, such as when providers from the service delivery areas being integrated are not available in the same facility at the same time.26 Evidence suggests the importance of repeated contact points; one review concluded that single, short FP counselling sessions during ANC are insufficient to increase uptake of PPFP, but FP integration across ANC and PNC can sizably increase uptake in the first year postpartum.5 Our study adds a more detailed snapshot of the combinations of services provided to pregnant and postpartum women and degree of service integration at the client level among facilities engaged in different models of PPFP interventions. Findings reinforce the importance of integrating FP counselling and services throughout the continuum of care and the continued need to increase PNC coverage in general.
From the client perspective, clients who accessed integrated MNCH–FP services spent an average of only 10 min longer at the health facility than those who accessed MNCH services alone. This contrasts with findings from the FP–HIV integration field that quantified a significant increase in waiting times of clients in integrated facilities versus comparison sites.27 Within a facility, MNCH–FP integration may not impose a greater time burden on clients. Additional research could explore underlying factors, such as whether this reflects achievement of efficiency in integrated service delivery; an unintended consequence with implications for quality of care in which multiple services are provided but in a cursory fashion; or other factors altogether. Findings suggest that attention should be given to the needs of clients living furthest away from a facility, as they seem least likely to receive integrated services. A multicountry study of child health and access to health facilities in low/middle-income countries found that lengthy travel distances are associated with decreased use of health services and poorer health outcomes.28 Our data indicate that differences in receipt of care may persist even after arrival at a facility. Whether this is due to provider perceptions that these clients do not have sufficient time to access integrated services or clients exhibiting concern about time limitations at the facility warrants further exploration.
Conclusion
This study offers further support for the use of a client flow tool to assess whether integrated services are being accessed as intended in service delivery settings. At many facilities, FP integration was highest in service delivery areas receiving specific programmatic support and lower in areas that did not receive attention, highlighting the importance of focused programmatic support specific to distinct service delivery areas. Our results suggest there is also a need to address how to better sustain integration once an intervention has ended. Findings provide cautious optimism that integration does not lead to greater waiting times for clients accessing integrated MNCH–FP services in these settings. Results point to the vulnerability of clients living furthest away who were least likely to access integrated services, reinforcing calls for emphasis on last-mile interventions. The client flow tool may hold promise as a component of baseline and endline assessments, studies for integration-focused programmes or as another tool for health facility assessments to examine consistency of service integration and characteristics of clients receiving integrated services.
Acknowledgments
The authors acknowledge the ministries of health in Kenya and India and the managers, providers and other staff at the various participating health facilities who assisted with the client flow assessments. We also thank the Indian Institute of Health Management Research as well as the research team in Kenya, including Angella Ogutu and Joygrace Muthoni, who facilitated data collection in each respective county. The Maternal and Child Survival Program, FP, nutrition, maternal health, newborn health and child health teams provided great insights into the adaptation of the client flow tool to capture services in these domains. We would also like to thank Vineet Srivastava, our colleague in India and Mark Kabue, our colleague in the USA, for support with data interpretation.
References
Footnotes
Contributors DM: Managed adaptation of the client flow tool, assisted with training of data collectors in Kenya, led the cleaning and analysis of client flow data and drafted the manuscript. AP: Principal investigator on the study and led study design and training of research teams, provided input on analysis and interpretation and assisted in drafting the manuscript. CM: Assisted with study design and training of data collectors in India, provided input on data interpretation and assisted in drafting the manuscript. CW: Managed set-up and data entry, cleaning and coding of data through the Research Electronic Data Capture (REDCap) system, assisted in drafting the manuscript. GS: Contributed to data cleaning, provided input on and conducted data analysis. AS: Conducted regression analyses of data and drafted text.
Funding This publication was made possible by the generous support of the American people through the US Agency for International Development (USAID), under the terms of the Leader with Associates Cooperative Agreement GHS-A-00-08-00002-00 and Cooperative Agreement AID-OAA-A-14-00028.
Disclaimer The contents are the responsibility of the Maternal and Child Health Integrated Program (MCHIP) and the Maternal and Child Survival Program (MCSP) and do not necessarily reflect the views of USAID or the US Government.
Competing interests None declared.
Patient consent Not required.
Ethics approval Johns Hopkins University; Indian Institute of Health Management Research; Kenya Medical Research Institute.
Provenance and peer review Not commissioned; externally peer reviewed.
Data sharing statement Extra data can be accessed via the Dryad data repository at http://datadryad.org/ with the doi: 10.5061/dryad.11313.
Author note We would like to note that GS who was affiliated with Jhpiego at the time of research is now affiliated with UNICEF in Chhattisgarh, India.