Article Text

Abstract
Objectives Excessive daytime sleepiness (EDS) is a common sleep complaint in the population and is increasingly recognised as deleterious for health. Simple and sensitive tools allowing identifying individuals at greater risk of EDS would be of public health importance. Hence, we determined trajectories of body silhouette from early childhood to adulthood and evaluated their association with EDS in adulthood.
Design A retrospective analysis in a prospective community-based study.
Participants 6820 men and women self-reported their silhouette at ages 8, 15, 25, 35 and 45 using the body silhouettes proposed by Stunkard et al. EDS was defined by an Epworth Sleepiness Scale score ≥11.
Main outcome measure Presence of EDS in adulthood.
Results The study population comprised 6820 participants (mean age 59.8 years, 61.1% men). Five distinct body silhouettes trajectories over the lifespan were identified: 31.9% ‘lean stable’, 11.1% ‘lean increase’, 16.1% ‘lean-marked increase’, 32.5% ‘moderate stable’ and 8.4% ‘heavy stable’. Subjects with a ‘heavy-stable’ trajectory (OR 1.24, 95% CI 0.94 to 1.62) and those with a ‘lean-marked increase’ trajectory (OR 1.46, 95% CI 1.18 to 1.81) were more likely to have EDS when compared with the ‘lean-stable’ group after adjusting for confounding. Further adjustment for birth weight strengthened the magnitude of the ORs.
Conclusion Increasing body silhouette and to a lesser extent constantly high body silhouette trajectory from childhood to adulthood are associated with increased likelihood of EDS, independently of major confounding variables.
Trial registration number NCT00741728; Pre-results.
- body silhouette
- obesity
- trajectory
- excessive daytime sleepiness
- sleep
This is an Open Access article distributed in accordance with the Creative Commons Attribution Non Commercial (CC BY-NC 4.0) license, which permits others to distribute, remix, adapt, build upon this work non-commercially, and license their derivative works on different terms, provided the original work is properly cited and the use is non-commercial. See: http://creativecommons.org/licenses/by-nc/4.0/
Statistics from Altmetric.com
Strengths and limitations of this study
Large sample size in a community-based study.
We used a new, lifetime approach to estimate the evolution of body shape and weight over the lifespan, bringing information beyond one single measure of adiposity (such as body mass index or waist circumference).
Retrospective recall of body silhouettes.
No objective measures of sleep disorders (polysomnography).
Introduction
Excessive daytime sleepiness (EDS) is highly common in the general population. Its prevalence has been reported up to 28%,1–4 and is expected to rise.5 EDS has been associated with an increased risk of occupational injuries,6 and in addition with a twofold increased risk of cardiovascular morbidity and up to 70% increased risk of mortality.7 However, the determinants of EDS remain to be firmly established to consider interventions that may help preventing EDS. Given the epidemic of obesity and overweight worldwide,8 establishing a relationship between anthropometric markers and EDS would carry major public health implications. Associations between waist circumference or body mass index (BMI) and EDS have been reported in some,9–12 but not all studies.13 14 One possible explanation for these discrepancies is that most previous studies were cross-sectional so that they focused on one single measure of these anthropometrics markers.9–11 BMI, as well as waist circumference, change over the lifespan so that correlating changes in body weight with future EDS might bring more accurate predictive information. Unfortunately, studies with repeated measurements of BMI or waist circumference and with information on EDS are scarce. So far, only two studies, including one conducted specifically in women, evaluated the association between changes in BMI across two measures over time and the occurrence of EDS.12 15 These two studies considered BMI measures in adulthood only but not during infancy and adolescence, which represent critical periods regarding weight gain and weight attained in adulthood.16 17
Self-reported body silhouette has been shown to be a simple and reliable marker of body shape and weight.18–21 Recall of body silhouette at different ages correlates with objective measures of BMI at the corresponding ages.18 19 Hence, by combining recall of body silhouettes at different ages, it is possible to construct body silhouette trajectories over the life course. Accordingly, some recent studies have related self-reported body silhouette trajectories over the lifespan with different health-related outcomes including mortality, type 2 diabetes or cancer.20–23
In this study, we used a trajectory approach to investigate potential relationship between the trajectory of body silhouette from early childhood to adulthood and EDS in adulthood. In particular, we hypothesised that it is more the dynamic than the starting point value of the body silhouette that brings predictive information for EDS in adulthood.
Material and methods
Study population
The design and main objectives of the Paris Prospective Study III have been published previously.24 It is an ongoing prospective observational cohort study in which 10 157 men and women aged 50–75 years were recruited between June 2008 and June 2012. The standard health check-up included a complete clinical examination, coupled with standard biological tests after an overnight fast. A self-administered questionnaire provided information related to professional activity, lifestyle, personal and family medical history, current health status, and use of medications. Our study complies with the Declaration of Helsinki. All procedures performed in this study involving human participants were in accordance with the ethical standards of the institutional research committee and with the Declaration of Helsinki 1964 and its later amendments or comparable ethical standards. All the volunteers were recruited after signing an informed consent form.
Sleep variables
Excessive daytime sleepiness
Participants filled the Epworth Sleepiness Scale (ESS), which is a self-administered questionnaire containing eight questions evaluating the probability of dozing during daily activities, each question being rated from 0 (would never doze) to 3 (high chance of dozing), so that the ESS score ranges from 0 to 24. In accordance with the literature, we considered an ESS score of 11 and above to define EDS in main analysis.1 25 An ESS score ≥16 was also considered to define severe EDS in sensitivity analysis (see end of "Statistical analyses" paragraph).
Sleep duration, snoring and sleep-related medications
Sleep pattern was obtained by questionnaire, such as usual sleeping and waking times. Information on the frequency (never, rarely, regularly or often) of loud snoring during night was obtained and we considered ‘regularly or often’ snorers versus others. Working schedules were recorded (day or night working). A medical doctor checked current medication during a face-to-face interview with the study participants. WHO Anatomical Therapeutic Chemical (ATC) classification was used to categorise medications; in particular, sleep-related medications (ie, that may impact on sleep) were identified by ATC code N05.
Proxy for sleep-disordered breathing
In the absence of objective sleep-disordered breathing (SDB) measures, we constructed a proxy for SDB. A participant was considered having a plausible SDB when he/she had loud snoring and a cluster of male sex and/or BMI >30 kg/m2and/or age 55 or older and/or hypertension.
Body silhouette assessment
We used body silhouettes adapted from those proposed by Stunkard et al.26 At study recruitment, participants were asked to recall and choose one body silhouette among seven proposed for ages 8, 15, 25, 35 and 45 years. Body silhouettes were presented using children and adult silhouettes (figure 1).
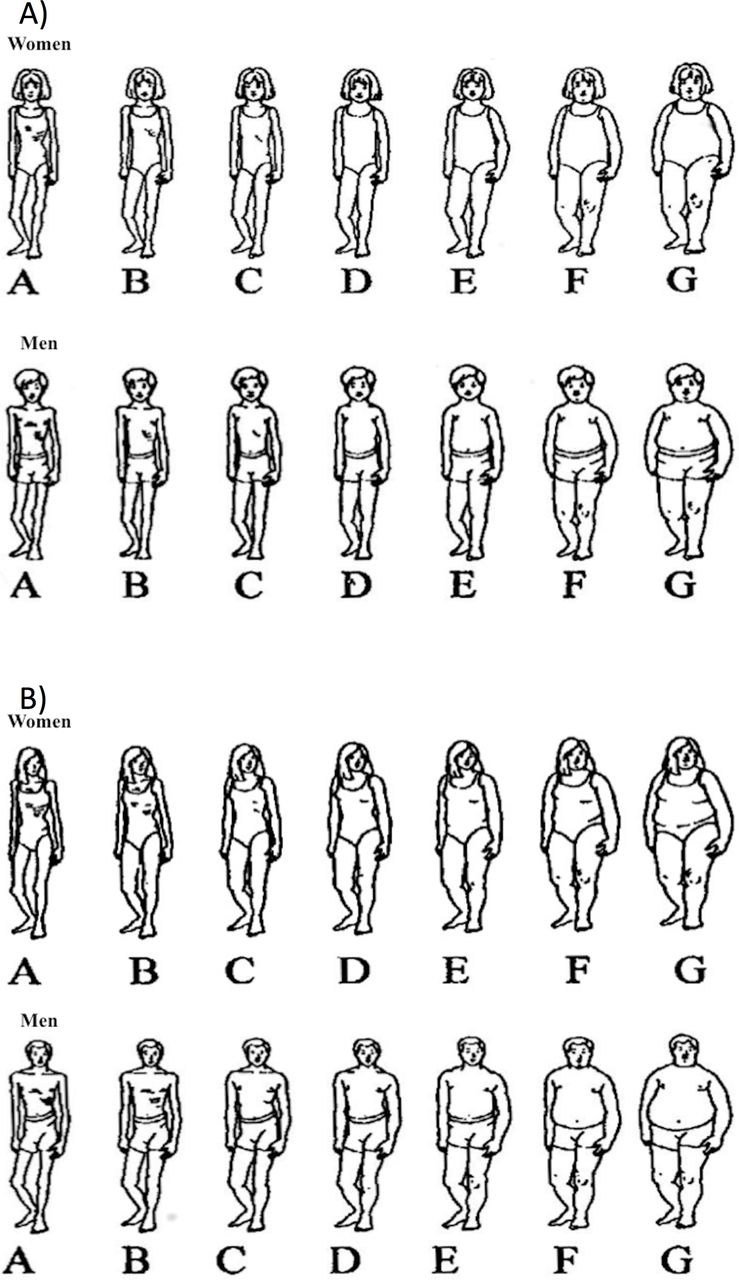
Body silhouettes in (A) children and (B) adults, adapted from Stunkard et al.26
Covariates
Depression score was assessed using the 13-item Questionnaire of Depression second version, Abridged (QD2A).27 Depressive status (yes/no) was defined by a QD2A score ≥7. Prevalent cardiovascular disease, including history of stroke, myocardial infarction or angina pectoris, was self-reported. Diabetes was defined either by the intake of diabetes therapy or a fasting blood glucose >7 mmol/L. Blood pressure was measured after 10 min of rest in a subject in decubitus. Hypertensive status was defined either by the intake of antihypertensive treatment or a systolic blood pressure ≥140 mm Hg or a diastolic blood pressure ≥90 mm Hg. Habitual physical activity was assessed using the Baecke’s score.28 A higher score corresponds to higher physical activity. Subjects were also asked to report if their birth weight was below 2.5 kg, between 2.5 and 4 kg or above 4 kg. Since collecting data about ethnicity is forbidden by law in France, ethnicity was assessed from the participant’s and the parents’ country of birth.29 We, therefore, considered Caucasian, African and non-Caucasian non-African.
Statistical analyses
To construct body silhouette trajectories, we selected subjects who reported their body silhouettes for at least three age periods among the five, including necessarily the earliest and the latest period. Since body silhouettes across the lifespan are longitudinal data, we used a group-based trajectory modelling implemented by SAS Proc Traj.30 We identified five body silhouette trajectories, based on the change in the Bayesian information criterion (figure 2). Then, we calculated the posterior probability for each participant to belong to each of the five trajectories and attributed the participant to a trajectory according to the highest probability. The average probabilities for each group were 86%, 89%, 79%, 89% and 91%, indicating a good allocation of subjects among trajectories. Analysis was initially performed by sex, but trajectories were almost identical between men and women, and there was no significant interaction between sex and group-based trajectories (p value for interaction=0.62). Similarly, there was no significant interaction between body silhouette trajectories and age at inclusion (p=0.83). Hence, body silhouettes trajectories were described without stratification by gender or age.

Trajectories of body silhouette. Note: percentages represent the proportion of the population according to each trajectory.
The reliability of the obtained trajectories was further tested using the kml package of R software. This method is based on an implementation of the k-means clustering algorithm adapted for longitudinal data.31 According to quality criteria (Calinski and Harabasz, Ray and Turi and Davies and Bouldin),31 the optimal number of trajectories was five. Using this approach, we found very similar body silhouette trajectories as the previous ones (online supplementary figure 1).
Supplemental material
Multivariable logistic regression modelling was then used to quantify the relationship between body silhouette trajectory and EDS, estimating OR and 95% CIs. To be more specific regarding the body silhouette trajectories assignment, we repeated the main analyses after considering only subjects with a posterior probability of belonging to one trajectory group ≥80%.
To investigate the robustness of the results, we conducted several sensitivity analyses. To account to the fact that BMI at study recruitment may partly influence the body silhouette trajectory, we adjusted the previous multivariable model on BMI at study recruitment, keeping in mind that overadjustment may be present. Furthermore, to test whether early life factors such as birthweight impact future body shape, we additionally adjusted our analysis for birthweight categories (missing in 851 participants), as exact birth weight was not available. To minimise residual confounding by SDB, we then adjusted the model on loud snoring and then on the presence of a plausible SDB (missing in 538 subjects). To account for missing covariates, we reran the main analysis after using multiple imputations by chained equation.32 Finally, to test for an association with the severity of EDS, we considered moderate EDS (ESS between 11 and 14) and severe EDS (ESS ≥16), and performed multinomial logistic regression.
All analyses were two sided and we considered a p<0.05 as statistically significant. Statistical analyses were performed with R V.3.1.3 (www.r-project.org) and SAS V.9.3.
Results
Study population
Body silhouette trajectory could be assessed in 7106 participants, of whom 6820 also had non-missing EDS. The study sample comprised 61.1% of men and the mean age was 59.8 years (SD 6.3 years). A total of 1154 participants (16.9%) had EDS, 16.4% in women and 17.0% in men, respectively. The rates of EDS decreased with age, being 19.3% before 60, 14% before 70% and 13.4% after 70 (p for trend <0.001).
Anthropometric markers at study recruitment and EDS
As shown in online supplementary table 1, in multivariable analysis, EDS was associated with obesity (OR 1.53, 95% CI 1.21 to 1.94), but not with overweight at study recruitment. Furthermore, in multivariable analysis, higher waist circumference was significantly associated with EDS (OR 1.01 per 1 cm increase, 95% CI 1.00 to 1.02). However, the association did not reach statistical significance when considering clinical cut-off values of >88 cm (35 inches) for women and >102 cm (40 inches) for men (OR 1.16, 95% CI 0.96 to 1.40).
Age-specific silhouettes and EDS
Table 1 summarises the associations between body silhouette at each age (8, 15, 25, 35 and 45 years) and EDS, after adjusting for sex and age at inclusion. Only early and extreme body silhouettes were associated with EDS. Accordingly, we found strong and significant associations between EDS and the heaviest silhouette at age 8 (OR 2.59, 95% CI 1.14 to 5.54). There was also a moderate association between EDS and very lean body silhouette at age 8 (OR 1.30, 95% CI 1.03 to 1.64).
Excessive daytime sleepiness (EDS) according to body silhouette in men and women at different age from childhood to adulthood
Body silhouette trajectories analysis
Main analyses
From group-based trajectory modelling, five different trajectories were identified (figure 2): 31.9% were classified as ‘lean stable’, 11.1% as ‘lean increase’, 16.1% as ‘lean-marked increase’, 32.5% as ‘moderate stable’ and 8.4% as ‘heavy stable’. Characteristics of participants according to body silhouette trajectories are presented in table 2. In particular, ‘lean-marked increased’ and ‘heavy-stable’ trajectories exhibited the highest rates of EDS, loud snoring, SDB (proxy) and depression. They also had the highest mean BMI values compared with the remaining trajectories. Noteworthy, the proportion of babies born above 4 kg increased across the five trajectories (p for trend <0.001).
characteristics of participants according to body silhouette trajectories
In multivariable logistic regression (table 3) and compared with the ‘lean-stable’ trajectory, two trajectories demonstrated an association with EDS: the ‘heavy-stable’ trajectory (OR 1.24, 95% CI 0.94 to 1.62) and the ‘lean-marked increase’ trajectory (OR 1.46, 95% CI 1.18 to 1.81). In these analyses, subjects with depressive symptoms and short time sleepers (<6 hours vs 6–8 hours) were two times more likely to have EDS whereas ageing was related to a 3% less likelihood of EDS per 1-year increase (table 3). When focusing on subjects with a posterior probability of belonging to a group trajectory ≥80%, associations with ‘heavy stable’ (OR 1.52, 95% CI 1.12 to 2.04) and ‘lean-marked increase’ trajectory (OR 1.77, 95% CI 1.34 to 2.32) were even higher (online supplementary table 2).
OR of body silhouettes trajectories for excessive daytime sleepiness
Sensitivity analyses
The results of the sensitivity analyses are reported on online supplementary table 3. Overall, ORs were consistent with those from the main analysis after successively adjusting for BMI categories, loud snoring and a proxy for SDB, and after performing multiple imputations of missing covariates. Further adjustment for birthweight categories strengthened the magnitude of the ORs. Of note, in these analyses, neither BMI (except BMI ≥30 kg/m2) nor birthweight categories were related to EDS, whereas loud snoring and SDB showed significant associations.
Of the 1154 participants with EDS, 953 had moderate EDS and 201 severe EDS. In multinomial logistic regression, the ‘lean-marked increase’ trajectory was associated with moderate EDS (OR 1.47, 95% CI 1.17 to 1.85) and to a lesser extent with severe EDS (OR 1.41, 95% CI 0.87 to 2.26). The ‘heavy-stable’ trajectory was associated with moderate EDS (OR 1.27, 95% CI 0.95 to 1.70) but not with severe EDS (OR 1.06, 95% CI 0.57 to 2.00).
Discussion
In this large community-based study, five body silhouette trajectories were identified using self-reported body silhouettes at different ages from childhood to adulthood. The trajectories were categorised as ‘lean stable’, ‘lean increase’, ‘lean-marked increase’, ‘moderate stable’ and ‘heavy stable’. Compared with subjects with a ‘lean-stable’ trajectory, those with a ‘lean-marked increase’ and ‘heavy-stable’ trajectories were the most likely to have EDS after accounting for several confounding factors.
In our study, separate analysis of body silhouette for each age indicates that extreme and early life body silhouettes were associated with EDS in adulthood. This was particularly true for the heavy body silhouette at 8 years of age, for which a 2.6-fold increased risk of EDS was observed. This may indicate that obesity during childhood is associated with sleep disorders in children,33 and plays a role in sleep disorders during adulthood. However, these figures should be interpreted with caution given the small size of this subgroup and the width of the 95% CI. On the other hand, this association is probably underestimated considering that the prevalence of obese children is currently growing and the fact that our population was born in the first part and in the middle of the 20th century.34
Data regarding the association of repeated assessment of adiposity with EDS are scarce. To date, only three studies have evaluated the association between changes in BMI and occurrence of EDS.12 15 In 1395 middle-aged subjects from the Penn State Adult cohort, an association was found between weight gain 7.5 years apart and incident and persistent EDS, whereas weight loss was associated with EDS remission.12 The second study by Theorell-Haglöw et al also reported an association between weight gain 10 years apart and EDS in 4322 women.15 Lastly, in 1468 adults men and women from the Sleep Heart Health Study, every 10 kg gain measured 5 years apart was associated with a 0.55 point increase in the ESS score for women, whereas no association was reported in men.35 In these three studies, however, change in BMI was based on two repeated measures only; also, the three studies were conducted in adults only, so that trends in adiposity during infancy and adolescence were not available. Taken together, the results of these three studies may not give the full spectrum of change in BMI over the lifespan. In addition, only one study used a standardised and validated questionnaire to define EDS,35 while another one was conducted selectively in women.15
To the best of our knowledge, this is the first study associating body silhouette trajectories from childhood to adulthood with future EDS in adulthood. Two body silhouette trajectories were associated with EDS in adulthood. Our results on the ‘lean-marked increase’ trajectory are consistent with previous studies reporting that children with a low birth weight and gaining weight rapidly until adolescence had a higher risk of medical conditions in adulthood, such as diabetes and coronary events.36 37 Hence, our study identified EDS as a novel detrimental consequence of such trajectory.The association of EDS with the ‘heavy-stable’ body silhouette trajectory, especially when investigating subjects with a posterior probability of belonging to one trajectory group ≥80%, suggests that both the magnitude and the duration of excess weight may play a role in the development of EDS. This is consistent with previous studies showing that duration of excess weight and obesity was related to the risk of metabolic complications.38 Furthermore, the ‘heavy-stable’ trajectory may identify obesity with a strong genetic component that often develops early in life.39 40
In our study, the associations between ‘lean-marked increase’ and ‘heavy-stable’ body silhouette trajectories and EDS might reflect associations with either the last body silhouette measured at age 45 or the BMI at study recruitment. However, no association was found between the adult body silhouettes and EDS. Similarly, BMI at study recruitment did not impact the association between ‘lean-marked increase’ and ‘heavy-stable’ body silhouette trajectories and EDS. This indicates that the body silhouette lifetime approach provides information on the likelihood of EDS in adulthood beyond the one given by the last body silhouette or BMI.
Furthermore, the extent to which our study results reflect the effect of body silhouette trajectory per se or the effect of confounding factors associated with a pattern of body silhouette trajectory is a challenging issue. Psychological factors should be considered in this context.2 13 However, despite the strong association between depressive symptoms and EDS, the relationship between body silhouette trajectory and EDS remained after adjusting for depressive symptoms. Also, the extent to which our study results reflect the effect of body silhouette trajectory on EDS or on related sleep disorders or sleep patterns that correlate with EDS deserve to be studied. In our study, associations between EDS and body silhouette trajectories were still present after adjustment for sleep duration and for a proxy for SDB, and despite the associations between EDS and these two sleep variables.
Clinical implications
Given the prevalence of EDS and its deleterious consequences on a wide spectrum of health-related outcomes, identifying modifiable determinants is of public health importance. Our study results suggest that body silhouette trajectory may bring information beyond BMI or waist circumference. Therefore, in addition to these two anthropometric measurements, body silhouette trajectories could be easily performed during an office-based consultation to identify subjects at increased risk of several medical conditions, including EDS. From our study results, it appears that such evaluation should start early in childhood. In addition to screening and intervening on depression, sleep duration and SDB, which have shown here and in other studies to be determinants of EDS, subjects constantly gaining weight may be proposed weight reduction programmes even in the absence of obesity.12
Study limitations
Despite the size of our study, the consideration of both men and women, and the use of a standardised tool to define subjective EDS, we acknowledge the following limitations. First, we relied on self-reported body silhouettes and not on objectively measured anthropometric markers. However, self-reported body silhouettes are well correlated with objective measures of BMI.18 19 Second, body silhouettes at different age periods were not evaluated prospectively but retrospectively at study recruitment when participants were adult. However, recall of body silhouette at different ages correlates well with objective BMI measurements at the corresponding ages.18 Third, the last body silhouette refers to age 45, while age at study entry ranged from 50 to 75. However, body silhouette trajectories were not influenced by age at study entry in our study. Fourth, the modelling of trajectories being cohort dependent, our results may not be appropriate in other populations. Nevertheless, the trajectories found in our study are very similar to trajectories obtained in other studies.20 23 Fifth, we had no objective polysomnographical records to estimate night sleep duration or the presence of a SDB, and instead used self-reported night sleep duration and a proxy for SDB.
In summary, in this community-based cohort, increasing and constantly high body silhouette trajectories from childhood to adulthood were associated with increased likelihood of EDS, independently of major confounding variables. This trajectory approach allowed us to identify new clusters of subjects at risk of EDS, independently of BMI, sleep duration and proxy for SDB.
References
Footnotes
Contributors QL conducted statistical analyses, drafted the manuscript and performed the literature search. MT conducted statistical analyses, performed quality control of the data and reviewed the manuscript. M-AC reviewed the manuscript and revised it for important intellectual content, in particular for the Introduction and Discussion sections. FT participated in study design, acquisition of the data, supervised the field activities and reviewed the manuscript. PB participated in study design, acquisition of the data and reviewed the manuscript. CG participated in study design, acquisition of the data and its implementation, alongside with quality control and reviewed the manuscript. JH-R reviewed the manuscript and revised it for important intellectual content, in particular for the Discussion section. MCP performed quality control of the data and reviewed the manuscript. BP participated in study design, acquisition of the data, supervised the field activities and reviewed the manuscript. PM-V reviewed the manuscript and revised it for important intellectual content, in particular for the Discussion section. XJ participated in study design and reviewed the manuscript. J-PE participated in study design, acquisition of the data, supervised the field activities, participated in quality control, revised the manuscript for major intellectual content and gave final approval to submit the manuscript.
Funding The PPS3 Study was supported by grants from the National Research Agency (ANR), the Research Foundation for Hypertension (RFHTA), the Research Institute in Public Health (IRESP) and the Region Ile de France (Domaine d’Intérêt Majeur).
Competing interests None declared.
Patient consent Obtained.
Ethics approval Ethics Committee of the Cochin Hospital (Paris, France).
Provenance and peer review Not commissioned; externally peer reviewed.
Data sharing statement No additional data are available.