Article Text

Abstract
Objective To determine whether adults with normoglycaemia, impaired fasting glucose (IFG) and diabetes differed according to the incidence, rate, length and primary reasons for hospital admission.
Design Retrospective cohort study.
Setting Barwon Statistical Division, Geelong, Australia.
Participants Cohort included 971 men and 924 women, aged 20+ years, participating in the Geelong Osteoporosis Study. Glycaemic status was assessed at cohort entry using fasting plasma glucose, use of antihyperglycaemic medication and/or self-report.
Primary and secondary outcome measures Primary outcome measure was any admission to the major tertiary public hospital in the study region over the follow-up period. Secondary outcome measures were admission rate and length (days).
Results Over a median follow-up of 7.4 years (IQR 5.3–9.6), participants with diabetes, compared with those with normoglycaemia, were two times as likely to be hospitalised (OR 2.07, 95% CI 1.42 to 3.02), had a higher admission rate (incidence rate ratio 1.61, 95% CI 1.17 to 2.23) and longer hospital stay (third quartile difference 7.7, 95% CI 1.3 to 14.1 and ninth decile difference 16.2, 95% CI 4.2 to 28.3). IFG group was similar to normoglycaemia for the incidence, rate and length of admission. Cardiovascular disease-related diagnoses were the most common primary reasons for hospitalisation across all glycaemic categories.
Conclusions Our results show increased incidence, rate and length of all-cause hospital admission in adults with diabetes as compared with normoglycaemia; however, we did not detect any associations for IFG. Interventions should focus on preventing IFG-to-diabetes progression and reducing cardiovascular risk in IFG and diabetes.
- diabetes mellitus
- hospitalisation
- impaired fasting glucose
- health service usage
This is an Open Access article distributed in accordance with the Creative Commons Attribution Non Commercial (CC BY-NC 4.0) license, which permits others to distribute, remix, adapt, build upon this work non-commercially, and license their derivative works on different terms, provided the original work is properly cited and the use is non-commercial. See: http://creativecommons.org/licenses/by-nc/4.0/
Statistics from Altmetric.com
Strengths and limitations of this study
Retrospective cohort design with long-term follow-up.
Randomly selected sample of general population, including both men and women.
Robust method of identification of normoglycaemia, impaired fasting glucose and diabetes mellitus.
To our knowledge, this is the first study to investigate the relationship between impaired fasting glucose and hospitalisation.
Hospital admissions data were limited to the sole tertiary public hospital in the study region.
Introduction
The rapid increase in the prevalence of diabetes mellitus poses a significant challenge for health planners globally. Diabetes causes deterioration in physical health, mental well-being and quality of life, resulting in adverse outcomes including increased risk of hospitalisation.1 2 According to the Australian Institute of Health and Welfare (AIHW), diabetes is one of the major causes of Potentially Preventable Hospitalisations in Australia, where hospitalisation may be avoidable through timely and adequate non-hospital care.3–5
It has been reported that people with diabetes have higher rates of hospitalisation as compared with those without the condition.6–9 Previous research, however, has mainly focused on individuals with a diagnosis of diabetes. The association of intermediate deteriorations in glucose metabolism such as impaired fasting glucose (IFG) and the risk of hospitalisation remains largely unexplored. IFG represents levels of fasting plasma glucose (FPG) that are above normal (100 mg/dL or 5.5 mmol/L) but below the diagnostic threshold for diabetes (126 mg/dL or 7.0 mmol/L).1 IFG is known to increase the risk of cardiovascular disease in addition to being a risk factor for diabetes.10 11 As evidence builds for IFG as a disease condition rather than just a risk factor for diabetes, investigating adverse outcomes including hospitalisations in this grouping is warranted. The aim of this study was to compare the incidence, rate and length of all-cause hospital admissions between adults with normoglycaemia, IFG and diabetes mellitus over a median period of 7.4 years. Moreover, we aimed to highlight primary reasons for hospital admissions for individuals in different glycaemic categories.
Methods
Study design and participants
We retrospectively analysed data from the Geelong Osteoporosis Study, a longitudinal cohort study including 3034 residents of the Barwon Statistical Division (BSD), located in Southeastern Australia, with a population of around 280 000. A detailed cohort profile, recruitment strategy and methodology have been described elsewhere.12 In brief, during 1993–1997, an age-stratified sample of 1494 women aged 20–94 years was recruited from the Commonwealth electoral rolls with an overall participation of 77.1%. Of the original sample, 881 women participated in the 10-year follow-up commencing 2004 and an additional 246 women aged 20–29 years were recruited in 2006–2008. Of these two groups, we included 924 women for whom glycaemic status could be confirmed based on FPG measurement, self-reported diabetes and/or use of antihyperglycaemic agents.
Similarly, during 2001–2006, 1540 men were recruited and assessed, followed by a 5-year reassessment commencing 2006. We used either baseline or 5-year follow-up as the point of cohort entry depending on when FPG was measured. The final sample for this analysis included 971 men for whom we were able to ascertain glycaemic status using FPG measurement, self-report and/or use of antihyperglycaemic agents. All participants provided informed consent.
Baseline measures
Cohort entry or ‘baseline’ was defined as the point when glycaemic status was confirmed and the follow-up was up to 31 December 2012 or date of death where applicable. At baseline, body weight and height were measured using electronic scales and a wall-mounted stadiometer, respectively. Venous blood was collected after an overnight fast and FPG was measured using an adaptation of the hexokinase-glucose-6-phosphate dehydrogenase method.13 Participants were categorised into normoglycaemia, IFG and diabetes according to the 2003 American Diabetes Association’s diagnostic criteria where diabetes was defined as FPG ≥7.0 mmol/L (126 mg/dL), self-report of diabetes or use of antihyperglycaemic agents. IFG was considered present if FPG level was between 5.5 and 6.9 mmol/L (100–125 mg/dL). Participants with a FPG level ≤5.5 mmol/L in the absence of self-reported diabetes or use of antihyperglycaemic agents were classified as having normoglycaemia.
A series of questionnaires was administered seeking information on sociodemographic characteristics, use of medications and supplements, physical activity, alcohol consumption, and cigarette smoking.12
Levels of physical activity were determined using a multiple choice question with responses ranging from ‘very active and active’ (aggregated as ‘high mobility’) to ‘sedentary, limited, inactive, chair/bedridden and bedfast’ (aggregated as ‘low mobility’). Frequency of alcohol consumption was measured using the Cancer Council Victoria Dietary Questionnaire for Epidemiological Studies.14 The Australian National Health and Medical Research Council guidelines were used to classify alcohol consumption into a binary variable; ‘low use’ (≤2 standard drinks/day) and ‘high use’ (>2 standard drinks/day), where a standard drink equals 10 g of alcohol.15 The Australian Bureau of Statistics Index of Relative Socioeconomic Advantage and Disadvantage was derived from the participants’ area of residence, as an indicator of socioeconomic status.16
Outcome measures
Our primary outcome measure was any hospital admission, planned or unplanned, to the University Hospital Geelong (UHG) during the follow-up period; women (median follow-up of 7.1 years, IQR 5.7–8.5) and men (median follow-up of 8.3 years, IQR 5.6–11.0). Secondary outcomes included admission rate based on the total number of hospital admissions over the follow-up period and length of admission in days, calculated from the admission and discharge dates, considering each admission as a separate occasion. Baseline data were linked to the admissions data using unique identification codes used by the hospital, referred to as Unit Record numbers.
The UHG is the largest public hospital and the sole health service in the study region classified as a ‘principal referral hospital’ according to the Australian hospitals peer-group classification.17 It has 370 inpatient beds, 24 intensive care unit beds and had the only 24 hours Emergency Department in the region during the study period. It provides a full spectrum of care, including community care, aged care, rehabilitation, mental health, emergency and acute care.18
Primary reasons for hospital admission
Australian hospitals use an alphanumeric coding system for diseases and external causes of injury, referred to as the 10th revision of the International Classification of Diseases, Australian Modification (ICD-10).19 It comprises three, four and five character categories, structured by body system and aetiology and is updated regularly.19 We classified primary diagnoses into broad categories by aggregating individual disease codes, for instance, primary ICD-10 diagnoses codes of I21.0 ‘acute transmural myocardial infarction (MI) of anterior wall’, I21.1 ‘acute transmural MI of inferior wall’ and I21.4 ‘acute subendocardial MI’ were combined as a single category of I21 ‘acute MI’.
Deaths
All deaths during the follow-up period were confirmed using the National Death Index, a national register maintained by the AIHW containing records of all deaths registered in Australia since 1980.20 To identify deaths, a combination of surname, first and second given names, address, date of birth and date of last contact with the study were used.
Potential confounders
The risk of hospital admission in diabetes is reported to vary by age,4 sex,4 9 unhealthy weight,21 cigarette smoking,22 physical inactivity22 and socioeconomic deprivation.23 In addition, high alcohol use may cause difficulties in management of diabetes, resulting in early onset of complications.23 Hence, we included these potential confounders in our analyses to investigate the relationship between glycaemic status and hospitalisation outcomes. Furthermore, due to previously reported differences in hospitalisation patterns between men and women with diabetes,4 9 we stratified our cohort by sex, in addition to reporting findings for the overall sample.
Statistical analysis
We used t-tests for continuous data and χ2 tests for categorical data to compare baseline characteristics of participants in different glycaemic categories (normoglycaemia, IFG and diabetes).
For the analysis of association between glycaemic status and the incidence of all-cause hospital admission, χ2 test followed by incidence difference (ie, risk difference) and 95% CIs have been reported for examining bivariate association (ie, the outcome and glycaemic status as exposure of interest). A set of trivariate analyses (ie, the outcome and glycaemic status as exposure of interest and one potential confounder) was performed to examine the impact of each potential risk factor above and beyond the glycaemic category association with the study outcomes. We used (1) trivariate logistic regressions for admission incidence, (2) trivariate Poisson regressions for admission rate and (3) two-way analyses of variance (ANOVAs) on rank of admission length. ORs, risk ratios and partial eta-squared effect size were used to illustrate the impact of potential risk factors, respectively. Partial eta-squared values of 0.009, 0.0588 and 0.1379 were considered as benchmarks for small, medium and large effect sizes, respectively.24 Multivariate logistic regression was performed to evaluate the association of admission incidence and glycaemic status after adjusting for potential confounders that were significant at 0.1 level in trivariate analyses and two-way interactions of confounders and glycaemic status; model-adjusted OR and 95% CI are reported. Admission rate was calculated as frequency of hospitalisation divided by total person-years of follow-up for normoglycaemia, IFG and diabetes groups. χ2 test followed by incidence rate ratio (IRR) and its 95% CI were illustrated for examining bivariate associations. Poisson regression with glycaemic status as factor and the frequency as the outcome and total person-years of follow-up as the offset was implemented for multivariate analysis. All potential confounders that were significant at 0.1 from the Poisson trivariate analyses were included in the primary multivariate Poisson regression model. Sensitivity of the Poisson models against any deviations from model assumptions, including zero inflation was examined by implementing negative binomial regression models.
Medians and IQRs of admission length were reported in the three groups. In order to deal with positively skewed nature of admission length and possible outliers, a non-parametric median-based regression based on L1-norm estimation25 26 was performed as multivariate model. Simultaneous quantile regression on median, third quartile and ninth decile using bootstrapping technique for estimating SEs27 was used to analyse the relationship between glycaemic status and upper quartile and last decile of admission length. Similarly, all potential confounders that were significant at 0.1 from the two-way ranked ANOVAs were included in the primary multivariate linear regression model. Backward variable selection approach with P-entry=0.1 and P-exit=0.05 was implemented to all multivariate models obtain the final models.
Statistical analyses were conducted using Stata software V.14 and Minitab statistical software package (V.17; Minitab, State College, Pennsylvania, USA).
Results
Table 1 shows baseline characteristics of participants by glycaemic status. In men, 615 (63.3%) had normoglycaemia, 275 (28.3%) had IFG and 81 (8.3%) had diabetes. In women, 694 (75.1%) had normoglycaemia, 159 (17.2%) had IFG and 71 (7.6%) had diabetes.
Descriptive statistics of men and women at baseline by glycaemic status (normoglycaemia, IFG and diabetes)
For both men and women, those with diabetes were older and had higher body mass index (BMI) as compared with normoglycaemia group. Women with diabetes were more likely to have ‘low mobility’ at baseline as compared with those with normoglycaemia. Participants with normoglycaemia, IFG and diabetes did not differ significantly at baseline in terms of current smoking status and socioeconomic status.
Incidence of all-cause hospital admission (admission incidence)
Bivariate analyses showed that men with IFG had 10% more admission incidence (risk difference 0.10, 95% CI 0.02 to 0.17, P=0.006) and men with diabetes had almost 40% more admission incidence (risk difference 0.28, 95% CI 0.17 to 0.39, P<0.001), compared with men with normoglycaemia.
Similarly, women with IFG and diabetes were also more likely to be admitted as compared with normoglycaemia (risk difference 0.10, 95% CI 0.01 to 0.18, P=0.024) and (risk difference 0.28, 95% CI 0.16 to 0.39, P<0.001), respectively.
After accounting for glycaemic category through trivariate analyses for both men and women in the study, older age and lower socioeconomic status were associated with increased admission incidence (table 2). In addition, a higher BMI in men and low mobility in women were associated with increased admission incidence after adjusting for glycaemic category (table 2).
Evaluating the impact of potential confounders at baseline on hospitalisation outcome association with glycaemic category using trivariate regressions (ie, one confounder at a time) between variables in men and women
A significant age–sex interaction was observed and, therefore, included in the multivariate models (OR 1.3, 95% CI 1.0 to 1.6, P=0.04). After adjustments for age, sex and socioeconomic status, participants with diabetes were twice likely to be hospitalised for any cause, as compared with normoglycaemia (OR 2.0, 95% CI 1.4 to 3.0, P<0.001). Having IFG at baseline was not significantly associated with admission incidence (OR 1.1, 95% CI 0.8 to 1.4, P=0.38).
Admission rate
Overall, 50.6% of the participants with diabetes were admitted more than once over the follow-up period, compared with 30.8% and 22.0% of those with IFG and normoglycaemia, respectively. In men, admission rate was 0.43 per person per year for those with diabetes (95% CI 0.32 to 0.57), 0.21 per person per year in IFG (95% CI 0.17 to 0.27) and 0.19 per person per year in those with normoglycaemia (95% CI 0.15 to 0.23). Admission rate was 0.50 per person per year for women with diabetes (95% CI 0.30 to 0.84), 0.24 per person per year for those with IFG (95% CI 0.18 to 0.31) and 0.16 per person per year in those with normoglycaemia (95% CI 0.14 to 0.19). In men, older age, BMI, high alcohol use, low mobility and low socioeconomic status were associated with higher admission rate (table 2). In women, older age, high alcohol use and low mobility were associated with higher admission rate (table 2).
In the final multivariate model, admission rate was significantly higher in the diabetes group, as compared with normoglycaemia (IRR 1.6, 95% CI 1.1 to 2.2, P<0.05). The IFG group was not significantly different from normoglycaemia in terms of admission rate (IRR 0.9, 95% CI 0.7 to 1.1, P=0.67).
Admission length (days)
The effect sizes of individual baseline characteristics on admission length based on two-way ranked ANOVA are illustrated in table 2. For men, older age, higher BMI and lower socioeconomic status were associated with increased admission length (table 2). Older age had a large effect on admission length, while high BMI and low socioeconomic status had medium and small effects, respectively (partial eta squared=0.160, 0.011 and 0.007) (table 2).
Median regression analysis did not show a difference between the glycaemic categories in terms of median admission length (table 3). In additional analysis, third quartile and ninth decile comparison was performed showing that having diabetes at baseline was associated with an increased admission length (third quartile difference 7.7, 95% CI 1.3 to 14.1, P=0.01) and (ninth decile difference 16.2, 95% CI 4.2 to 28.3, P=0.008) in patients with longer than median admission length. Hence, in participants who spent longer than the median admission length in the hospital, having diabetes was associated with longer hospital stay.
Relationship between glycaemic status and all-cause hospital admission (multivariate model), presented for men, women and total sample
Primary reasons for hospital admission
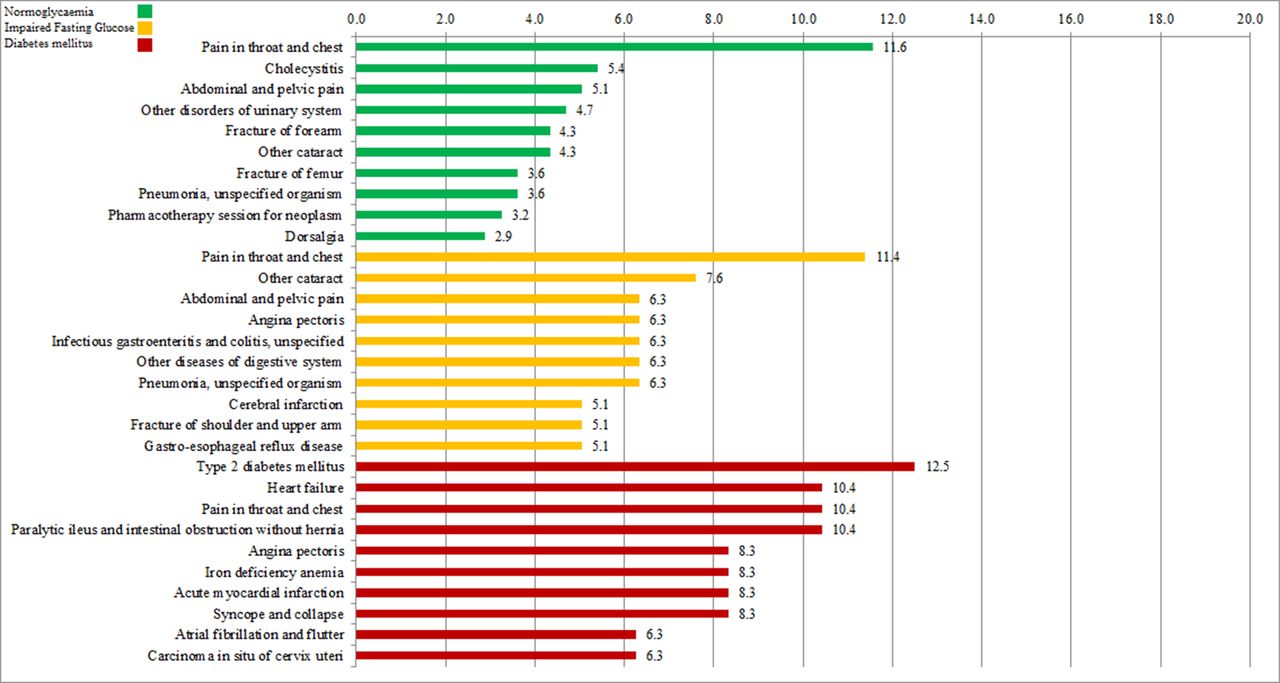
Figures 1 and 2 show the 10 most common primary reasons for hospitalisation by glycaemic category for men and women in the study, respectively.

Primary reasons for hospital admission by glycaemic category (percentage of men).
Primary reasons for hospital admission by glycaemic category (percentage of women).
Among men with diabetes, the most commonly encountered diagnosis was ‘angina pectoris’, with 20.0% of the group having at least one hospitalisation primarily for the condition. It was followed by ‘type 2 diabetes mellitus’ (14.5%). ‘Pain in throat and chest’ was the most common reason for hospitalisation for men in the IFG (14.6%) and normoglycaemia (9.8%) groups.
In women with diabetes, ‘type 2 diabetes mellitus’ was the most commonly documented primary reason for hospitalisation (12.5%), followed by ‘heart failure’ (10.4%). For the IFG and normoglycaemia groups, ‘pain in throat and chest’ was the most common reason for hospitalisation, 11.4% and 11.6%, respectively.
Discussion
This study reports that, compared with normoglycaemia, having diabetes is associated with a higher incidence, rate and length of hospital admission. During the follow-up, 68.0% of participants with diabetes had at least one hospital admission as compared with 50.0% with IFG and 40.0% with normoglycaemia. The incidence of hospital admission was two times in those with diabetes as compared with normoglycaemia. Previous studies reporting admission incidence have varied depending on the study population and duration of follow-up. Only one study in the literature has examined hospitalisations in the Australian population with diabetes.28 The study followed individuals aged 45 years and over, with and without diabetes, for a year, reporting that 32.8% of participants with diabetes had one or more hospitalisations as compared with 24.2% of those with normoglycaemia.28 Similar studies have been performed in other countries, for example, a New Zealand study conducted over a 3-year period reported an all-cause hospitalisation rate of 43.5% in those with diabetes.29 An Italian study showed an even higher proportion of participants with diabetes (55.0%) being hospitalised at least once over a 4.5-year follow-up.7
There are a number of factors which could explain the higher risk of hospitalisation in people with diabetes. Comorbid coronary heart disease, stroke, depression, musculoskeletal disease and cancer are common in people with diabetes and can increase the risk of hospitalisation.30 31 In addition, diabetes shares common risk factors with other chronic diseases (particularly cardiovascular disease) such as obesity, physical inactivity and unhealthy diet. In our study, half of the 10 most common primary reasons for hospitalisation in participants with diabetes were related to complications and/or diagnoses related to cardiovascular disease. This is consistent with studies showing that a significant proportion of morbidity and mortality associated with diabetes is due to cardiovascular disease.10 Some recent studies have reported a decline in incident cardiovascular disease in people with diabetes; however, the risk is still double that of those with normoglycaemia.32
In our sample, older age was independently associated with both having diabetes and the risk of hospitalisation. Elderly patients with diabetes often present with multiple and advanced complications and are more likely to be readmitted and spend longer in hospital beds as compared with younger counterparts.33
Other factors predisposing people with diabetes to hospitalisation are related to disease management that involves maintaining a balance between lowering blood glucose levels and preventing hypoglycaemic events. One of the goals of management is achieving tight glycaemic control (FPG <6 mmol/L), while this has been shown to reduce microvascular complications, it may simultaneously increase the incidence of hypoglycaemic events.6 Therefore, the benefits of obtaining optimum blood glucose levels have to be weighed against the risk of severe hypoglycaemic episodes that could result in frequent Emergency Department visits and hospital admissions.34 Furthermore, optimal diabetes care requires active involvement by the patients and their ability to navigate the health system, hence, health literacy plays a key role. Health outcomes are poorer in population subgroups with diabetes having low health literacy levels such as migrants from non-English-speaking backgrounds and indigenous people.35 36
In our study, 14.5% of men and 12.5% of women with diabetes had a hospitalisation specifically for a diagnosis or complication related to diabetes mellitus. Other studies have reported higher proportions of diabetes-related hospitalisations in the group with diabetes ranging from 18.8% to 33.0% per year.6 9 28 29 This could be explained by the fact that our sample was derived from general population which may be healthier than clinical samples used in other studies. It might also be a ‘healthy participant bias’ where individuals with less severe disease agree to participate in research resulting in an underestimation of the outcome. It could also have resulted from not being able to capture admissions to private hospitals and smaller hospitals in the study region. Furthermore, definitions of diabetes-related hospitalisations are inconsistent between countries and thus, comparisons need to be made cautiously. In Australia, diabetes coding standards have changed significantly over the last decade making it problematic to compare diabetes-related hospitalisation rates over time.4 Nonetheless, our results highlight an opportunity to devise interventions aimed specifically at reducing or delaying complications in those with diabetes. Previous evidence suggests that microvascular complications can be reduced by up to 50%–60% and macrovascular complications by 40%–45% with improved outpatient management.9 The Diabetes Control and Complications Trial demonstrated that intensive diabetes treatment delayed the onset of complications in adolescents and young adults with type 1 diabetes mellitus.34 The trial concluded that intensive therapy aimed at achieving non-diabetic glucose levels slowed the progression of diabetic retinopathy, nephropathy and neuropathy.34 Similarly, the United Kingdom Prospective Diabetes Study showed a substantial decrease in microvascular complications of type 2 diabetes through intensive blood glucose control37 and Steno study showed reduced rates of cardiovascular-related mortality with multifactorial intervention.38
We did not detect an association between IFG and the incidence, rate and length of hospital admission. To our knowledge, this is the first study to investigate the relationship between IFG and hospitalisation, thus, comparable data are not available. Studies have reported a moderate increase in the risk of cardiovascular disease in the ‘prediabetes’ group as compared with normoglycaemia, which increases significantly once diabetes develops.39 Current rates of IFG-to-diabetes progression are alarmingly high, with studies reporting development of diabetes in up to two-thirds of individuals with prediabetes.39 The authors of this study have previously reported that approximately one-third of Australian women have IFG, with a sixfold higher risk of progressing to diabetes over a decade if FPG ≥6.1 mmol/L.11 The greatest reductions in the occurrence of diabetes have been achieved through intensive lifestyle interventions for weight loss (5%–10% of body weight), dietary modification and physical activity (~30 min/day).39 Pharmacological therapy such as metformin has also shown some promise, particularly in the younger and obese individuals.40 Our findings show that the incidence of hospital admission multiplies as IFG progresses to diabetes, which if used effectively in public health campaigns, could help reduce progression in the population.
This study has a number of distinct advantages over previous studies that have explored the relationship between diabetes and hospital admissions. Our sample comprised randomly selected community-dwelling adults living in a well-defined area. Previous studies have used self-report,28 hospital admissions data,9 29 41 general practice registers6 42 or data from diabetes clinics7 to identify individuals with diabetes. We used a more robust method for identifying diabetes using a combination of FPG measurement, self-report and/or use of antihyperglycaemic medication. Through this approach, we were able to identify individuals with dysglycaemia, even in the absence of fully developed diabetes. Furthermore, we followed participants for hospital admissions over a longer period as compared with previous studies.28 29 Finally, we used unique identifiers to capture hospital admissions and mortality data, hence, we were able to obtain this information even if we lost contact with participants over the study period. Our study has some limitations. First, we obtained linked hospital admissions data from one major public hospital in the study region. It is possible that some of our participants were admitted to a private hospital or a smaller hospital. We consider this unlikely as UHG is the only major tertiary hospital in the study area and our sample was derived from a region in the immediate vicinity of the hospital. Second, although our study region (BSD) is considered to have a stable population, it is still possible that some of the participants might have moved intercity or interstate during the follow-up period. Furthermore, the results from our study, which included mainly Caucasian individuals, may not be generalisable to other populations. Finally, we did not differentiate between the types of diabetes at baseline and are, therefore, unable to comment on the proportion of different types of diabetes in our sample.
Conclusion
Our study confirms existing evidence showing higher incidence, rate and length of hospital admissions in individuals with diabetes mellitus. Further research should focus on identifying individual risk factors for hospitalisation in dysglycaemia. Strategies to reduce the need for hospitalisation should include preventing the disease itself (primary prevention), early diagnosis and treatment (secondary prevention) and preventing complications (tertiary prevention). Finally, adverse outcomes related with diabetes including hospital admissions could be reduced by preventing the progression from IFG to diabetes. We recommend screening for IFG in the population combined with targeted interventions to prevent diabetes in high-risk individuals.
Acknowledgments
We are grateful to Ross Arblaster (University Hospital Geelong) for providing the hospital admissions data and the Australian Institute for Health and Welfare for the mortality data.
References
Footnotes
Contributors MAS and JAP conceived the study. MAS drafted the manuscript. MM performed the data analysis. MAS, KLH, LLFdA, MM, MAK, DP and JAP critically appraised the manuscript and approved the final draft.
Funding The Geelong Osteoporosis Study is supported by the Victorian Health Promotion Foundation, National Health and Medical Research Council (NHMRC) Australia (projects 251638, 628582) and the Geelong Regional Medical Foundation. MAS is supported by an IMPACT Strategic Research Centre (Deakin University, Australia) stipend, KLH is supported by an Alfred Deakin Postdoctoral Research Fellowship and LLFdA is supported by a Deakin University Postgraduate Award.
Competing interests None declared.
Patient consent Detail has been removed from this case description/these case descriptions to ensure anonymity. The editors and reviewers have seen the detailed information available and are satisfied that the information backs up the case the authors are making.
Ethics approval The study was approved by the Barwon Health Human Research Ethics Committee.
Provenance and peer review Not commissioned; externally peer reviewed.
Data sharing statement Data are available on request.