Article Text

Abstract
Objective To assess trends in 30-day emergency readmission rates across England over one decade.
Design Retrospective study design.
Setting 150 non-specialist hospital trusts in England.
Participants 23 069 134 patients above 18 years of age who were readmitted following an initial admission (n=62 584 297) between April 2006 and February 2016.
Primary and secondary outcomes We examined emergency admissions that occurred within 30 days of discharge from hospital (‘emergency readmissions’) as a measure of healthcare quality. Presented are overall readmission rates, and disaggregated by the nature of the indexed admission, including whether it was elective or emergency, and by clinical health condition recorded. All rates were risk-adjusted for patient age, gender, ethnicity, socioeconomic status, comorbidities and length of stay.
Results The average risk-adjusted, 30-day readmission rate increased from 6.56% in 2006/2007 to 6.76% (P<0.01) in 2012/2013, followed by a small decrease to 6.64% (P<0.01) in 2015/2016. Emergency readmissions for patients discharged following elective procedures decreased by 0.13% (P<0.05), whereas those following emergency admission increased by 1.27% (P<0.001). Readmission rates for hip or knee replacements decreased (−1.29%; P<0.001); for acute myocardial infarction (−0.04%; P<0.49), stroke (+0.62%; P<0.05), chronic obstructive pulmonary disease (+0.41%; P<0.05) and heart failure (+0.15%; P<0.05) remained stable; and for pneumonia (+2.72%; P<0.001), diabetes (+7.09%; P<0.001), cholecystectomy (+1.86%; P<0.001) and hysterectomy (+2.54%; P<0.001) increased.
Conclusions Overall, emergency readmission rates in England remained relatively stable across the observation period, with trends of slight increases contained post 2012/2013. However, there were large variations in trends across clinical areas, with some experiencing marked increases in readmission rates. This highlights the need to better understand variations in outcomes across clinical subgroups to allow for targeted interventions that will ensure highest standards of care provided for all patients.
- quality of care
- readmission rates
- variation in quality of care
This is an Open Access article distributed in accordance with the Creative Commons Attribution Non Commercial (CC BY-NC 4.0) license, which permits others to distribute, remix, adapt, build upon this work non-commercially, and license their derivative works on different terms, provided the original work is properly cited and the use is non-commercial. See: http://creativecommons.org/licenses/by-nc/4.0/
Statistics from Altmetric.com
Strengths and limitations of this study
The use of a large administrative health data source allowed capturing all patients entering the English National Health Service between 2006 and 2016.
This study extended the scope of the previous literature, by examining changes in readmission trends and variation for all patients, and for nine clinical subgroups.
Our analysis employed the systematic component of variation, which provides an estimation of the unobservable part of the variation that is due to hospital characteristics.
The risk-adjusted, 30-day readmission rate and the systematic component of variation assume that all patient-level predictors of a readmission are controlled for by the information entered into the logistic regression model.
There may be other dimensions of quality of care that we were not able to measure through readmission rates.
Introduction
Ensuring that patients receive appropriate and high-quality care in hospitals followed by an efficient discharge in a way that leads to the best possible outcomes is a priority for the English National Health Service (NHS).1 Despite this objective, care received by patients remains variable in quality across England,2 and while some of this variation may be explained by differences in patients’ complexity and medical needs,3 some variation may be unwarranted by the characteristics of patients and point to opportunities to improve care.4 It is a key priority of the NHS to close this ‘quality gap’, which was outlined in the NHS Five Year Forward View5 and addressed through initiatives such as the Right Care Programme6 and Getting it Right First Time.7
Emergency hospital readmission rates are widely used for measuring health system performance.8–10 They have important and well-known limitations,11 which include the difficulty in distinguishing readmissions avoidable through actions of healthcare providers from those caused by other factors such as the patient complexity, a sensitivity to omitted variable bias in risk-adjustment models, imperfect information about how they relate to other outcome measures of quality (ie, mortality rates or length of stay), and their link to factors outside the control of hospitals (eg, primary care or social isolation). Nevertheless, there is now mounting evidence that they are correlated with quality of care provided to patients along the clinical pathway. This includes quality of care at the initial hospital stay,12 transitional care services13–15 and postdischarge support.16 17 Emergency readmission rates were incorporated into quality frameworks across several healthcare systems (eg, USA, Denmark, Germany and England),18 with numerous national-level policies aimed at reducing readmissions in an attempt to improve quality of care. For example, in England, the government white paper Equity and Excellence: Liberating the English NHS 19 led to the implementation of policies directly aiming at reducing readmission rates, including via financial penalties for hospitals reporting excess emergency readmissions.
Previous research on readmissions analysed trends at the national level by aggregating across all hospitals.20 While national readmission trends can indicate whether progress was made overall in the healthcare systems, an aggregate analysis masks differences in the rate of progress for specific hospitals and patient groups. Analyses in the aggregate offer little value for the identification of providers and clinical areas that require specific policy attention, and works counter the ambition to provide high-quality healthcare for all patients no matter what hospitals they attend. Therefore, in addition to investigating national trends in readmissions, examining variation between providers and for different patient groups helps to uncover additional dimensions in care quality, which can direct policy makers in implementing future improvement efforts in a more targeted fashion. To measure variation in readmission rates across hospitals, we used the systematic component of variation (SCV).21 This is a commonly applied measure of variation in health system performance.22–24 To measure variation in readmission rates across clinical areas, we undertook separate analyses of nine patient groups with specific conditions and procedures. We used a large dataset consisting of the medical records of all patients admitted to the population of English hospitals over 10 years. This study provides one of the most comprehensive assessments of trends in readmission rates in England.
Methods
Study population
Our analysis included a total of 23 069 134 patients between April 2006 and February 2016 to 150 non-specialist NHS trusts. Trusts are healthcare providers that typically manage multiple hospital sites. We obtained pseudonomised and unidentifiable patient healthcare records from the administrative Hospital Episode Statistics (HES) database. HES contains information on patient demographics, diagnoses and treatment. For each patient, we constructed linked health records from the patients’ admission to discharge, even when patients changed hospital as part of the hospital stay.25 26 We studied all adult patients discharged from a non-specialist NHS trust between 1 April 2006 and 29 February 2016, following any elective (ie, planned) or emergency (ie, unplanned) indexed (ie, original or first) admission. This included patients admitted with an indexed admission as a day-case to account for health system trends that shifted care from an inpatient to an outpatient setting during the 10 years.27Patients discharged in March 2016 were removed from the study sample to allow for a sufficient follow-up period required to calculate 30-day readmission rates within the scope of available data. We also excluded the following elective and emergency admissions from the study sample (total exclusions: 56 401 750 out of 140 709 025 admissions): below 18 years of age (n=17 860 079), without complete records of variables required for risk adjustment (n=11 173 561), maternity cases (n=12 085 711) and any admission related to cancer or chemotherapy (n=13 985 696). We also excluded any indexed admission that was not survived by the patient (n=1 296 703), because they could not result in a readmission. Where a patient experienced multiple admissions, we treated each admission as an indexed admission provided they occurred more than 30 days from each other.
We followed the definition used by policy makers in England for identifying emergency readmissions from administrative health records,28 which are described as any all-cause, emergency admission with a method of admission via Accident and Emergency department (A&E); general practitioner; bed bureau; consultant outpatient clinic; other means, such as arriving via A&E of another provider where the patient had not been admitted, and occurring within 30 days of discharge from an indexed admission. We focused on a period of 30 days following discharge from any indexed admission as this reflects common practice when assessing care quality, and we only counted the first emergency readmission for patients experiencing multiple emergency readmissions within the 30-day period. Emergency readmissions may have comprised of readmissions for conditions unrelated to the indexed admission.
We first calculated yearly national readmission rates by averaging across hospital-specific readmission rates. We then examined yearly trends in readmissions for patients with nine specific conditions, following the hypothesis that the patients’ experience with the healthcare system is likely to differ with health condition. For example, long-term conditions are usually managed in primary care settings,29 while acute conditions require hospital admissions and rehabilitative care. We used the HES-recorded primary diagnoses codes (International Classification of Diseases 10th edition or ICD-10) and procedure codes (Classification of Intervention and Procedure Codes or OPCS-4) to identify patients for subgroup analyses. The selection of acute conditions and chronic conditions was based on publicly available statistics on health service utilisation based on primary diagnosis in 2015/2016,30 and as a result we included acute myocardial infarction, stroke and pneumonia as acute conditions; we chose congestive heart failure, chronic obstructive pulmonary disease (COPD) and diabetes mellitus as long-term conditions. For surgical interventions, we focused on commonly performed surgeries in the English NHS, which also capture several surgical subsections.31 Thus, we selected cholecystectomy, total hip and knee replacement, and hysterectomy. The full list of applied ICD-10 codes and OPCS-4 codes is presented in the online supplementary appendix A .
Supplementary file 1
Statistical analysis
We first estimated the average observed emergency readmission rate (OR) for each trust and financial year by aggregating from the patient level. We adjusted for systematic differences in patient complexity across trusts based on clinical conditions recorded in each patients’ record. We then estimated the predicted emergency readmission rates (ER) for each trust and financial year by performing a logistic regression at the patient level. We used patient case-mix information, including patient age on admission, gender, ethnicity, socioeconomic deprivation score (Index of Multiple Deprivation version 2010 based on small geographic areas, each containing on average 1500 residents),32 comorbidities measured by the Charlson Index33 and length of stay. This Charlson Index was constructed based on diagnoses codes recorded at the indexed admission and during previous admissions that occurred within 1 year. Because the Charlson Index may be affected by changes in how health conditions are recorded in HES,34 we entered interaction terms between the Charlson Index and financial year into our logistic regression model. Length of stay was entered into the risk-adjustment process, as every extra day spent in hospital was found to be associated with an increased risk of incurring an adverse health event,35 possibly affecting the patients’ likelihood of recovery, but it might also indicate disease severity in the absence of any other adequate measures recorded within the HES database. However, because length of stay is also used as a measure of quality,36 it is possible that adjusting for it might remove some of the variation in readmission rates. To calculate the risk-adjusted, 30-day emergency readmission rate for each trust and financial year, we divided OR by ER to assess whether the trust performed below or above what would be expected given patient case-mix. We then multiplied this ratio for each trust and financial year by the average emergency readmission rate observed at the national level in that financial year.
The amount of trust-level variation in 30-day, emergency readmission rates in England for each financial year was calculated with the SCV methodology developed by McPherson et al21 (see online supplementary appendix B). The SCV can be described as the variance of the ratios of OR and ER minus the random component caused by Poisson variability37 times 100. Since hospital readmissions are relatively rare events, we assumed that ER approximates a Poisson distribution. This provided us with one SCV measure for each financial year, and each category of readmission. The SCV measures the degree of variation caused by time-invariant unobservable characteristics related to the hospitals or the populations in their catchment area that are leading some hospitals to diverge from the average national emergency readmission rate. A high SCV means that hospitals in that year have very different readmission rates due to unobservable characteristics that we cannot explain by the information entered into the prediction model. These unobservable characteristics make a hospital perform above or below the national average in terms of readmissions. Unobservable hospital characteristics could be good or bad management practices, staff satisfaction, whereas unobservable population characteristics could be socioeconomic factors that affect medical need, but are not captured by the socioeconomic deprivation score in HES.26 The estimated SCV score can be categorised into three distinct groups. An SCV score below 3 indicates small variation in emergency readmission rates; a score between 5.4 and 10.0 indicates high variation in emergency readmission rates; and a score above 10.0 indicates very high variation in emergency readmission rates.22 38 39 Other studies have suggested a value above 16 to indicate high variability,40 while one study that investigated variation in access to health services commissioned by the National Specialised Commissioning Team in England suggested high variability above a cut-off point of 20.41
Supplementary file 2
To test whether trends in risk-adjusted, 30-day emergency readmission rates changed across financial years, we estimated a regression model with ordinary least squares estimators. We used the risk-adjusted, 30-day emergency readmission rate as dependent variable, and entered time dummies for each financial year, omitting financial year 2006/2007 as the baseline case. The direction of the coefficient estimates showed whether the readmission rate in a respective financial year is significantly different from the values observed in financial year 2006/2007.
We conducted sensitivity analyses using alternative time windows for emergency readmissions within 7 and 90 days. In addition to the SCV, we also report the SD as an alternative measure of variation. We used SAS Enterprise Miner for initial data extraction, and the statistical analysis was conducted using STATA V.13.
Results
Study sample
Our analysis included a total of 62 584 297 (n=23 069 134 patients) indexed admissions (corresponding to 43 551 indexed admissions per trust per year, with a range from 1195 to 121 500), suggesting that several patients experienced multiple indexed admissions across the observation period. The characteristics of all patients admitted to hospital changed slightly between 2006/2007 and 2015/2016 (see table 1). For example, the average patient age increased across the study period, from 57.4 years in 2006/207 to 59.5 years in 2015/2016 (P<0.001). Similarly, the average number of comorbidities measured by the Charlson Index increased from 0.23 in 2006/2007 to 0.45 in 2015/2016 (P<0.001). However, this increase may reflect improvements in coding practice over time, rather than a real increase in medical complexity of patients. Patients remained in hospital for a shorter period, with the average length of stay decreasing from 3.16 days in 2006/2007 to 2.25 days in 2015/2016 (P<0.001).
Summary statistics of all patients in the study sample by financial year (FY)
Trends and variation in national emergency readmission rates for all NHS patients
The total number of indexed admissions per year increased by 1 014 890 from 5 204 263 in 2006/2007 to 6 219 153 in 2015/2016 (P<0.001). A total of 338 565 discharges following an indexed admission resulted in an emergency readmission in 2006/2007, whereas a total of 418 949 discharges following an indexed admission resulted in an emergency readmission in 2015/2016 (P<0.001) (see table 1). The observed crude emergency readmission remained stable across the study period, increasing slightly from 6.50% in 2006/2007 to 6.75% in 2012/2013 (P<0.001), and then remaining constant until 2015/2016 (P<0.001). The SD of crude readmissions was also constant from 0.95% in 2006/2007 to 0.93% in 2015/2016 (P<0.30). The risk-adjusted, 30-day emergency readmission rates increased slightly from 6.56% in 2006/07 to 6.76% in 2012/2013 (P<0.01), followed by a small decrease to 6.64% in 2015/2016 (P<0.01) (see figure 1). While percentage changes in risk-adjusted, 30-day emergency readmission rates appear insubstantial, when calculating the total number of patients readmitted per year from the number of indexed admissions per year, the small decrease in readmissions between 2012/2013 and 2015/2016 translated into approximately 7000 fewer readmissions per year.
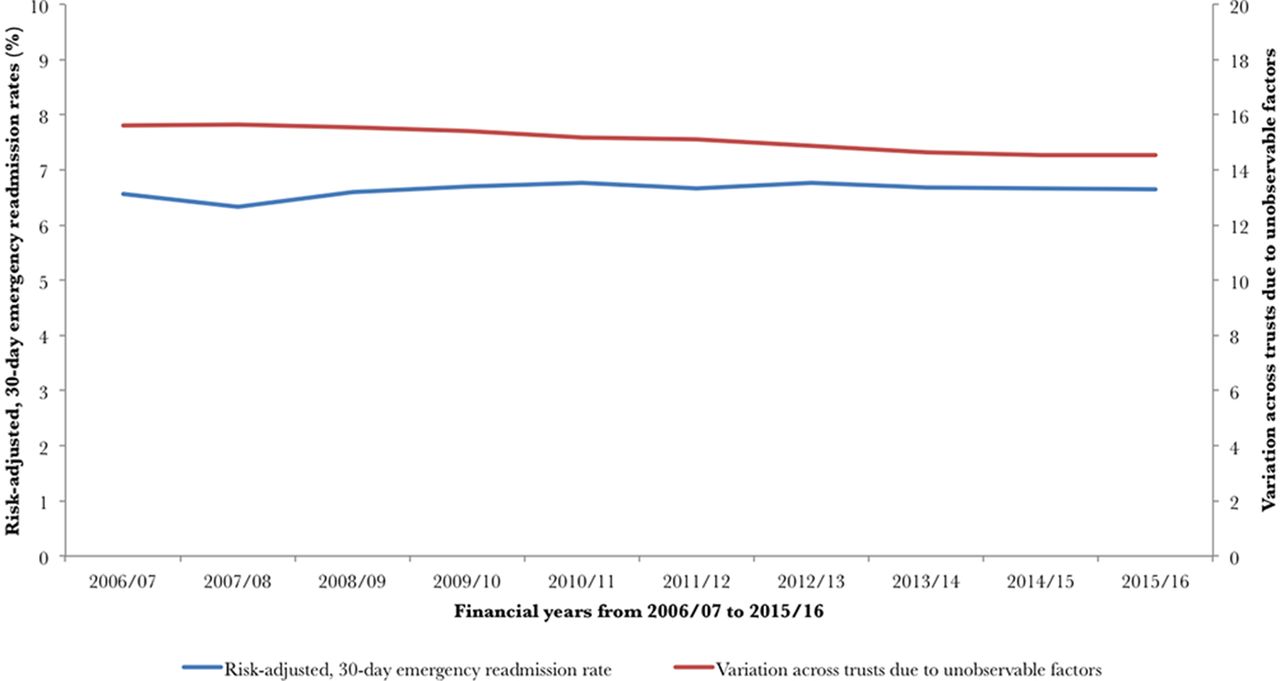
Trends in risk-adjusted, 30-day emergency readmission rates and variation in England from 2006/2007 to 2015/2016.
The average SCV for readmissions following any indexed admission and across the entire observation period was 15.11, and we observed a decrease in the SCV score from 15.60 in 2006/2007 to 14.54 in 2015/2016 (P<0.001) (see figure 1). This means that although readmission rates were higher in 2015/2016 compared with 2006/2007, the variation across providers reduced significantly. This is confirmed by observed reductions in the standard deviation (see table 2).
Descriptive statistics of crude, 30-day readmission rates and SCV for selected patient subgroups
We then performed a regression analysis, using ordinary least squares estimators to test whether risk-adjusted, 30-day emergency readmission rates across the observation period differed from the baseline case (risk-adjusted, 30-day emergency readmission rates in 2006/2007). We found a statistically significant increase in risk-adjusted, 30-day emergency readmission rates across the observation period, with the emergency readmission rate in 2010/2011 being 0.21% (P<0.05) above the baseline emergency readmission rate in 2006/2007. The risk-adjusted, 30-day emergency readmission rate for any other year was not significantly different from the baseline. Regression output is presented in online supplementary appendix C.
Supplementary file 3
Trends and variation in emergency readmission rates for patient subgroups
While overall risk-adjusted, 30-day emergency readmission rates remained relatively stable, subanalyses by type and clinical condition of indexed admission reveals heterogeneous trends that would remain concealed in an aggregate analysis (see table 2). Risk-adjusted, 30-day emergency readmissions for all elective procedures did not decrease substantially—a reduction from 2.88% in 2006/2007 to 2.61% in 2015/2016 (P<0.05). Similarly, the SCV reduced from 35.91 in 2006/2007 to 35.30 in 2015/2016 (P<0.05). On the other hand, risk-adjusted, 30-day emergency readmissions following any emergency (ie, unplanned) indexed admission increased by 1.27% (P<0.001), from 11.49% in 2006/2007 to 12.76% in 2015/2016. Over the same period, the SCV decreased by 0.61, from 8.41 in 2006/2007 to 7.90 in 2015/2016 (P<0.01).
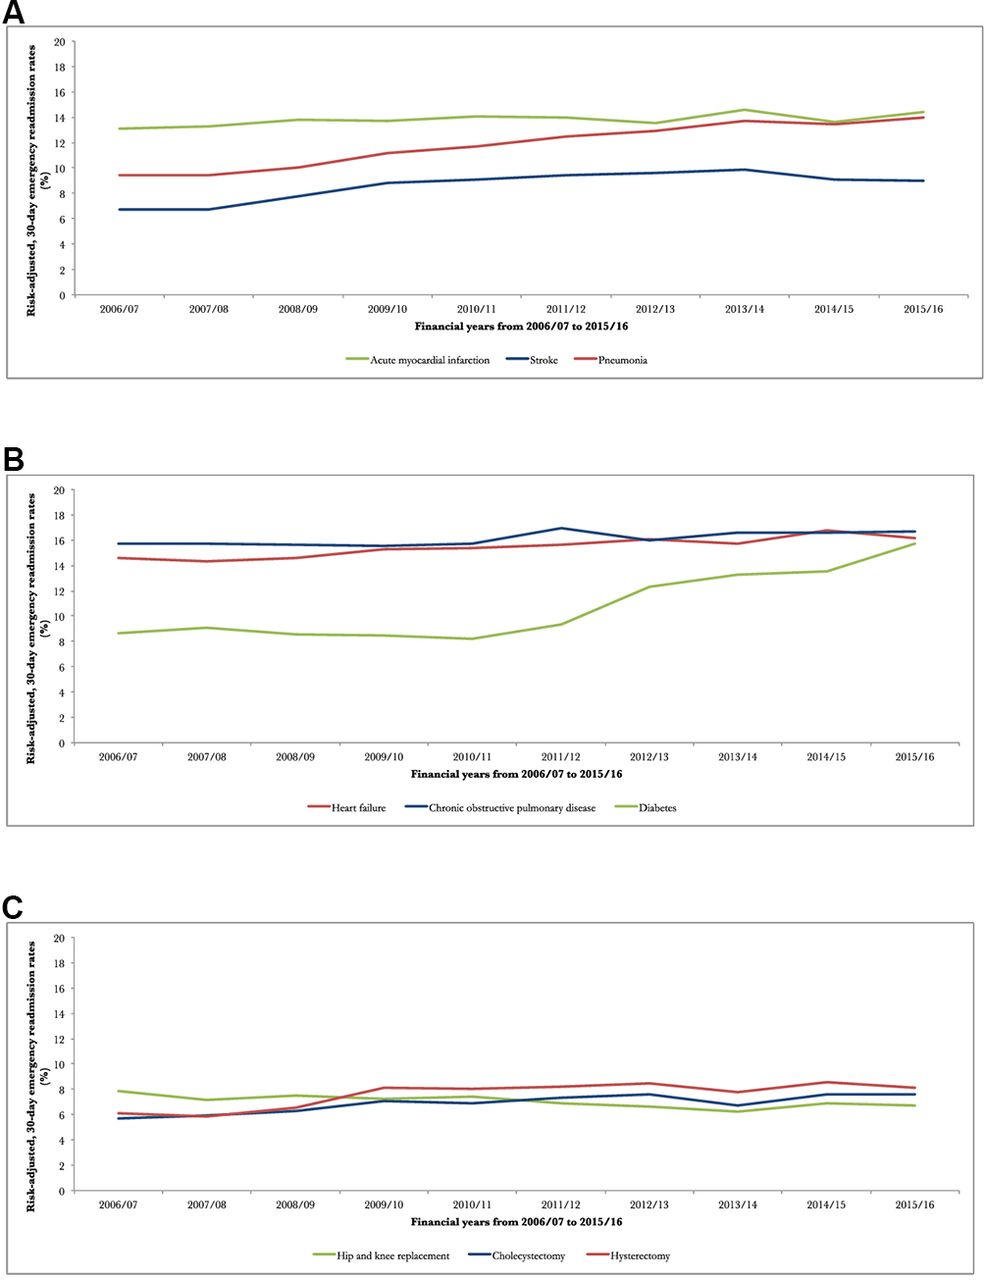
Out of the analysed elective procedures, a reduction in risk-adjusted, 30-day emergency readmissions was observed for patients undergoing total hip and knee replacements (−1.29%; P<0.001). Constant or slightly reduced readmission rates are seen for patients with indexed admissions for acute myocardial infarction (−0.04; P<0.49), stroke (+0.62; P<0.05), COPD (+0.41%; P<0.05) and heart failure (+0.15%; P<0.05). For the other four conditions, readmission rates have increased, including pneumonia (+2.72%; P<0.001), diabetes (7.09%; P<0.001), cholecystectomy (+1.86; P<0.001) and hysterectomy (+2.54%; P<0.001) (see figure 2).

Trends in risk-adjusted, 30-day emergency readmission rates for (A) indexed acute conditions, (B) indexed chronic conditions and (C) surgical interventions from 2006/2007 to 2015/2016.
Except for emergency readmissions following cholecystectomy and hysterectomy, the SCV reduced across all conditions, indicating lower levels of variation in quality of care received by patients across the country. However, all investigated conditions showed either medium or high levels of variation, with lowest levels of SCV observed in patients with heart failure (5.60) and COPD (5.97). Moreover, while the SCV reduced for patient readmitted within 7 days (−1.84) and 90 days (−0.57), 7-day emergency readmission rates were found to increase slightly from 3.20% in 2006/2007 to 3.37% in 2015/2016, and 90-day readmission rates decreased slightly from 9.99% in 2006/2007 to 9.78% in 2015/2016 (see online supplementary appendix D) .
Supplementary file 4
Discussion
Despite an enhanced policy focus aimed at reducing readmissions, which saw the introduction of national-level policies, including financial penalties for readmission reduction in hospitals reporting excess readmission rates19 and a number of local-level initiatives, little is known about the development of readmission rates over the past decade, as well as the overall effect of interventions to improve this aspect of healthcare quality. We examined emergency readmissions for all non-specialist NHS trusts in England between 2006/2007 and 2015/2016, and showed that risk-adjusted, 30-day emergency readmission rates following discharge from any indexed admission increased slightly from 6.56% in 2006/2007 to 6.76% in 2012/2013, followed by a small decrease to 6.64% in 2015/2016. At the same time, the degree of variation measured by the SCV decreased from 15.60 in 2006/2007 to 14.54 in 2015/2016. However, when we disaggregated results by type of admission and clinical condition, we observed heterogeneous trends with decreasing trends for some patient groups, but increasing ones for others. Disaggregating findings by type of admission showed that emergency readmissions following any elective surgery decreased slightly, which could be attributable to initiatives that focused on improving metrics such as infection rates (eg, Commissioning for Quality and Innovation scheme in the 2008 NHS Stage Review).42 However, emergency readmissions following an indexed emergency admission increased over the observation period. Disaggregation by clinical areas showed that readmission rates decreased for patients initially admitted for hip or knee replacements. Readmission rates stayed about constant for patients initially admitted for heart failure, acute myocardial infarction, stroke and COPD, but increased for patients initially admitted for diabetes, pneumonia, cholecystectomy and hysterectomy. We observed particularly large rises in risk-adjusted, emergency readmission rates in diabetes patients, which could have several possible explanations. For example, it could be linked to significant reductions in mortality from diabetes and rises in the number of socioeconomically deprived populations,43 but has previously also been linked to side effects of diabetic drugs.44
While previous studies examined trends in emergency readmission rates for different types of hospitals45 and surgical emergency readmission rates for selected patient subgroups as a measure for quality of care in the USA,46 this is the first study that provides a comprehensive overview of trends in risk-adjusted, 30-day emergency readmissions and variation in England over a 10-year period and disaggregated for nine clinical conditions. One study that had reported on trends of English emergency readmission rates before focused on a period up to May 2010, but did not disaggregate by clinical condition.47 Our study provides an updated overview of these changes in emergency readmissions until February 2016, and for nine subgroups. Expanding the previous observation period further is particularly important, since the NHS has focused considerable efforts into reducing readmission rates following the publication of Equity and Excellence in April 2010. While our study found similar patterns in trends of emergency readmission rates,47 the magnitude of emergency readmission rates was slightly smaller, 6.67% compared with 7.0%. This is likely to be caused by differences in the methods used for linking information from HES, and differences in defining indexed admissions.
Large variations in the reporting of readmission rates for specific clinical subgroups exist in the literature. For example, while one study reported the 30-day readmission rate for COPD to be approximately 10.2% in the NHS,48 the Royal College of Physicians reported much higher rates of approximately 31%–34%, over a 90-day period.49 In comparison, we found a readmission rate of 17.0% in 2015/2016. Moreover, research from the USA suggested readmission rates of 19.9% and 18.3% for acute myocardial infarction and pneumonia, respectively.50 We found readmissions to be lower in the NHS, 15.2% for acute myocardial infarction and 16.0% for pneumonia in 2015/2016. Other research focused primarily on the examination of care provided at singular pathway points, which included the investigation into mortality rates to assess variation of in-hospital quality between providers51 and the evaluation of healthcare policies with emergency readmissions as an outcome indicator.14 35 36
Strengths and limitations
We examined changes in 30-day emergency readmission rates across all non-specialist trusts in England between 2006 and 2016. We chose unplanned, emergency readmissions as an outcome measure, as they are mostly undesirable for patients and also add potentially avoidable strain on services. A 30-day follow-up period was chosen to capture the impact of quality along the clinical pathway, including the initial hospital stay,12 transitional care13–15 and postdischarge support.16 17 However, health service quality may also affect emergency readmissions after 30 days, with studies showing that a follow-up of 90 days may be more appropriate when assessing quality of care provided to older patients with debility, after discharge from rehabilitation services.52 Other studies have suggested that 7-day emergency readmission rates are more closely related to the quality provided at the initial hospital stay.53 To investigate this potential threat to the validity of this study, we conducted sensitivity analysis that in addition to 30-day emergency readmissions also investigated changes in trends and variation for 7-day and 90-day emergency readmissions. Outcomes from the sensitivity analyses did not materially change our findings, with small increases found for 7-day readmission rates, but small decreases in 90-day readmission rates. The SCV for both outcome measures decreased (see online supplementary appendix C). While our findings present statistically significant differences in readmission rates across financial years, the relative magnitude of change was small, with their clinical meaningfulness depending on the distribution of their incremental changes across trusts.
The validity of emergency readmission rates as a measure for quality of care had been questioned before, mainly due to their sensitivity to changes in patient case-mix, random variation and the poor correlation with other indicators of hospital quality.54 55 While the limitations of readmission rates as a metric might be a particularly relevant concern for direct provider comparisons, such as in the case of imposing financial penalties for hospitals with high readmission rates and associated fears about unintended consequences,56 in this study we aimed to assess overall trends in readmission rates for all trusts and across 10 years. This approach helped to deal with random variation and presented longitudinal changes in readmission rates in the English NHS. Since quality is multidimensional, future research should consider examining several quality metrics to provide a comprehensive picture of changes occurred in healthcare systems and over time.
We used a large administrative data source that included all hospital inpatients in England and we risk-adjusted emergency readmission rates at the patient level, accounting for systematic differences in observed patient characteristics between trusts. We adjusted for patient demographics, including socioeconomic status. Thus, we assumed that any variation in emergency readmissions that correlates with socioeconomic status was outside of the direct control of the healthcare system. While it is common practice in England to adjust for socioeconomic status, however, it is possible that the higher emergency readmission rates observed among patients living in more deprived areas is in part due to lower quality healthcare—a possibility that has been extensively discussed.56 Another concern relates to omitting variable bias in the risk-adjustment for emergency readmission rates, such as by the lack of information on clinical severity (ie, acuity determined through laboratory test results) that was found to be highly predictive of a readmission.57 Our study may therefore dilute the true predicted likelihood (ie, upward or downward depending on the severity of disease) of a patient having to return to hospital. We were not able to address this limitation within our dataset, but we used the Charlson Index to capture some of the patients’ clinical complexity58 and further accounted for improvements in recording practices by including interaction terms of the Charlson Index in each financial years into our risk-adjustment model.
We constructed the SCV, a measure that represented potentially ‘avoidable’ variation that can be attributed to differences in quality of care, provided our controls for patient characteristics that are not under the influence of the health system within the prediction model. Similar to the risk-adjusted readmission rates, the interpretation of the SCV follows the assumption that all ‘unavoidable’ variation in readmissions was sufficiently addressed by the information that was entered into the prediction model. However, it is possible that other factors explained the variation in emergency readmission rates. In particular, the subgroup analysis showed rises in emergency readmission rates for many of the selected acute conditions. These changes might be explained by reductions in patient mortality, triggered through technological advancements, which have been found to inversely correlate with emergency readmission rates for patients with hip fracture.59 In fact, increases in readmission rates may reflect positively on the care provided to patients in the NHS. Our findings are also susceptible to time-varying confounders, such as the establishment of Hyper Acute Stroke Units in London and Greater Manchester in 2010,60 leading to a step change in quality provided to stroke patients across different parts of the country.
While our study was able to describe overall changes in emergency readmission rates over time, we were not able to make inferences about the effectiveness of specific healthcare interventions. Future research should therefore evaluate the mechanism of local-level and national-level policies aimed at improving quality of care in England, such as the introduction of financial penalties,19 or improvements in access to general practitioners.61 Linkages of secondary care data with information on care received during the postdischarge period would allow establishing causal relationships along the patient pathway. Populating risk-adjustment models with information other than those currently available from secondary care datasets would allow for more precise estimates of risk-adjusted, emergency readmission rates. Future research might also benefit from additional exploration of audit data that could hold information on quality, which is not commonly available within large administrative health datasets.
Conclusions
Small initial rises in emergency readmission rates after discharge from any indexed admission was followed by stable, or even slightly decreasing emergency readmission rates after 2012/2013. We also found a decrease in variation between hospital trusts from 2006/2007 to 2015/2016. These changes in readmission rates fall into a period of an enhanced focus on reducing readmission rates in the English NHS, thereby suggesting possible impacts of local-level and national-level efforts to stabilise, or even contain rises in emergency readmission rates since 2010. However, changes in both metrics were only modest, and they varied widely by clinical area, which might have several possible causes. For example, while reductions in readmissions for long-term conditions may indicate changes in quality provided outside the hospital (ie, in primary care settings), increases in readmissions for acute conditions such as patients with pneumonia might be linked to factors in quality not captured through readmission rates, such as improvements in patient survival at the indexed admission. Finally, and importantly, changes in readmission rates may be related to changes in other factors that we could not adjust for in our analysis.
It is the aim of any health system to provide care at the highest quality standard and equally to all patients regardless of where they access the health system. While the focus on reducing emergency readmission rates in the English NHS may yield certain benefits, policy makers would ideally develop an understanding about changes in variation of care quality measured by a range of metrics over time to introduce targeted and effective improvement strategies.
Acknowledgments
We thank the two referees and editor for their detailed and thoughtful comments which helped us to substantially improve the paper.
References
Footnotes
Contributors RF had the idea for this study. RF and AS came up with the statistical analysis plan. RF carried out the analysis. RF, AS, KH and PA drafted and finalised the paper.
Funding This research was conducted independently, but has received support by the National Institute for Health Research (NIHR) Imperial Patient Safety Translational Research Centre, the National Institute for Health Research Health Protection Research Unit (NIHR HPRU) in modelling methodology at Imperial College London in partnership with Public Health England (PHE), and by the MRC centre for outbreak analysis and modelling (funding reference: MR/K010174/1B).
Disclaimer The views expressed are those of the authors and not necessarily those of the NHS, the NIHR or the Department of Health.
Competing interests None declared.
Patient consent Detail has been removed from this case description/these case descriptions to ensure anonymity. The editors and reviewers have seen the detailed information available and are satisfied that the information backs up the case the authors are making.
Provenance and peer review Not commissioned; externally peer reviewed.
Data sharing statement The data controller of the data analysed is NHS Digital. Patient-level data are available subject to their information governance requirements.