Article Text

Abstract
Objective To systematically review the research conducted on prevalence of frailty and prefrailty among community-dwelling older adults in low-income and middle-income countries (LMICs) and to estimate the pooled prevalence of frailty and prefrailty in community-dwelling older adults in LMICs.
Design Systematic review and meta-analysis. PROSPERO registration number is CRD42016036083.
Data sources MEDLINE, EMBASE, AMED, Web of Science, CINAHL and WHO Global Health Library were searched from their inception to 12 September 2017.
Setting Low-income and middle-income countries.
Participants Community-dwelling older adults aged ≥60 years.
Results We screened 7057 citations and 56 studies were included. Forty-seven and 42 studies were included in the frailty and prefrailty meta-analysis, respectively. The majority of studies were from upper middle-income countries. One study was available from low-income countries. The prevalence of frailty varied from 3.9% (China) to 51.4% (Cuba) and prevalence of prefrailty ranged from 13.4% (Tanzania) to 71.6% (Brazil). The pooled prevalence of frailty was 17.4% (95% CI 14.4% to 20.7%, I2=99.2%) and prefrailty was 49.3% (95% CI 46.4% to 52.2%, I2=97.5%). The wide variation in prevalence rates across studies was largely explained by differences in frailty assessment method and the geographic region. These findings are for the studies with a minimum recruitment age 60, 65 and 70 years.
Conclusion The prevalence of frailty and prefrailty appears higher in community-dwelling older adults in upper middle-income countries compared with high-income countries, which has important implications for healthcare planning. There is limited evidence on frailty prevalence in lower middle-income and low-income countries.
PROSPERO registration number CRD42016036083.
- ageing
- frailty syndrome
- epidemiology
- systematic review
- meta-analysis
- LMICs
This is an Open Access article distributed in accordance with the Creative Commons Attribution Non Commercial (CC BY-NC 4.0) license, which permits others to distribute, remix, adapt, build upon this work non-commercially, and license their derivative works on different terms, provided the original work is properly cited and the use is non-commercial. See: http://creativecommons.org/licenses/by-nc/4.0/
Statistics from Altmetric.com
Strengths and limitations of this study
This is the first systematic review and meta-analysis of the prevalence of frailty and prefrailty among community-dwelling older adults in low-income and middle-income countries.
We conducted a comprehensive literature search in six electronic databases with a comprehensive search strategy, including WHO Global Health Library to capture studies published regionally.
No language restriction was imposed.
Subgroup analysis of prevalence of frailty and prefrailty was performed with substantial number of studies, and meta-regression technique was used to identify the sources of heterogeneity between the studies.
We did not include grey literature in this review.
Introduction
Population ageing is not confined to high-income countries (HICs). People in low-income and middle-income countries (LMICs) have increasing life expectancy with the advancement of healthcare services.1 The pace of population ageing is faster in LMICs compared with HICs.2 This creates an additional burden for these countries with growing economies as they have to tackle health, social and welfare issues associated with ageing populations.
Frailty is a health problem of older age with no universally agreed conceptual or operational definition. However, there is a common agreement that frailty is an important clinically identifiable state that increases the vulnerability to adverse outcomes due to the decline in reserve and functions in multiple physiological systems.3 The Fried phenotype of frailty, comprising five phenotypic criteria (unintentional weight loss, self-reported exhaustion, weakness, slowness and low physical activity),4 and the frailty index (comprising a list of deficits)5 are the most frequently used frailty assessment methods in the literature.6 Longitudinal studies have identified several negative outcomes associated with frailty which can have a huge impact on individual lives and society as a whole. These include falls, worsening mobility, disability, hospitalisation and increased risk of mortality.4 5 7 8
Prefrailty is an intermediate state between frailty and non-frailty/robust that has higher risk of progressing to frailty.9 Since frailty status is assessed using different assessment methods, most of the assessment methods have its own cut-off for prefrailty status. For instance, having one to two criteria of five is considered as prefrail for the Fried’s phenotype.4 Like frailty, prefrailty is also associated with adverse health outcomes. Findings from a recent meta-analysis based on six prospective cohort studies suggested increased risk for faster onset of any type of cardiovascular diseases in prefrail versus robust.10 Another longitudinal study also showed that prefrail individuals are more likely to show persistent and new depressive symptoms.11 Evidence is emerging that frailty as a dynamic state with transitions between frailty statuses; frailty, prefrailty and non-frailty;12–14 and there is potential for interventions to improve the health and well-being of both frail and prefrail older adults.
A substantial amount of research on frailty has been conducted in HICs. According to a systematic review conducted in 2012, the weighted prevalence of frailty in HICs is 10.7% and prefrailty is 41.6%.15 There is some suggestion of a socioeconomic gradient in frailty between HICs; one study from 15 European countries reported a lower mean frailty index in North and Western Europe compared with lower income countries in South and Eastern Europe.16 In addition, the survival of frail older people was higher in countries with a higher relative income within Europe.16 It is possible that the prevalence of frailty in LMICs is higher than HICs, given a steeper gradient in income. Alternatively, the prevalence may be lower with a reduced life expectancy of older people in LMICs. A narrative review published in 2015 on frailty in developing countries found limited availability of studies and suggested that frailty occurs more frequently in developing countries.17 However, no studies are available up-to-date collating all the epidemiological findings available from LMICs to examine the burden of frailty in these countries. This is important to inform healthcare planning in these countries in the context of world-wide population ageing. The aim of this study was to conduct a systematic review and meta-analysis on prevalence of frailty and prefrailty among community-dwelling older adults in LMICs.
Methods
Search strategy and selection criteria
We performed a comprehensive structured search in six electronic bibliographic databases. MEDLINE, EMBASE and AMED databases using OvidSP interface, Web of Science Core Collection, CINAHL Plus databases and WHO Global Health Library were searched from their inception to 12 September 2017. Two concepts ‘frailty’ and ‘LMICs’ were used to develop the electronic search strategy. The example LMIC filters developed by the Cochrane organisation in 2012 was used with slight modifications.18 The World Bank country classification issued on 1 July 2017,19 based on 2016 economic data was used to identify the countries that switched from LMICs to HICs in 2017 or vice versa. Studies in these countries were included only if the country belongs to low-income and middle-income category during the time of data collection. The electronic search strategy was first developed for MEDLINE (online supplementary appendix A) and then adapted accordingly to other databases. The electronic search strategy was developed with the support of specialist librarian (SP). Additionally reference lists of the selected articles were scanned and citation searches were performed in the Web of Science. The search was limited to full-text articles as study quality assessment requires a detailed description on the methodology. No language restriction was imposed on the search.
Supplementary file 1
The condition studied was frailty measured by any assessment method. The review was restricted to studies with community-dwelling older adults aged ≥60 years living in the LMICs. This age cut-off is in line with the United Nations’s definition of older populations.20 Studies with institutionalised or hospitalised adults, nursing home residents, outpatients of primary or secondary care clinics, or older adults belonging to specific disease groups were excluded. Cross-sectional studies conducted to assess the prevalence and associated factors of frailty, prospective follow-up studies that have baseline prevalence of frailty, cross-sectional studies conducted to explore the association of frailty with some other health variable or disease (eg, haemoglobin level and cardiovascular risk factors) were included in this review.
Identified citations were exported into EndNote X8 and duplicates were removed. In the first stage, the title and abstracts of the citations were screened against inclusion and exclusion criteria to identify potentially eligible citations. In the second stage, full texts of potentially eligible articles were retrieved. Two reviewers (DDS and SH) independently reviewed the full-text articles to identify the articles meeting eligibility criteria. If multiple studies were available from the same cohort, the study with the largest sample and most information was included in the review. The agreement between the two raters was high with a kappa value of 0.84 (95% CI 0.72 to 0.90). Disagreement between the reviewers was resolved through discussions and consulting senior researchers in the research team (KRW, GR and MCW).
Study quality assessment and data extraction
Selected articles were subjected to a quality assessment. Methodological rigour of the articles was assessed using eight criteria proposed by Loney et al 21 for the critical appraisal of the prevalence literature. If a study achieved three criteria or less, it was excluded from the review. Study quality of all selected articles (61) was assessed by the first reviewer (DDS). The second reviewer (SH) assessed the study quality of a random 10% of articles to check for discrepancies.
Data extraction included information on study background (authors and year of publication, data source, study setting and study period), characteristics of the population (percentage of women in the study population, mean age, age range, number of frail and prefrail participants in the total sample, and by sex and age), study methodology (study design, effective sample, sampling technique and frailty assessment method) and study strengths and limitations. Authors were contacted requesting additional data required for subgroup analysis.
Data analysis
The results of the systematic review are presented in tabular format and narratively synthesised. All statistical analyses were performed in Stata V.14 (StataCorp, College Station, Texas, USA). A random-effects meta-analysis with 95% CI was performed to calculate the pooled prevalence of frailty and prefrailty. A random-effects model was chosen as there is a variation in the true effect from one study to another. And also, there was considerable heterogeneity of the study characteristics including geography, frailty assessment method, frailty cut-offs and recruitment age. When a study has used multiple assessment methods of frailty, the prevalence presented using Fried phenotype was used for the meta-analysis as it was the most commonly used assessment method in the literature.22 The analysis was performed on Freeman-Tukey double arcsine transformed proportions to stabilise the variance. We used metaprop random ftt command.23 Results were presented using forest plots. The main meta-analysis and subgroup analysis excluded three studies, two studies with minimum recruitment age of ≥80 years and another study with minimum recruitment age of ≥90 years as those based on much older populations with expected higher prevalence rates for frailty. The findings from these studies were reported separately.
Cochran’s Q statistic was used to assess heterogeneity between the studies. P<0.05 was considered as evidence of heterogeneity. The I2 statistic was further used to quantify the magnitude of the heterogeneity. I2 values of 25%, 50% and 75% were considered as of low, moderate and high heterogeneity, respectively.24 Funnel plots generated by metafunnel command was used to visually inspect the existence of reporting biases and/or between study heterogeneity. In the absence of biases and/or between study heterogeneity, funnel plot will be a symmetrical inverted funnel in shape.25 However, this eye ball test is subjective. Hence, we used Egger’s weighted regression test to measure the degree of funnel plot asymmetry. The null hypothesis for Egger’s test is that symmetry exists in the funnel plot.26 27 Stata metabias command was used.
Subgroup analysis of frailty and prefrailty prevalence was performed according to the frailty assessment method (Fried phenotype with five criteria where weakness and slowness assessed objectively using grip strength and gait speed, Fried phenotype with five criteria where weakness and slowness assessed using self-reported questions (subjective), Fried phenotype with four criteria, Edmonton Frail Scale (EFS), frailty index and FRAIL scale). If the same cohort of participants had been assessed using different frailty assessment methods, we used that information in the subgroup analysis. However, studies that have used different frailty assessment methods to that mentioned above were excluded from the frailty and prefrailty subgroup analysis as they cannot be grouped into a particular category that is Study of Osteoporotic Fractures (SOF) index and Cuban frailty criteria, Brief Frailty Instrument for Tanzania (B-FIT). Further subgroup analyses by sex, age group (60–64, 65–69, 70–74, 75–79, 80–84, 85+ years), age and sex were performed with studies which had employed the Fried phenotype with five criteria where weakness and slowness assessed using objective tests. A two-sample proportion test was used to compare the prevalence of frailty and prefrailty by sex.
We performed a supplementary analysis to compare our findings with HICs. We used published data from a systematic review on prevalence of frailty which includes HICs only.15 This review included 14 studies which had used Fried’s phenotype of frailty assessment method. We estimated the random-effects pooled prevalence of frailty and prefrailty only with the studies that have used the Fried phenotype with five criteria where weakness and slowness assessed using objective tests (10 studies). Minimum recruitment age of the participants included in this review was 65 years. For a fair comparison we calculated the random-effects pooled prevalence of frailty and prefrailty only with the studies of minimum recruitment age 65 years that have used same assessment method included in our review.
Random-effects univariable and multivariable meta-regression were performed using metareg command to identify the potential sources of heterogeneity between the studies (demographic, geographical and methodological).28 Three studies which used SOF index, Cuban frailty criteria and Brief Frailty Instrument for Tanzania (B-FIT) were excluded from the analysis. The following explanatory variables were included in the models; mean age, percentage of women in the study sample, study quality assessment score, World Bank region classification (Latin America and the Caribbean, East Asia and Pacific, Europe and Central Asia, and South Asia) and frailty assessment method. All the variables were included in the multivariable model irrespective of their significance (P value) in univariable analysis. Variables with P<0.05 were considered as significant. The systematic review protocol of this study is registered in PROSPERO and the number is CRD42016036083. This systematic review and meta-analysis have been reported according to the Preferred Reporting Items for Systematic Reviews and Meta-Analyses (PRISMA 2009 checklist is attached separately).29
Results
Study characteristics
The search yielded 10 253 records, with 7057 records left after removing duplicates. Fifty-six studies meeting all eligibility criteria were included in the systematic review (figure 1). Forty-seven and 42 studies were included in the meta-analysis of frailty and prefrailty, respectively.

Study selection.
The study quality assessment score of the studies included ranged from 3.5 to 7.5, with a mean score of (SD) 6.0 (1.07). Quality assessment results of the studies are presented in the online supplementary appendix B. The characteristics of included studies are described in the online supplementary appendix C. Fifty studies have been published between 2012 and 2017. The majority of the studies were from the Latin America and the Caribbean region, predominantly from Brazil (n=24). Most of the studies had used data from large population-based cross-sectional or longitudinal studies on ageing.
The sample size of the studies varied (range 54–12 373) and the minimum recruitment age of the study participants varied from 60 to 90 years. The minimum age at recruitment of the study participants was 60 years in 30 studies, 65 years in 19 studies, 70 years in 4 studies, 80 years in 2 studies and 90 years in 1 study. Fifty-two studies had reported the percentage of women in the study samples and it varied from 48.1% to 100.0%, with more than half of participants being women in all except three studies. Forty-two studies reported the mean age (42/56) of the participants, which ranged from 68.2 to 77.2 years after excluding three studies with minimum recruitment age ≥80 years (two studies) and ≥90 years (one study).
Studies used various frailty assessment methods. The Fried phenotype was the most extensively used method. Researchers had operationalised the Fried phenotype differently. We identified three broad categories based on the number of phenotypic criteria used and measures used to operationalise those criteria. Those are Fried phenotype with five criteria—weakness and slowness assessed using objective tests, Fried phenotype with five criteria—weakness and slowness assessed using self-reported questions (subjective) and Fried phenotype with only four criteria.
Prevalence of frailty and prefrailty
Irrespective of the frailty assessment method, the prevalence of frailty varied from 3.9% in China (Fried phenotype with five criteria—weakness and slowness assessed using objective tests) to 51.4% in Cuba (Cuban frailty criteria) and prevalence of prefrailty ranged from 13.4% in Tanzania (Brief Frailty Instrument for Tanzania, B-FIT) to 71.6% in Brazil (Fried phenotype with five criteria—weakness and slowness measured objectively) for the studies with minimum recruitment age 60, 65 and 70 years. There was one study in those aged ≥90 years, reporting 61.8% participants as frail using the frailty index (not reported prefrailty). Another study with aged ≥80 years had not reported a cut-off value for the frailty index to define frail participants. Instead, authors had reported six levels based on the value of the frailty index and the percentage of participants belongs to each level. The other study with aged ≥80 years reported 14.8% and 63.8% participants as frail and prefrail, respectively, using Fried phenotype with five criteria—weakness and slowness assessed using objective tests. When restricting to the studies that used Fried phenotype with five criteria and assessed the weakness and slowness objectively, the prevalence of frailty varied from 3.9% (China) to 26.0% in India. The prevalence of prefrailty varied from 40.7% to 71.6% in Brazil.
Pooled prevalence of frailty and prefrailty
Descriptions of included studies in the meta-analysis are presented in table 1. Sixty-nine prevalence estimates (47 studies), corresponding to a total of 75 133 community-dwelling older adults, were included in the frailty meta-analysis. The random-effects pooled prevalence of frailty in community-dwelling older adults was 17.4% (95% CI 14.4% to 20.7%). Cochran’s Q and I2 indicated a high heterogeneity between included studies (Q=8756.8, df=68, P<0.001; I2=99.2%) (figure 2). Funnel plot asymmetry (figure 3) revealed evidence of reporting biases and/or between study heterogeneity. Results of Egger’sweighted regression test further confirmed the funnel plot asymmetry (P=0.042).
Descriptions of the studies included in the meta-analysis of prevalence of frailty and prefrailty

Random-effects pooled prevalence of frailty among community-dwelling older adults in LMICs. ES, effect size; LMICs, low-income and middle-income countries.

Funnel plot for assessing publication or other types of biases in meta-analysis of prevalence of frailty. ES, effect size.
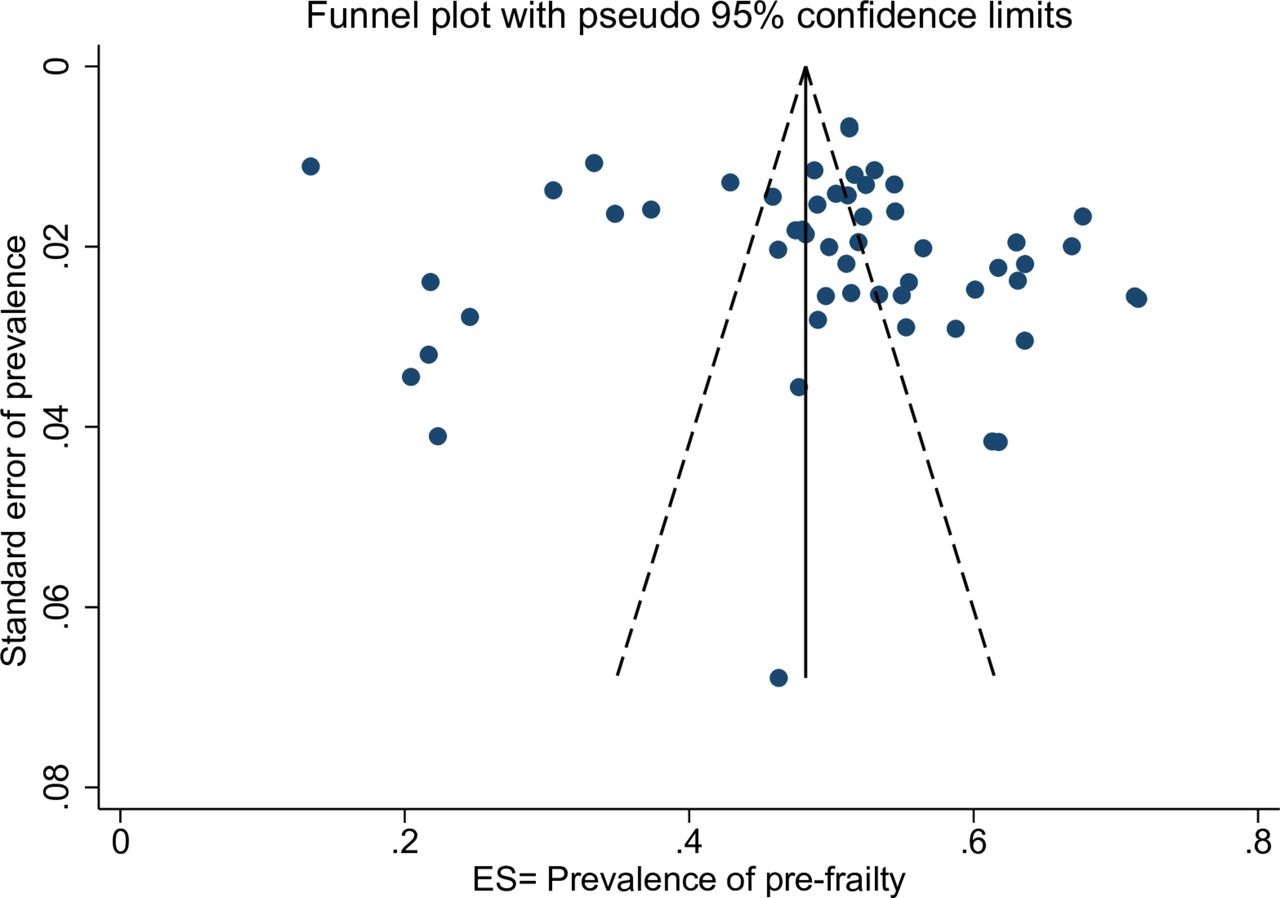
Fifty four prevalence estimates (42 studies) corresponding to 47 302 participants were included in the prefrailty meta-analysis. The random-effects pooled prevalence of prefrailty in community-dwelling older adults was 49.3% (95% CI 46.4% to 52.2%). High heterogeneity was observed between included studies (Q=2082.6, df=53, P<0.001; I2=97.5%) (figure 4). Asymmetric funnel plot (figure 5) suggested the existence of reporting biases and/or between study heterogeneity. However, results of Egger’s weighted regression test was insignificant indicating no funnel plot asymmetry (P=0.817).

Random-effects pooled prevalence of prefrailty among community-dwelling older adults in LMICs. ES, effect size; LMICs, low-income and middle-income countries.
Funnel plot for assessing publication or other types of biases in meta-analysis of prevalence of prefrailty. ES, effect size.
Subgroup analyses
The pooled prevalence varied by the assessment method and the highest prevalence of frailty was reported for the EFS, 35.9% (95% CI 31.7% to 40.2%, I2=61.9%, P=0.022). The lowest prevalence of frailty was reported for the FRAIL scale, 12.4% (95% CI 8.4% to 17.1%). The pooled prevalence of frailty for the Fried phenotype with five criteria—weakness and slowness assessed using objective tests was 12.7% (95% CI 10.9% to 14.5%, I2=94.8%, P<0.001) (online supplementary appendix D). Results for pooled prevalence of prefrailty stratified by the frailty assessment method is presented in the online supplementary appendix D.
Twenty-four prevalence estimates were available from 24 studies using the same assessment method (Fried Phenotype with objective tests) for sex-stratified analysis of prevalence of frailty and prefrailty. In total, there were 10 507 and 15 458 male and female participants, respectively. The pooled prevalence of frailty in men was 11.1% (95% CI 8.9% to 13.4%, I2=91.4%, P<0.001) compared with 15.2% (95% CI 12.5% to 18.1%, I2=95.2%, P<0.001) in women. Frailty prevalence was significantly higher in women compared with men (Z=−7.38, P<0.001). The pooled prevalence of prefrailty in men was 53.8% (95% CI 51.3% to 56.3%, I2=80.9%, P<0.001) and women was 56.3% (95% CI 54.0% to 58.7%, I2=86.2%, P<0.001). Similar to frailty, there was a statistically significant sex difference in prefrailty (Z=−3.51, P<0.001).
The prevalence of frailty increased gradually with advancing age (online supplementary appendix E). The prevalence considerably increased after age of 75 years. The prevalence of prefrailty also slightly increased with advancing age and was >50% in all age groups. An age-related incremental rise in frailty was evident even after stratification by sex (online supplementary appendix F). Prevalence of frailty was higher in women in all 5-year age bands. There was no age-related trend for prefrailty after stratification by sex (online supplementary appendix G).
Supplementary analysis
Ten prevalence estimates (10 studies), corresponding to a total of 27 660 community-dwelling older adults from HICs and 21 prevalence estimates (13 studies), corresponding to a total of 9586 community-dwelling older adults from middle-income countries, were included in the frailty meta-analysis. The random-effects pooled prevalence of frailty in community-dwelling older adults in HICs and middle-income countries were 8.2% (95% CI 5.7% to 11.2%) (online supplementary appendix H) and 12.3% (95% CI 10.4% to 14.4%) (online supplementary appendix I), respectively. The prevalence of frailty in older adults from middle-income countries was significantly higher compared with the older adults residing in HICs, (Z=−8.86, P<0.001). However, it is also of note that studies included in the meta-analysis of HICs were predominantly from the USA whereas studies included in the middle-income countries meta-analysis were predominantly from Brazil and all the countries belong to upper middle-income category except one study from India. The pooled prevalence of frailty except the study from India was 11.8% (95% CI 10.0% to 13.6%) and still significantly higher compared with HICs.
The random-effects pooled prevalence of prefrailty in community-dwelling older adults in HICs and middle-income countries were correspondingly 43.9% (95% CI 40.9% to 46.9%) (online supplementary appendix J) and 55.3% (95% CI 52.0% to 58.6%) (online supplementary appendix K). Like frailty, prevalence of prefrailty also significantly higher among the older adults in middle-income countries compared with the higher income countries (Z=−17.14, P<0.001).
Meta-regression
After adjusting for all the other study characteristics in a multivariable meta-regression model, there remained statistically significant differences in frailty prevalence between different assessment methods. Use of EFS, frailty index and Fried phenotype (five criteria, weakness and slowness assessed using self-reported questions (subjective)) was associated with a frailty prevalence approximately 20% higher than the reference method (Fried phenotype five criteria with objective tests). Geographic region was also a statistically significant predictor of frailty. The variables included in the multivariable model (mean age, % of women in the sample, study quality assessment score, geographic region and frailty assessment method) explained 58.4% of variability between the studies included in the analysis (table 2).
Univariable and multivariable meta-regression results
Discussion
Summary of main findings
Only one epidemiological study on frailty was found from countries with low-income economies30 (≤US$1005) according to World Bank Classification, 2017.19 Of countries with lower middle-income economies (US$1006–US$3955) we only found two studies both from India. One was a study site of a multicountry study31 and the other one was a small community-based cross-sectional study.32 All the other studies have been conducted in countries with upper middle-income economies (US$3956–US$12 235) indicating income inequality in frailty research.
The random-effects pooled prevalence of frailty and prefrailty in community-dwelling older adults were 17.4% (95% CI 14.4% to 20.7%) and 49.3% (95% CI 46.4% to 52.2%), respectively. Frailty was significantly higher in women compared with men and as expected increased with age. This finding is consistent with previous research.15 33–36 Interestingly, the prevalence of prefrailty was also slightly increasing across all age groups at around half the participants. Both the prevalence of frailty and prefrailty appeared significantly higher in community-dwelling older adults in upper middle-income countries compared with HICs.
Comparison with the existing literature
The pooled prevalence of frailty and prefrailty in LMICs in this review appeared to be higher than the weighted prevalence in HICs reported previously (10.7%, (95% CI 10.5% to 10.9%) and 41.6% (95% CI 41.2% to 42.0%), respectively).15 However, it is also of note that the participants in HICs included people aged ≥65 years, whereas 50% of studies in our meta-analysis included participants aged ≥60 years. Given that prevalence of frailty increases with age, when participants of a higher age group are selected, a higher prevalence would be expected. Our meta-analysis included 18 studies (36 estimates) with a population aged ≥65 years. The prevalence of frailty of this subsample was 14.6% (95% CI 11.9% to 17.4%) and still higher compared with HICs. In the review of frailty in HICs, most studies were from Europe and North America. Studies included in our review were predominantly from Latin America and the Caribbean and belong to the countries with upper middle-income economies, with little representation of lower middle-income and low-income countries. A recent meta-analysis in Latin America and Caribbean showed consistent findings to our study, with nearly one out of five older adult defined as frail.37
We found lower prevalence rates when we restricted the meta-analysis only to the Fried phenotype with five criteria, including objective measures of weakness and slowness. This found a pooled prevalence of frailty of 12.7% and prefrailty of 55.2%. The review on frailty and prefrailty which included only HICs has simply reported the weighted prevalence of frailty and prefrailty.15 Given the heterogeneity of the studies along with the actual differences of frailty estimates in different populations, we performed a supplementary analysis for a fair comparison of frailty estimates between HICs and middle-income countries (no studies were available from low-income countries using the same frailty assessment method). Results indicated significantly higher prevalence of frailty and prefrailty among community-dwelling older adults in middle-income countries compared with the HICs. Another review of the prevalence of frailty measured by the Fried phenotype based on community-dwelling older adults ≥ 65 years in nationally representative samples reported lower prevalence to our estimate except in the countries of Southern Europe (France, Italy, Greece and Spain).38 Lower prevalence of frailty is also observed in high-income Asian countries (Japan, Singapore and Taiwan).36 39–41
In contrast to these findings, a single multicountry study conducted with data from 14 HICs in Europe and six LMICs (China, Ghana, India, Mexico, Russian Federation and South Africa) reported higher frailty level (high mean frailty index) in HICs compared with the low-income countries.34 This study included nationally representative samples of adults aged ≥50 years. They also found an inverse association between level of frailty and income and education in both HICs and low-income countries. Individuals with poor education and low income were more likely to be frail. Higher levels of frailty in HICs could be due to the higher survival rate of participants with advanced healthcare and social protection. On the other hand, as the frailty index is based on a list of deficits including diagnosed diseases, many medical conditions could be under reported/diagnosed in the participants in LMICs. Similarly, in most LMICs where access to continued care is lacking, maintenance of medical records are poor making it difficult to use cumulative deficit models.
In our study, even among the studies using Fried phenotype with objective criteria, there was considerable variation in operationalising the five phenotypic criteria. Furthermore, the approach to deriving frail cut-offs for weakness, slowness and physical activity criteria were varied. Of thirty studies, 17 have calculated their population specific cut-offs based on the anthropometry of their own study populations. Eight studies have used the cut-offs developed by Fried et al in the Cardiovascular Health Study (CHS).4 The pooled prevalence of frailty is higher with the studies that used CHS cut-offs compared with the studies that used own population specific cut-offs. However, the pooled prevalence of prefrailty was similar in both groups. Similarly, the number of deficits used in frailty index and cut-off points for defining frailty and prefrailty status were inconsistent.42–44 A further meta-analysis with all available studies including both higher and the lower and middle-income countries would be valuable, controlling for frailty assessment method, sex and age composition of the sample. In addition, methodologically comparable studies across countries are required to study the true population difference of frailty.
Strengths and weaknesses
This is the first systematic review and meta-analysis on prevalence of frailty and prefrailty among community-dwelling older adults in LMICs. The strengths of our study include we conducted a comprehensive literature search in six electronic databases with a comprehensive search strategy, including WHO Global Health library to capture studies published regionally. No language restriction, subgroup analysis of prevalence of frailty and prefrailty with substantial number of studies, and using a meta-regression technique to identify the sources of heterogeneity between the studies, contacting authors to get the additional information of the studies required for subgroup analyses were also strengths.
Both funnel plot asymmetry and the results of the Egger’s weighted regression test indicated the presence of reporting biases and/or between study heterogeneity in the random-effects meta-analysis of frailty. The nature of our study effect (prevalence) is unlikely to be affected by publication bias. However, publication bias could also be affected by study size, funding source or research group.27 We noted that majority of the studies included in our meta-analysis have large samples. Multiple sources have been identified that could affect funnel plot asymmetry including reporting biases (publication bias, selective outcome reporting and selective analysis reporting), poor methodological quality, true heterogeneity, artefactual and chance.25 26 In our case, we believe that the funnel plot asymmetry is mainly due to the true heterogeneity between the studies mainly because of the use of different frailty assessment methods. And also, it is possible to have a true underlying difference of frailty prevalence in different populations. Another limitation of this study was non-inclusion of grey literature.
Implications for practice
The findings of the study suggest that the prevalence of frailty appears higher among community-dwelling older adults in upper middle-income countries compared with HICs. One study was identified from low-income countries and two studies from a lower middle-income country. Despite evidence that populations are rapidly ageing in many of these countries, we do not currently know the prevalence of frailty in these populations to inform health and social care planning. Research is required from low-income and lower middle-income countries with rapidly ageing populations to estimate burden of frailty and to understand how frailty affects the day-to-day lives of older people. Furthermore, a consensus is required on methods of assessing frailty to allow for more robust comparisons across populations.
Acknowledgments
The authors thank Sophie Pattison (SP), Clinical Support Librarian, Royal Free Hospital Medical Library for the assistance and support provided to conduct the literature search. They also acknowledge all the authors who sent additional data required for meta-analysis.
References
Footnotes
Contributors DDS, KRW and GR: conceived the idea of this systematic review. DDS: designed, conducted the study and drafted the manuscript. SH: was the secondary reviewer of the systematic review and involved with screening, data extraction, study quality assessment, data analysis and provided important intellectual facts to revise the manuscript. KRW, GR and MCW: provided important feedback at various stages of the study; devised the protocol, resolved the disagreements between DDS and SH at the study selection process, clarified the issues related to study quality assessment and interpreted the findings and provided important intellectual facts to revise the manuscript.
Funding DDS is a Commonwealth Scholar, funded by UK government (LKCS-2015-678) outside the submitted work.
Disclaimer UK government, the funder, has no role in the design, executing, analysis, interpretation, drafting the paper or decision to publish.
Competing interests None declared.
Patient consent Not required.
Provenance and peer review Not commissioned; externally peer reviewed.
Data sharing statement No additional data available.