Article Text

Abstract
Objectives Pseudomonas aeruginosa (P. aeruginosa) occupies an important niche in the pathogenic microbiome of bronchiectasis. The objective of this study is to evaluate the clinical characteristics and prognostic value of P. aeruginosa in Chinese adult patients with bronchiectasis.
Methods This retrospective and follow-up study enrolled 1188 patients diagnosed with bronchiectasis at Shanghai Pulmonary Hospital between January 2011 and December 2012. The patients’ clinical data including anthropometry, clinical symptoms, serum biomarkers, radiographic manifestations and lung function indices were reviewed. The median follow-up duration (IQR) was 44 (40-54) months, during which 289 patients were lost to follow-up. Data from 899 patients were collected and analysed for the outcomes of mortality, annual exacerbation frequency and health-related quality of life.
Results P. aeruginosa was isolated from 232 patients, alongside other pathogens such as Aspergillus (n=75) and Candida albicans (n=72). There were 74 deaths (12% of patients with P. aeruginosa, 7.3% of those without) over the course of the follow-up. The isolation of P. aeruginosa was a risk factor for all-cause mortality (HR, 3.07; 95% CI 1.32 to 7.15) and was associated with high rates of exacerbations (ie, ≥3 exacerbations per year of follow-up) (HR, 2.40; 95% CI 1.20 to 4.79). Patients with P. aeruginosa also had worse scores on the Hospital Anxiety and Depression Scale (anxiety, p=0.005; depression, p<0.001), the Leicester Cough Questionnaire (p=0.033) and the modified Medical Research Council scale (p=0.001) compared with those without P. aeruginosa.
Conclusions Isolation of P. aeruginosa in patients with bronchiectasis is a significant prognostic indicator and should be a major factor in the clinical management of the disease.
- pseudomonas aeruginosa
- bronchiectaiss
- mortality
- exacerbation
This is an Open Access article distributed in accordance with the Creative Commons Attribution Non Commercial (CC BY-NC 4.0) license, which permits others to distribute, remix, adapt, build upon this work non-commercially, and license their derivative works on different terms, provided the original work is properly cited and the use is non-commercial. See: http://creativecommons.org/licenses/by-nc/4.0/
Statistics from Altmetric.com
Strengths and limitations of this study
This study enrolled 1188 patients with bronchiectasis from all over the country.
We conducted a 44 (40–54)-month follow-up study along with detailed analytics related to primary clinical outcomes.
It was a single-centre study in a specialised hospital.
We failed to obtain the microbiological data during follow-up due to diversified and inevitable reasons.
Introduction
Bronchiectasis is a chronic inflammatory respiratory disease defined as the irreversible dilatation of one or more bronchi.1 Predisposed individuals can develop robust inflammatory responses to tissue injuries and bacterial infections, which may contribute to structural damage. The structural abnormalities of the airways lead to abnormal mucus clearance and further bacterial colonisation and finally form a vicious cycle.2 Recent studies have recognised the niche occupied by Pseudomonas aeruginosa in the pathogenic microbiome of patients with bronchiectasis, its instigation of rapid decline in lung function and its role in the development of more extensive radiographic features of the disease.3–9 Furthermore, two multidimensional grading schemes for bronchiectasis severity, the Bronchiectasis Severity Index and the FACED score, include colonisation by P. aeruginosa as a criterion for earlier death and more frequent exacerbations and hospitalisation.5 10
Given the association between P. aeruginosa with poor clinical outcomes in patients with bronchiectasis, early detection of P. aeruginosa is of great importance. Early detection is facilitated by research on the pathogenic distribution and clinical outcomes of P. aeruginosa; however, few studies in this area have been conducted in Chinese populations. Therefore, we aim to evaluate the distribution, characteristics and prognostic value of P. aeruginosa using clinical and follow-up data collected from a specialised hospital in Shanghai, China.
Methods and materials
Study subjects
Our study examined inpatients diagnosed with bronchiectasis between January 2011 and December 2012 at Shanghai Pulmonary Hospital. Patients were excluded if they did not receive a high-resolution CT (HRCT) chest scan at the hospital or if they lacked data from either sputum or bronchoalveolar lavage fluid (BALF) samples. In this study, the PA group was defined as those patients isolated with P. aeruginosa during their hospitalisation. Meanwhile, the non-PA group was defined as those patients without P. aeruginosa. We also divided patients into PA, others (other pathogens) and negative groups in our subgroup analysis. All data collections were performed by clinical physicians who were involved in the study. Written informed consent was obtained from all patients.
Diagnosis of bronchiectasis
The presence of bronchiectasis was confirmed through HRCT examination and patient clinical history by two physicians who were blinded to the patients’ information. High-resolution images of the lungs were obtained at full inspiration at 1 mm collimation and 10 mm intervals from apex to base and were independently interpreted by hospital radiologists with extensive experience in bronchiectasis diagnosis, based on the criteria published by Naidich et al.11 Small bronchiectasis features that were only visible in a single pulmonary segment and were unrelated to clinical features were judged to be negligible, as they are known to appear in a large proportion of the healthy population.12
Data collection
According to standardised protocol, data on the anthropometry, clinical symptoms, serum biomarkers, radiographic manifestations and lung function indices at a stable state, outcomes (mortality, annual exacerbation frequency of follow-up) and quality of life (modified Medical Research Council (mMRC), LCQ and HADS scores) of all patients were uniformly recorded over a median follow-up duration of 44 (40–54) months. Body mass index (BMI) data were also collected as recent research has suggested a correlation between BMI and bronchiectasis prognosis.10 13 Interleukin (IL-1, IL-6), interferon (IFN), white blood cell (WBC), C reactive protein (CRP), erythrocyte sedimentation rate (ESR) and CD4/CD8 levels were obtained as markers of systemic inflammation and patient’s immune state. Arterial blood gas (ABG) analyses were performed at rest and on room air, with normal conditions defined as having a PaO2 within 10.34–13.3 kPa (80–100 mm Hg) and a PaCO2 within 4.65–5.98 kPa (35–45 mm Hg). Pulmonary function indices included forced expiratory volume in 1 s (FEV1), forced vital capacity (FVC) and FEV1/FVC. Dyspnoea was assessed using the mMRC scale, cough was assessed with the Leicester Cough Questionnaire (LCQ) and adverse psychological effects were assessed with the Hospital Anxiety and Depression Scale (HADS). Detailed procedures from this study are shown in figure 1.

Flow diagram depicting patient selection and analysis. HRCT, high-resolution CT.
Lower respiratory tract samples
Spontaneous sputum and BALF were collected from each patient during hospitalisation. These samples were kept at 4°C before they were sent to the hospital laboratory for analysis no more than 3 hours following sample collection. To reduce the impact on the microbe and bacterium, we did not collect sputum samples from those patients who were on antibiotics within the 2 weeks before the study. Sputum samples were deemed eligible if they contained <10 squamous epithelial cells and >25 leucocytes per low-powered field.14 Bronchoalveolar lavage fluid was processed via semiquantitative culture with a positive threshold of 104 CFU/mL.15 All samples were separated from saliva, Gram stained and homogenised. Diluted secretions were then plated on blood, chocolate, MacConkey agar and Sabouraud agar. All detection methods were performed in accordance with relevant testing standards.
Health-related quality of life
The physician-administered mMRC score is a grading system from 0 to 4 that rates the impact of dyspnoea on a patient’s everyday activities.16 ΔmMRC is the difference between the initial and final mMRC values taken and represents the change in dyspnoea severity over the follow-up period.
The LCQ score is a self-administered 19-item questionnaire measuring the physical, psychological and social impacts of chronic cough. Its severity score ranges from 3 to 21, with lower scores indicating greater impairment.17 18 ΔLCQ is the difference between the initial and final LCQ values taken and represents the change in cough severity over the follow-up period.
During the follow-up period, patients were asked to complete the self-reported HADS questionnaire, which measures the degree of anxiety and depression using 14 items, with a score of ≥11 indicating clinically significant anxiety or depression.19 In this study, we used the final HADS result for each patient.
Exacerbations
A bronchiectasis exacerbation was defined as an acute deterioration in one or more symptoms (increasing sputum volume or purulence, worsening dyspnoea, increased cough, declining lung function or increased fatigue/malaise) or the appearance of new symptoms (fever, pleurisy or haemoptysis requiring antibiotic treatment).1
Survival analysis
All patients underwent follow-up evaluations every year after discharge through telephone or face-to-face interviews. A patient was considered lost to follow-up if we were unable to contact him or her at each follow-up for any reason. The endpoint of this study was all-cause mortality, which was evaluated over a median follow-up duration of 44 (40–54) months. The cause and date of death were obtained from hospital medical records for patients who died in the hospital or from official death certificates otherwise. Follow-up was completed on 31 December 2015.
Statistical analysis
All statistical analyses were performed with SPSS, V.22.0. Qualitative and quantitative variables were summarised as relative frequencies (percentages) and medians (interquartile ranges). In the univariate analysis, Student’s t-test was used to compare groups that were normally distributed, and non-normally distributed variables were compared with the Mann-Whitney U test. Categorical variables were compared using the χ2 test. A logistic regression model was used to determine the factors associated with high rates of exacerbations. A Cox proportional hazard regression model was used to assess factors associated with survival. Variables that presented statistically significant differences (p<0.05) in the univariate analysis and variables that were of clinical interest were included as the independent variables in the first step. Then, we used the forward stepwise technique (Wald test) to remove variables with p>0.1 from the final model. The dependent variable was survival time to all-cause mortality. Survival curves between groups were constructed according to the Kaplan-Meier method and were compared using the log-rank test. HRs and 95% CIs were also calculated for each independent variable, with p<0.05 considered statistically significant.
Results
After excluding 316 patients without sputum or BALF data and 154 patients without an HRCT scan, there were 1188 patients (median age 57 (48–64) years; 45.5% men) who were ultimately entered into our study. Overall, 536 (45.1%) patients tested positive for pathogenic micro-organisms. Of the 536 organisms, there were 437 (81.5%) organisms isolated from sputum alone, 44 (8.2%) from BALF alone and 55 (10.3%) from both. P. aeruginosa was the most common pathogen, detected in 232 (43.3%) patients, followed by Aspergillus in 75 (14.0%) patients and Candida albicans in 72 (13.4%) patients. Full details are shown in table 1.
Microbiological characteristics of subjects with bronchiectasis
Next, we analysed the general characteristics of the entire patient sample, and the differences between PA (n=232) and non-PA (n=956) groups (table 2). Relative to the non-PA group, patients with P. aeruginosa tended to be women and have less extensive smoking histories, more purulent sputum expectoration, more haemoptysis, longer symptom duration, more bilateral and cystic HRCT involvement, fewer normal ABGs, greater systemic inflammation and worse lung function.
General characteristics of patients with bronchiectasis with and without PA
Data on clinical outcomes recorded during follow-up are shown in table 3. There were 899 (75.7%) patients with bronchiectasis who were followed up until the end of the study. The PA and non-PA groups presented significant differences in terms of mortality rate (deaths per person-year of observation) (p=0.045) and annual exacerbation frequency (p<0.001). Compared with the non-PA group, patients with P. aeruginosa improved less on LCQ scoring and showed greater mMRC deterioration, as well as scored higher on the HADS questionnaire.
Follow-up outcomes in patients with bronchiectasis with and without PA
Kaplan-Meier survival curves between patients in the PA group (n=183; 22 dead) and non-PA group (n=716; 52 dead) are shown in figure 2A, with PA (n=183; 22 dead), negative (n=473; 29 dead) and others (n=243; 23 dead) in figure 2B. The PA group had significantly higher rates of mortality than both the non-PA group (log rank test; p(a)=0.045) and the negative group (log rank test; p(b1)=0.017), while the mortality between the PA group and the others group (log rank test; p(b2)=0.414) or the others group and the negative group (log rank test; p(b3)=0.125) showed no statistically significant differences.

Kaplan-Meier plot illustrating the survival of all patients with bronchiectasis. There are statistically significant differences in (A) and (B). (p(a)=0.045; p(b1)=0.017; p(b2)=0.414; p(b3)=0.125. P(a) means the difference between PA and non-PA groups; p(b1) means the difference between PA and negative groups; p(b2) means the difference between PA and others groups; p(b3) means the difference between others and negative groups).
Tables 4 and 5 show the unadjusted and fully adjusted Cox regression analyses. We checked on the proportional hazards assumption and found that it was adequate. The PA group was found to have a significantly higher risk of all-cause mortality compared with either the non-PA (unadjusted HR, 1.65; 95% CI 1.01 to 2.72) group or the negative (unadjusted HR, 2.09; 95% CI 1.17 to 3.75) group. This did not change significantly in the fully adjusted model for either the non-PA group (fully adjusted HR, 3.07; 95% CI 1.32 to 7.15) or the negative group (fully adjusted HR, 3.84; 95% CI 1.17 to 12.62). Besides, both tables showed that all-cause mortality was associated with increasing age and decreasing BMI in the fully adjusted models. In addition, when we used the backwards stepwise elimination procedure in statistical analysis, it can be found that patients with bronchiectasis who have longer duration of symptoms (fully adjusted HR, 1.03; 95% CI 1.01 to 1.04) and lower FEV1% of predicted (%) (fully adjusted HR, 0.99; 95% CI 0.98 to 1.00) would suffer more mortality (online Supplementary table S1). Moreover, high mMRC scores (fully adjusted HR, 1.15; 95% CI 1.01 to 1.30) and lower FEV1% of predicted (%) (fully adjusted HR, 0.99; 95% CI 0.98 to 1.00) were associated with more deaths among the patients with PA or negative PA (online Supplementary table S2).
Supplementary file 1
Variables associated with all-cause mortality among all patients in a Cox proportional hazard regression model
Variables associated with all-cause mortality among the patients with PA or negative in a Cox proportional hazard regression model
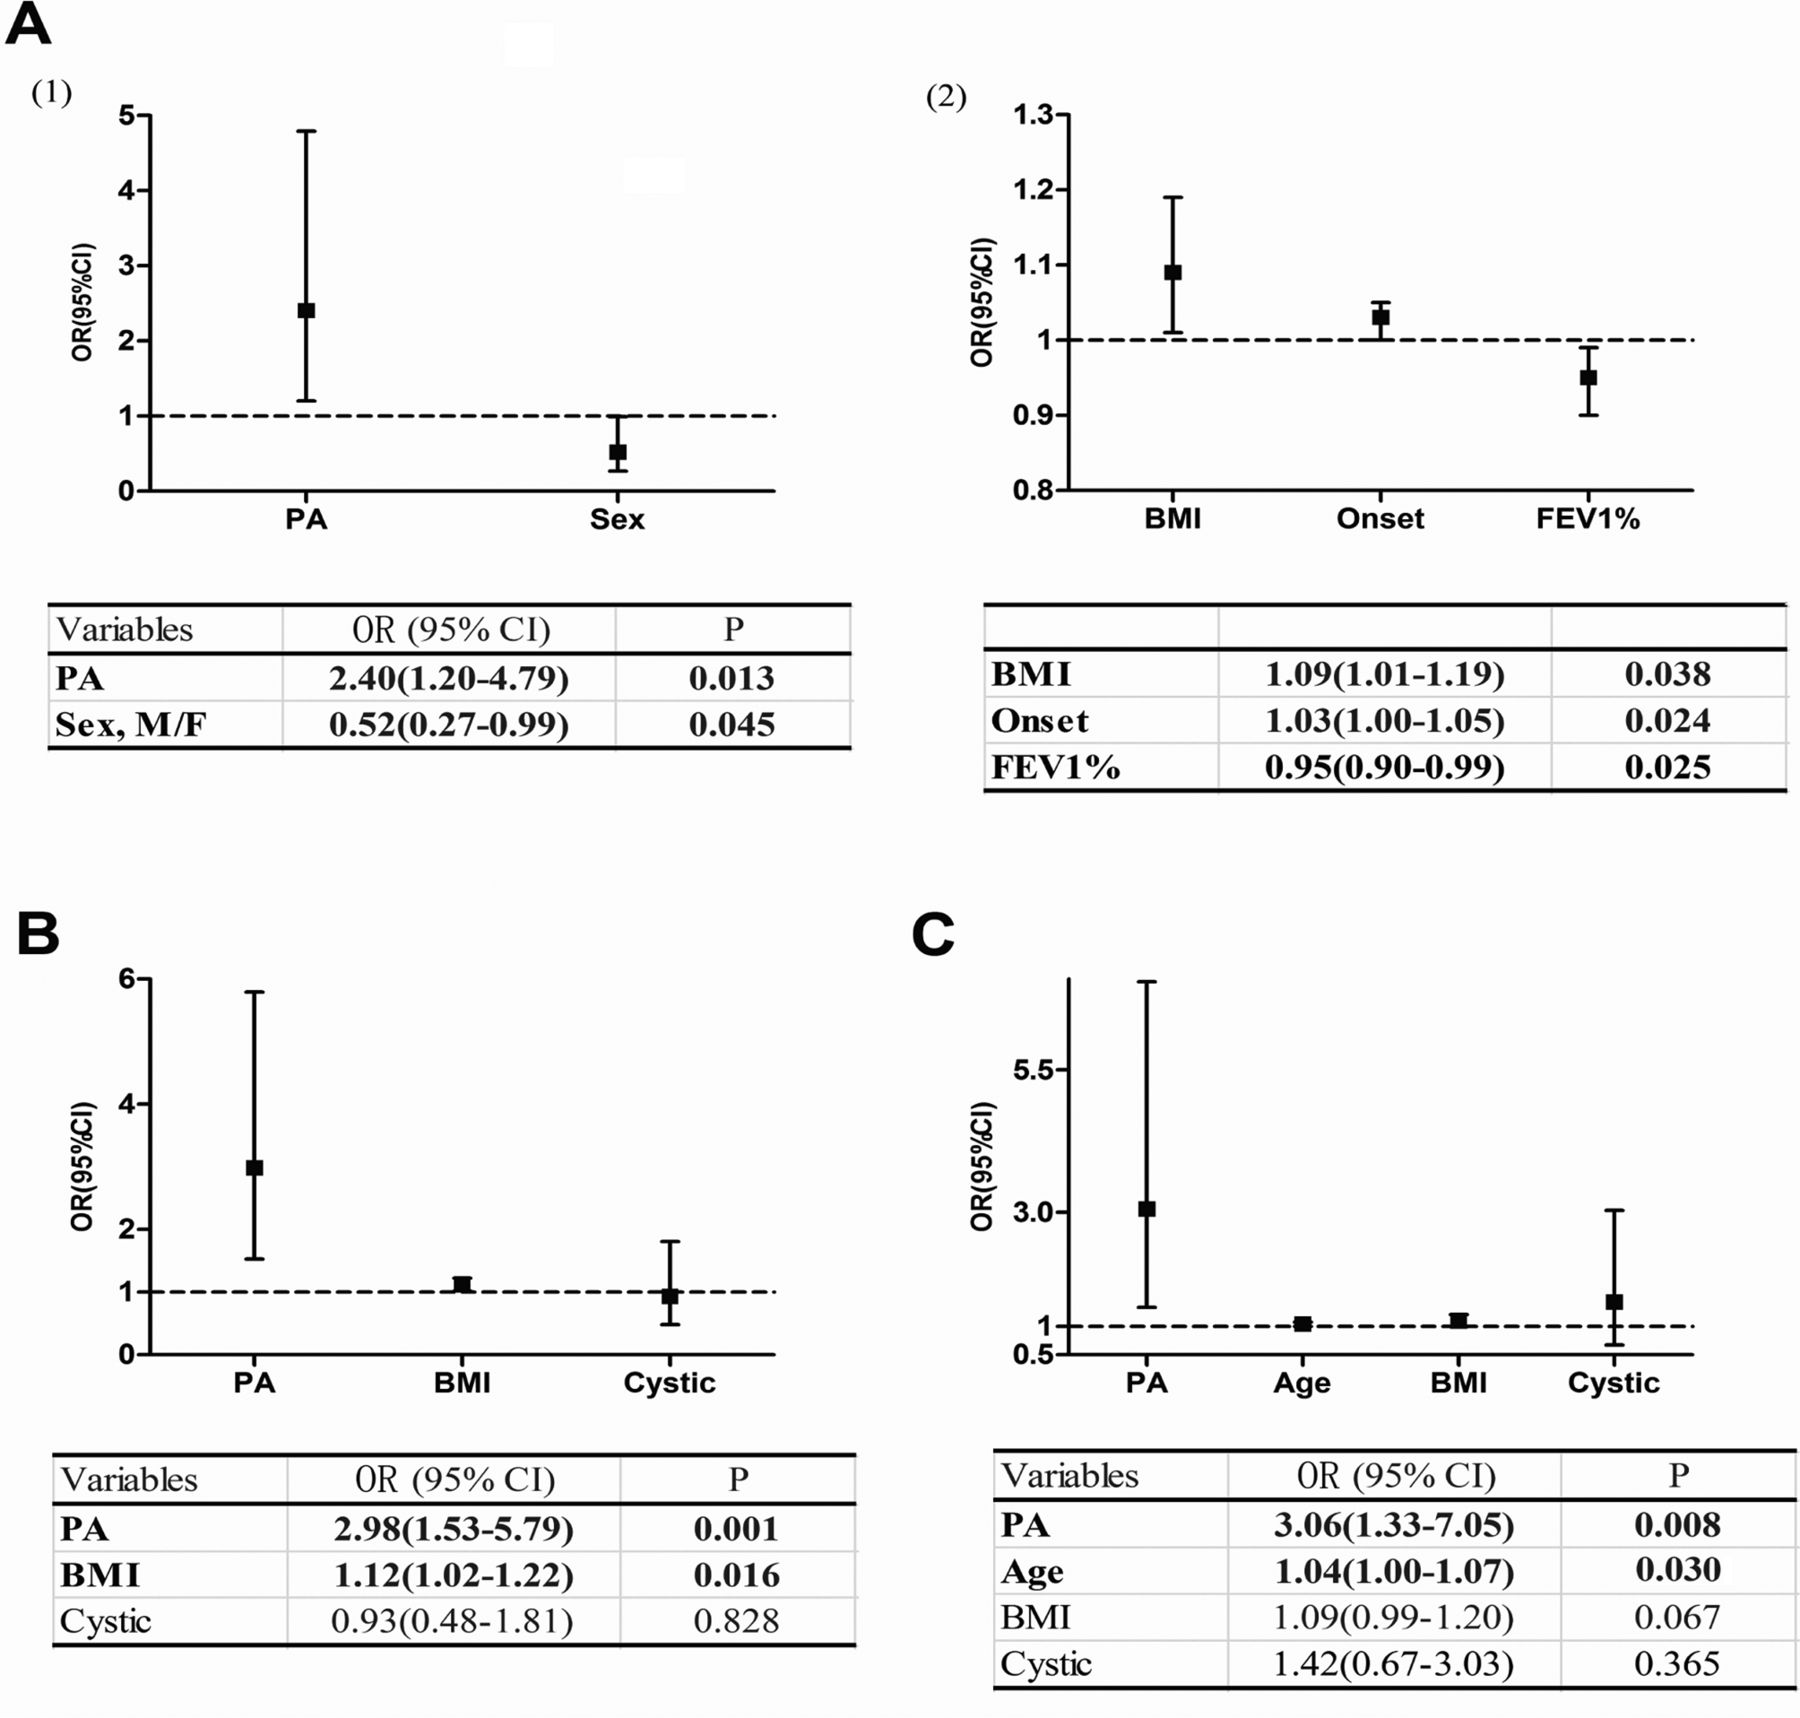
Some variables were found to be independently associated with the incidence of high rates of exacerbations among all patients, as shown in figure 3A: isolation of P. aeruginosa (OR, 2.40; 95% CI 1.20 to 4.79), sex (OR, 0.52; 95% CI 0.27 to 0.99), BMI (OR, 1.09; 95% CI 1.01 to 1.19), onset of symptoms (OR, 1.03; 95% CI 1.00 to 1.05) and FEV1% (OR, 0.95; 95% CI 0.90 to 0.99). In our subgroup analysis, the detection of P. aeruginosa was also a risk factor for high rates of exacerbations in groups with P. aeruginosa or other pathogens (OR, 2.98; 95% CI 1.53 to 5.79) and in groups with P. aeruginosa or negative (OR, 3.06; 95% CI 1.33 to 7.05) (figure 3B, C).
Variables associated with high rates of exacerbations in a logistic regression model: (A) among all the patients, (B) among the patients in the PA or others group and (C) among patients in the PA or negative group.) BMI, body mass index; FEV1, forced expiratory volume in 1s; PA, Pseudomonas aeruginosa.
Discussion
Our study found that P. aeruginosa was present in the sputum or BALF samples of 19.5% of patients with bronchiectasis, which is a finding that is similar to previous reports.10 20 21 In contrast to previous findings,3 10 20–23 our study found P. aeruginosa to be the most common pathogen (43.3%) among positive specimens (in which we found pathogens from sputum or bronchoalveolar). This disparity could be attributed to the differences in microbial distribution between different countries.24 Moreover, our study found Mycobacterium tuberculosis to be present at a high prevalence of infection. Given our findings, the management of P. aeruginosa and the accurate assessment of its prognostic impact should be considered important in bronchiectasis treatment.
In our study, patients in the PA group had poorer lung function when compared with the non-PA group in terms of FEV1% (55.3% vs 75.4%, p<0.001), FVC% (74.2% vs 85.6%, p<0.001) and FEV1/FVC (75.6% vs 88.3%, p<0.001). Davies et al have suggested that infection by P. aeruginosa occurs in patients with bronchiectasis with more severe pulmonary function impairment, but it does not itself influence the rate of pulmonary function decline either before or after adjustment for baseline disease severity.6 However, another study of 76 patients with bronchiectasis with 2 years of follow-up found chronic P. aeruginosa colonisation to be an independent factor associated with an accelerated decline in lung function.7 These disparities indicate that further validation from relevant large-scale studies is needed.
A recent review of 21 observational cohort studies by Finch et al showed that P. aeruginosa is associated with consistent and significant increases in all markers of disease severity, including mortality, hospitalisations and exacerbations. Patients with P. aeruginosa also had worse quality of life scores (based on St. George’s Respiratory Questionnaire results), lung function and radiological severity compared with uninfected patients.25 In accordance with these results, our fully adjusted analysis found that patients with P. aeruginosa were 3.07 times more likely to die than those without P. aeruginosa. Isolation of P. aeruginosa was also determined to be independently associated with high rates of exacerbations, as well as a lower quality of life as measured by mMRC and LCQ scoring. Thus, the prognostic value of P. aeruginosa isolation suggests the establishment of early treatment programmes to improve the overall prognosis of bronchiectasis.
As shown in figure 2(2B), we found no significant difference in mortality between the PA group and the others group (p=0.414) during the follow-up period. This result diverges from those of previous studies10 26 with several possible contributing factors. Given the difference in pathogen distribution between our sample and those taken from other countries, the distinct microbiology of our others group is likely to have influenced our results. Moreover, we assigned patients to the PA group based on the isolation of P. aeruginosa from sputum or BALF rather than P. aeruginosa colonisation, which is defined as the detection of two positive cultures at least 3 months apart over 12 months. We also excluded patients without sputum data and those whose follow-up duration was insufficient to have statistical significance, which carries some inherent selection bias. On the other hand, our findings showing that being in the PA group was a significant risk factor in high rates of exacerbations compared with being in the others group did match previous findings. More relevant studies are needed to confirm the relationship between patients with P. aeruginosa and patients with other pathogens.
A study by Aliberti et al classified bronchiectasis into four clusters: Pseudomonas, other chronic infection, daily sputum and dry bronchiectasis. There were statistical significances in clinical outcomes between the four groups.26 In agreement with their results, our findings show that patients with P. aeruginosa show greater disease severity, a more relevant inflammatory status, worsened clinical, functional and radiological characteristics, and poorer quality of life and long-term outcomes. A pairwise comparison of our three subgroups (PA, others and negative) also indicates the PA group as having the worst prognosis. Moreover, the present study provides a precise estimate of P. aeruginosa prevalence and prognosis among Chinese patients with bronchiectasis.
Our study has several limitations. It is a single-centre study in a specialised hospital that enrolled a selected population of patients. In addition, we used ‘all-cause mortality’ as an endpoint instead of ‘bronchiectasis related mortality’, which may lead to the overestimation of the influence of P. aeruginosa infection. Besides, we used forward stepwise technique in statistical methods. Although both forward stepwise technique and backwards stepwise elimination consistently showed that the isolation of P. aeruginosa was related to higher mortality. There were also few differences which need to be researched further since none of the methods can completely eliminate the noise predictors. Additionally, there were 26 patients with bronchiectasis isolated with both P. aeruginosa and other organisms. We performed the appropriate statistical analysis and found that there were no significance differences between the patients isolated with P. aeruginosa and the patients with co-infections. This finding may have resulted from the small number of co-infection patients, and more rigorous studies are needed in the future. Furthermore, we were unable to define the PA group as suffering from chronic P. aeruginosa colonisation as the patients in this study came from all over the country, and we were unable to perform subsequent repeated sputum or BALF tests to confirm their state of bacterial colonisation.
In this study, the isolation of P. aeruginosa was related to worsened clinical symptoms, a more relevant inflammatory status, more severe radiographic manifestations, worse lung function and health-related quality life, more exacerbations and higher mortality. Pathogen detection from respiratory tract specimens is a significant indicator of disease prognosis. Large multicentre studies targeting the evaluation of the effect of eradication or long-term suppressive therapy on P. aeruginosa in bronchiectasis treatment are needed in the future.
Acknowledgments
The authors thank Authur Zhang for his critical review of this manuscript.
References
Footnotes
HW, X-BJ and BM contributed equally.
Contributors HW, XBJ, BM and JFX designed the study, collected the data, developed the plan for analysis, analysed the data, drafted and revised the paper. CWL and HWL contributed substantially to the study design, data analysis and the drafting of the manuscript.
Funding This work was supported by the National Science Foundation of China (81670006); Shanghai Leading Talent Program (No. 2016036) and Shanghai Hospital Development Center Program (16CR3036A).
Competing interests None declared.
Patient consent Obtained.
Ethics approval Ethics Committee of Shanghai Pulmonary Hospital (k17-141)
Provenance and peer review Not commissioned; externally peer reviewed.
Data sharing statement No additional data available.