Article Text

Abstract
Objectives To provide an up-to-date overview of long-term trends of liver cancer mortality and evaluate the effects attributable to age, period and cohort in Chinese population stratified by gender and urban/rural areas.
Methods Population and liver cancer mortality data were obtained based on the Disease Surveillance Points in China from 1991 to 2014. To examine the time trends of liver cancer mortality by gender in urban and rural areas in China, Joinpoint analysis was used to estimate the annual per cent change. The intrinsic estimator, a method of age-period-cohort analysis to estimate age, period and cohort effects simultaneously, was used to analyse the underlying mechanisms for liver cancer mortality trends in the aforementioned four groups.
Results We observed a significant decline in liver cancer mortality for urban men (average annual per cent change (AAPC)=−1.1%, P<0.05) and urban women (AAPC=−1.4%, P<0.05), while the liver cancer mortality remained stable for rural men (AAPC=−0.1%, P>0.05) and rural women (AAPC=−0.9%, P>0.05). Compared with the 15–19 age group, the liver cancer mortality risk of the 85 and above age group increased 65 and 42 times for urban and rural men, and 102 and 70 times for urban and rural women. From the 1990–1994 period to the 2005–2009 period, the risk increased 56% and 92% for urban and rural men, and 30% and 74% for urban and rural women. Compared with period and cohort effects, age effects were the most influential factor in liver cancer mortality.
Conclusions As the status of ageing population in China gets worse, the burden caused by liver cancer mortality could still be a great challenge for China in the future. The disparity of liver cancer mortality trends between urban and rural residents can be attributed to period effects, referring to the unequal medical levels and resources between urban and rural areas.
- liver cancer
- time trends
- age-period-cohort analysis
This is an Open Access article distributed in accordance with the Creative Commons Attribution Non Commercial (CC BY-NC 4.0) license, which permits others to distribute, remix, adapt, build upon this work non-commercially, and license their derivative works on different terms, provided the original work is properly cited and the use is non-commercial. See: http://creativecommons.org/licenses/by-nc/4.0/
Statistics from Altmetric.com
Strengths and limitations of this study
The population and mortality data used in this study derived from Disease Surveillance Points (DSPs), a nationally representative as well as population-based surveillance system in China.
Not just the examination of time trends, age-period-cohort analysis was also used to distinguish the underlying mechanisms of the observed liver mortality trends.
The DSPs from 1991 to 2014 went through several changes, including changes in surveillance points, the expanded surveillance population, and the methods of mortality data collection, which may result in fluctuations in mortality data, and may also result in biased estimation of age, period and cohort effects.
The mortality data in 2013 and 2014 were not adjusted by under-reporting rates due to data availability, which may result in the underestimation of liver cancer mortality rates.
The age-period-cohort analysis could only remind us the underlying mechanisms of observed trends, rather than the quantitative assessment of the preventions related to liver cancer mortality.
Introduction
Liver cancer is the sixth most common occurring cancer and the second most common cause of death from cancer worldwide.1 China, accounting for more than 50% of the newly diagnosed liver cancer cases and deaths in the world, is still facing the great challenge of disease burden caused by liver cancer.1
Several studies have shown that the age-standardised liver cancer mortality in China has declined in recent years for both genders.2–4 The falls in mortality of liver cancer may be explained by the improvements in modified risk factors, surveillance and treatments. Over 90% primary liver cancer cases in China are hepatocellular carcinoma.5 The risk factors contributing to the development of liver cancer include hepatitis B virus (HBV) infection, hepatitis C virus (HCV) infection, aflatoxins, alcohol drinking and tobacco use, among others. HBV accounts for up to 80% of liver cancer in China.5 6 During the past few decades, China has attached great importance and endeavour to prevent HBV infection through the implementation of hepatitis B vaccination programme in newborns. The programme had been proven to be effective in reducing the prevalence of HBV infection among children.7 Yet the prevalence of HBV infection in adults still remained high.7 According to estimates, there still exist 93 million HBV carriers in China, including 30 million chronic hepatitis B (CHB), who are still at high risk for developing cirrhosis and liver cancer.8 However, the emergence of antiviral therapy since the 1990s and the increase of antiviral usage made it possible for patients with CHB to delay the occurence of liver cancer.9 Apart from the efforts to control HBV infection, the government has also made other significant efforts to control other risk factors of liver cancer, such as the shift of staple food from maize to rice to avoid aflatoxins intake, and the mandatory HCV screening for blood donors to control HCV infection. Also, the application of ultrasonography combined with serum alpha-fetoprotein (AFP) for screening in high-risk population and the development of surgical, locoregional and systematic treatments can have an effect on decreasing liver cancer mortality. However, the underlying mechanisms of the observed time trends remained unclear.
Age-period-cohort (APC) analysis is a useful instrument to split the temporal variations into the components of age, period and cohort. Thus, we can illuminate the underlying mechanisms responsible for the mortality trends, and it has already been applied to the liver cancer mortality data in the USA, Japan, Korea and Taiwan.10–14 Period effects reflect a complex set of historical events and factors, changing the lives of all individuals at a point in time.15 Cohort effects reflect the diverse exposures to socioeconomic, behavioural and environmental risk factors among different birth cohorts, which experienced different historical and social conditions at various stages of their life course.15
In China, there exists a significant disparity of liver cancer mortality between genders and between urban and rural residents, so gender-specific and area-specific analyses are critical for viewing trends and associations in liver cancer mortality. The aim of this study was to investigate temporal trends of liver cancer mortality rates by gender in urban and rural areas in China from 1991 to 2014, and potential age, period and cohort effects.
Materials and methods
Data sources
To explore temporal trends of liver cancer mortality during the past two decades, we extracted the age, gender and area-specific (urban, rural) mortality rates from the series of annual reports of Disease Surveillance Points (DSP) system in 1991–2014 in China. DSP, which was designed primarily to collect data on births, causes of death and the incidence of infectious diseases, was established in 1990 and covered a nationally representative 10 million population from 145 locations through multistage stratified cluster sampling.16 In 2004, the system was expanded to 161 sites to cover 70 million population to adapt to the changes of social stratification and demographic structure.16–18 The adjusted DSP expanded to cover the whole district of a city or county, instead of one or two residential district(s) or town(s) at each location. In 2013, the system integrated the Ministry of Health vital registration system, covering 24% of the national population.19 DSP almost stopped working in 2001–2003 due to system adjustment, so the mortality data from 1991 to 2000 and from 2004 to 2014 were used in our study.
The liver cancer deaths were coded using the International Classification of Diseases Ninth Revision (ICD-9: 155) from 1991 to 2000 and ICD-10 (C22).
Mortality rate adjustment
Every 3 years in 1991–2000, 2006–2008 and 2009–2011, ‘capture-mark-recapture’ methods were used to estimate under-reporting, and mortality rates were adjusted accordingly.16 20 21 The surveillance data in 2004–2005 were obtained through the third national retrospective sampling survey of death causes and no adjustment by under-reporting was done.22 The under-reporting death rate in 2012 was not available. We used the under-reporting death rate in 2011 as a substitute to adjust the surveillance data in 2012 because the surveillance method and the population covered by the DSP in 2012 were the same as those in 2011. But the surveillance system has undergone tremendous changes in 2013–2014, and the under-reporting rates for these 2 years were not available in this study. Therefore, no adjustment by under-reporting was done in 2013 and 2014.
Joinpoint analysis
Age-specific numbers of liver cancer deaths and population by eighteen 5-year interval age groups were calculated. Age-standardised mortality rates (ASMRs) were calculated using the 2010 national census population as the standard. Temporal trends in liver cancer mortality rates from 1991 to 2014 were examined by applying Joinpoint models to the log-transformed ASMRs.23 The models were constrained to a maximum of three Joinpoints, making sure the results are believable. The estimated annual percentage change (EAPC) and average annual per cent change (AAPC) were used to depict the trends, and the Z test was used to assess whether the EAPC or AAPC was statistically different from zero at alpha=0.05.
APC model
Ages were truncated and divided into fifteen 5-year groups (15–19, 20–24,…, 80–84, 85–). The young age groups, less than 15, were excluded because the liver cancer mortalities at these ages were pretty low. Years of death were evenly categorised into five 5-year calendar periods (1990–1994, 1995–1999, 2000–2004, 2005–2009, 2010–2014). Since the data of liver cancer mortality in 1990, 2001, 2002 and 2003 were not available, the remaining years’ surveillance data will be used to calculate the corresponding period’s average mortality rates. For example, the surveillance data from 1991 to 1994 were used to calculate the average mortality rate in the 1990–1994 period. By subtracting age from the period, nineteen 10-year overlapping birth cohorts were obtained. In order to solve the overlapping problem, midpoints of each birth cohort band were selected to yield 19 new groups (1905, 1910, 1915…1990, 1995).
The conventional APC model can be essentially written in linear regression form as the following:
 (1)
(1)
In this model,  denotes the expected death rate of the i-th age group in the j-th year (k-th birth cohort);
  denotes the expected number of deaths and is assumed to be distributed as a Poisson variate;
  denotes the number of population at risk;
μ
denotes the intercept or adjusted mean;
denotes the number of population at risk;
μ
denotes the intercept or adjusted mean;  denotes the effect of the i-th age group (i=1,……,a);
  denotes the effect of the j-th year (j=1,……,p); and
  denotes the effect of k-th birth cohort (k=1,……,c), where c=a+p-1.24
Considering a challenging problem of the linear dependency of age, period and cohort (cohort=period – age or C=P–A) in APC analysis, we first estimated the reduced factor models (ie, A, AP and AC effects models). Then, we selected the intrinsic estimator (IE) model for full APC model analysis, which can yield stable estimates of disease trend by age, period and cohort, without being influenced by the prior assumptions.25 At last, goodness-of-fit statistics were calculated, and Akaike’s information criteria and Bayesian information criteria were used to select the best-fitting models for four groups of liver cancer mortality data. The IE models produced coefficients of the effects of age, period and cohort. The exponential of the coefficients is the relative risk (RR) of a particular age, period or birth cohort relative to the reference category, and the reference group is defined as the mean effect of all ages, periods or cohorts combined correspondingly.
Statistical analyses were performed using Joinpoint regression program V.4.2.0.2 (June 2015) for Joinpoint analysis, SAS V.9.3 for goodness of fit of APC model assessment and STATA V.12.0 for the APC model using the IE method.26
Results
Temporal trends
Table 1 shows the results of the Joinpoint regression analysis. During the whole time period from 1991 to 2014, the liver cancer mortality showed a significant decline in the urban area for both genders while it remained stable in the rural area. First increasing and then decreasing mortality trends were observed in all four groups. However, the turning point in rural men was 3 years later than the urban. For the increasing segment, the rate for rural men appeared to increase faster than for urban men. For the decreasing segment, the rate for rural men declined more sharply than for urban men. An identical situation existed in women, except that the mortality for urban women rose insignificantly. Even though the rural residents showed a faster declining trend in recent years, the mortality rate was still much higher in rural areas than in urban areas (see online supplementary table S1).
Supplementary file 1
Trends in liver cancer mortality rates (age-standardised to 2010 national census population) by gender and areas in China, 1991–2014
Descriptive analysis
Figure 1 shows the age-specific mortality rates in different periods among Chinese population stratified by gender and areas, respectively. For each time period, the liver cancer mortality was low and rather stable at early ages both in men and women, then kept an exponential growth in mid-life, and at last decelerated or levelled off at older ages. The rapid growth started almost 10 years earlier in men than in women. Taking the time trends into consideration, it was obvious that the curves of age-specific mortality rates were quite similar and almost overlapped in different periods before 50 years old, and then started to disperse in old ages. The non-parallelism among age patterns by time period in liver cancer mortality rates among four groups suggested the existence of cohort effects.

Age-specific rates of liver cancer mortality in Chinese population stratified by gender and areas by time period, 1990–2014.
Figure 2 presents the age-specific mortality rates of liver cancer across birth cohorts. For the same age group, the mortality rates showed an increasing trend in early birth cohorts while a decreasing trend in recent birth cohorts. Further analysis showed that the decreasing trend arose earlier in the urban birth cohorts than in the rural birth cohorts. The non-parallelism among age patterns by birth cohort indicated the existence of period effects underlying the data.

Age-specific rates of liver cancer mortality in Chinese population stratified by gender and areas by birth cohort, 1990–2014.
APC analysis
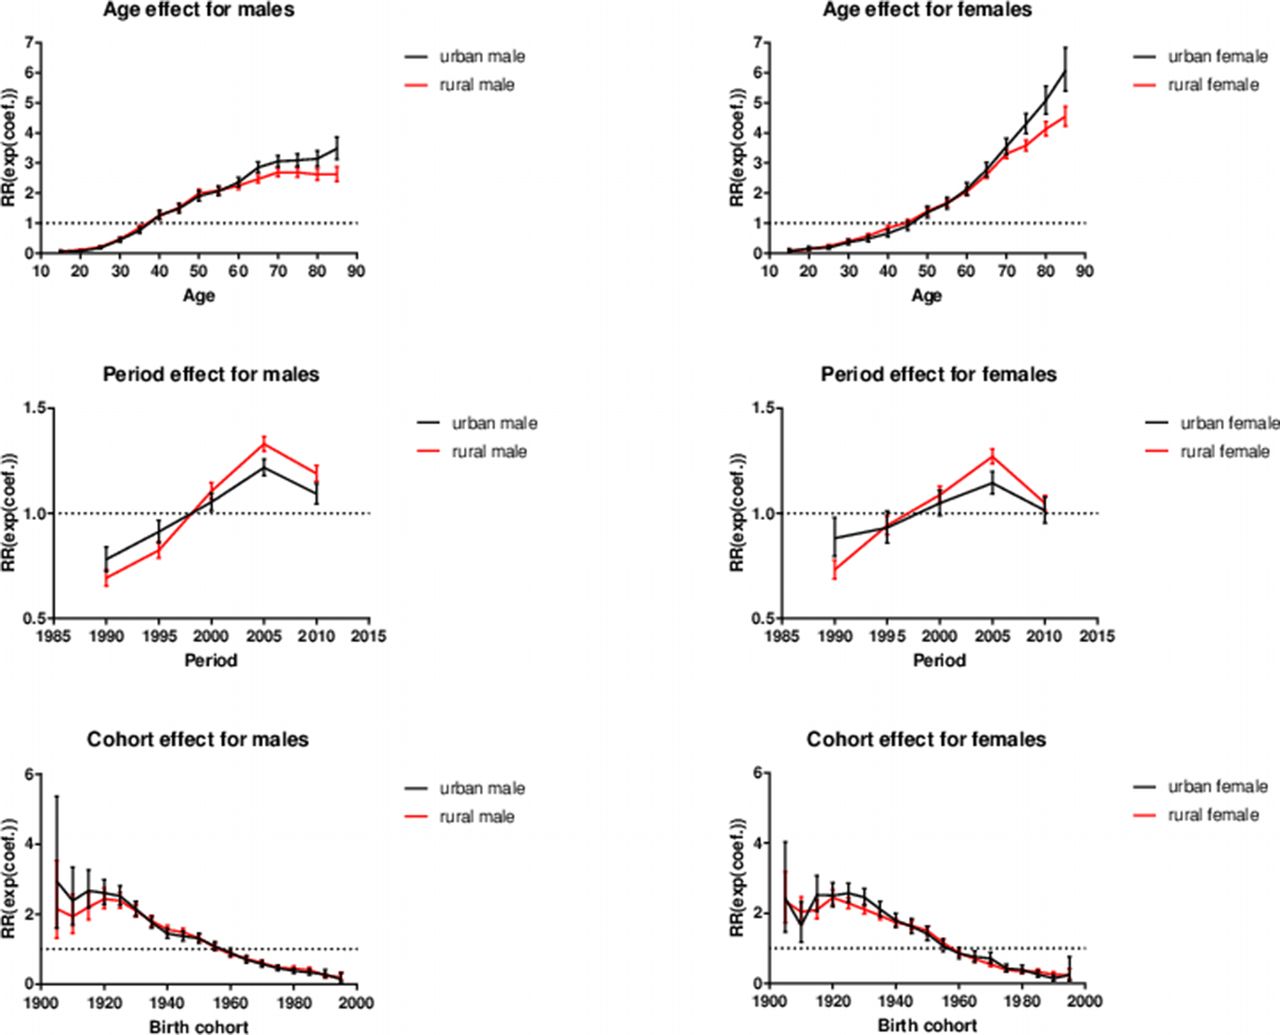
The comparison of model fit suggested that the full APC models using IE estimation fit the data best for the four groups of Chinese population (table 2). The effects of age, period and cohort are shown in figure 3.
The exponential coefficients of intrinsic estimator with 95% CIs for age, period and birth cohorts for liver cancer mortality in Chinese population stratified by gender (male on the left and female on the right) and area. RR, relative risk.
Goodness-of-fit statistics for APC models of liver cancer mortality rates in Chinese population by gender and areas
Age effect
For both genders, the risk of liver cancer mortality increased with age, especially for women. The age effect essentially showed an ‘S’ shape for men and a ‘J’ shape for women. Compared with the mean effect of all ages, the liver cancer mortality risk was quite low for the young people and kept increasing in middle life, while in old age it turned out to be continually going up in women and levelling off in men. For urban and rural men, the risk of liver cancer mortality in the 85 and above age group was about 65 ( ) times and 42 (
 ) times higher than that of the 15–19 age group for urban and rural men, respectively. When it came to urban and rural women, it was about 102 (
 ) and 70 (
 ) times higher compared with the 15–19 age group for urban and rural women.
Period effect
The RR increased for the period from 1990–1994 to 2005–2009 in each group of the stratified Chinese population by gender and area, then an obvious decline from 2005–2009 to 2010–2014. However, there existed great differences between urban and rural residents for both genders. From the increasing segments, the curves of the RR showed a relatively mild increasing trend for urban residents, compared with the rural residents. To be specific, compared with 1990–1994, the liver cancer mortality risk had increased by 56% ( ) and 92% (
 ) for urban and rural men in 2005–2009. For urban and rural women, it was 30% (
 ) and 74% (
 ), respectively. Subsequently, in 2010–2014, the liver cancer mortality risk has decreased by 10% for urban men (
 ) and 11% for rural men (
 ), as well as 12% (
 ) and 18% (
 ) for urban and rural women, compared with 2005–2009.
Cohort effect
The curves of cohort effects all showed an overall downtrend and almost overlapped between urban and rural residents for both genders. For urban and rural men, the most notable peak occurred in 1905 and 1920 birth cohort, respectively. For urban and rural women, the peak occurred in 1925 and 1920 birth cohort. The mortality risk fluctuated from 1905 birth cohort to 1925 birth cohort and then kept decreasing. Compared with the earliest birth cohort, the liver cancer mortality risks for the youngest birth cohorts had declined by 95% ( ) and 91% (
 ) for urban and rural men, and 90% (
 ) and 90% (
 ) for urban and rural women, respectively. Although the peak mortality risks for different groups varied, the curves converged afterwards for all groups.
Discussions
In this study, we found that the age-standardised liver cancer mortality in China has declined in recent years in the Joinpoint analysis. The declining trends emerged 2 or 3 years earlier for urban residents than for rural residents for women and men, respectively. Then, APC analysis gave us a better understanding of the age, period and cohort effects on the time trends we observed.
Age effects were the most influential factor in liver cancer mortality. The mortality risk kept growing all the way up with age. As the status of ageing population in China gets worse, the burden caused by liver cancer mortality would still be a great challenge for China in the future. Zhao et al 27 had also shown that the ageing population played an important role in the time trends of liver cancer mortality in China.
Period effects reflect a complex set of historical events and factors that change the lives of all individuals at a point in time. In terms of liver cancer mortality, the period effects indicated the changes in survival rate and incidence. However, there is still no effective treatment and survivorship was still poor for liver cancer in China.28 Thus, the trends of period effects were mainly affected by the incidence. Since the 1990s, the application of AFP combined with ultrasound has improved the early detection of liver cancer,29 and since 2005, when China published the first CHB prevention guidelines, the usage of antiviral therapy for CHB began increasing and the antiviral therapy had been proven effective in delaying the occurrence of liver cancer.9 Therefore, the period effects showed first an increasing and then decreasing trend. Even though the aforementioned four groups of Chinese population all showed first an increasing and then decreasing trend, the liver cancer mortality risk increased more for rural residents than that for the urban residents, for both genders. The disparity may be related to the unequal medical levels and resources between urban and rural areas. It has been reported that the 5 years observed and also the relative survival rates in urban residents were over two times higher than that of rural residents for both genders.28
The existence of cohort effect reflects the diverse exposures to socioeconomic, behavioural and environmental risk factors among different birth cohorts, which experienced different historical and social conditions at various stages of their life course.15 According to the result of APC analysis, the cohort effects were quite similar in the four groups of Chinese population, which may indicate that the urban and rural residents shared some similar exposures in early lifetime and that the aetiology for liver cancer was quite similar. The exposures related to liver cancer in China mainly referred to HBV, HCV and aflatoxins. The HBV vaccination should play an important role in decreasing the liver cancer mortality risk in birth cohorts after 1990. Although we have observed lower mortality risk in birth cohorts after 1990, the mortality risk actually had already declined since 1920 birth cohort in four groups, which reflected that some other factors, other than HBV vaccination, may have made a contribution to the decline of cohort effects. APC analysis of HCC mortality in Taiwan had also found that the cohort effects had declined before the application of HBV vaccination, which may have a relationship with the removal of aflatoxin.14 Aflatoxin is also a major risk factor of liver cancer in China, and China has taken effective measures to remove the intake of aflatoxins in diet, especially in high endemic areas.30 Except the aflatoxins, the overall medical standard has significantly improved gradually, and cohorts born later had better chance of access to a better medical healthcare. For instance, the application of disposable syringe in the 1980s could reduce the hospital-acquired hepatitis virus infection, and the mandatory HBV and HCV screening for blood donors can also enhance the safety of blood transfusion. Therefore, cohorts born later had less chance of being exposed to food contaminated by aflatoxins and less possibility of acquiring HBV or HCV through medical care.
Compared with period and cohort effects, age effects were the most influential factor in liver cancer mortality. As the status of ageing population in China gets worse, the burden caused by liver cancer mortality could still be a great challenge in the future. The disparity of liver cancer mortality trends between urban and rural residents can be attributed to period effects, mainly referring to the unequal medical levels and resources between urban and rural areas. It is essential to improve the medical level and medical resources in rural areas, such as a higher reimbursement of antivirus treatment for patients with CHB, the implementation of annual liver cancer surveillance as well as the upgrade of treatment quality in rural areas.
Acknowledgments
We would like to acknowledge Professor Gonghuan Yang and Xia Wan at the Institute of Basic Medical Sciences of the Chinese Academy of Medical Sciences, School of Basic Medicine Peking Union Medical College, for advice on data processing.
References
Footnotes
Contributors LW and YS initiated the study. YS, ML, KC, XZ, YZ, YL and SL collected the data. YS and ML processed the data. YS performed the statistical analysis. LW and YS drafted the manuscript. LW and YW revised the manuscript. All authors read and approved the final manuscript.
Funding This work was supported by CAMS Innovation Fund for Medical Sciences (CIFMS) (2016-I2M-3-001), Special Fund for Health-Scientific Research in the Public Interest (201502005) and the National Infectious Disease Major Projects in China (2017ZX10105005-004-003).
Competing interests None declared.
Patient consent Not required.
Ethics approval Ethical approval and informed consent were not necessary because all data analysed were previously published and deidentified.
Provenance and peer review Not commissioned; externally peer reviewed.
Data sharing statement No additional data are available.