Article Text

Abstract
Objective Clinicians often overestimate the probability of a disease given a positive test result (positive predictive value; PPV) and the probability of no disease given a negative test result (negative predictive value; NPV). The purpose of this study was to investigate whether experiencing simulated patient cases (ie, an ‘experience format’) would promote more accurate PPV and NPV estimates compared with a numerical format.
Design Participants were presented with information about three diagnostic tests for the same fictitious disease and were asked to estimate the PPV and NPV of each test. Tests varied with respect to sensitivity and specificity. Information about each test was presented once in the numerical format and once in the experience format. The study used a 2 (format: numerical vs experience) × 3 (diagnostic test: gold standard vs low sensitivity vs low specificity) within-subjects design.
Setting The study was completed online, via Qualtrics (Provo, Utah, USA).
Participants 50 physicians (12 clinicians and 38 residents) from the Department of Family and Community Medicine at St Michael’s Hospital in Toronto, Canada, completed the study. All participants had completed at least 1 year of residency.
Results Estimation accuracy was quantified by the mean absolute error (MAE; absolute difference between estimate and true predictive value). PPV estimation errors were larger in the numerical format (MAE=32.6%, 95% CI 26.8% to 38.4%) compared with the experience format (MAE=15.9%, 95% CI 11.8% to 20.0%, d=0.697, P<0.001). Likewise, NPV estimation errors were larger in the numerical format (MAE=24.4%, 95% CI 14.5% to 34.3%) than in the experience format (MAE=11.0%, 95% CI 6.5% to 15.5%, d=0.303, P=0.015).
Conclusions Exposure to simulated patient cases promotes accurate estimation of predictive values in clinicians. This finding carries implications for diagnostic training and practice.
- diagnostic inference
- experience-based learning
- ppv
- npv
- estimate accuracy
This is an Open Access article distributed in accordance with the Creative Commons Attribution Non Commercial (CC BY-NC 4.0) license, which permits others to distribute, remix, adapt, build upon this work non-commercially, and license their derivative works on different terms, provided the original work is properly cited and the use is non-commercial. See: http://creativecommons.org/licenses/by-nc/4.0/
Statistics from Altmetric.com
Strengths and limitations of this study
The use of fictitious diseases and diagnostic tests provided information about performance that was not biased by participants’ prior knowledge about real diseases and tests.
Three separate diagnostic tests that varied in sensitivity and specificity were presented in each format, within subjects, in order to show the robustness of the format effect.
All participants were recruited from the Department of Community and Family Medicine at St Michael’s Hospital in Toronto, Canada. Future studies should replicate this research in other settings and with other populations.
The study was conducted online, which may affect the ecological validity of the results.
Probabilistic reasoning is central to medical diagnosis.1–4 Calculating or estimating the probability of a disease given a positive test result (positive predictive value; PPV) or the probability of no disease given a negative test result (negative predictive value; NPV) is notoriously difficult for clinicians, although commonly required for diagnostic inference.5–7 Specifically, clinicians have difficulty understanding and applying test accuracy evidence to pretest odds of disease.5–10 Systematic errors include overestimation of the PPV and the NPV,5–10 which may have negative effects on patient care. Overestimation of the PPV, for example, may increase the risk of overtreatment such as unnecessary surgery or chemotherapy.11 12
The accuracy of probabilistic inference has been shown to be sensitive to the format in which relevant statistics are presented.13–20 The distinction between numerical and experience formats is most critical in the current context. In numerical formats, PPV and NPV estimates are based on numerical summaries of disease prevalence, test sensitivity (ie, the proportion of patients with the disease who receive a positive test result9) and test specificity (ie, the proportion of patients without the disease who receive a negative test result9) or false-positive rates.5–8 14–20 In so-called experience formats, in contrast, decision-makers accrue information about the prevalence of disease and test reliability through exposure to representative patient cases whose true disease status and test outcome are revealed.21–25 Thus, rather than manipulating statistical information to arrive at PPV and NPV estimates, decision-makers must rely on their memory for previously experienced patient scenarios (ie, true and false, positives and negatives) when estimating predictive values.
A series of studies suggests that experience formats may be superior to numerical formats in non-experts. An experience format led to greater sensitivity to the prevalence of genetic disease in unborn children, as well as a decreased subjective sense of worry about the disease.21 In another study, an experience format increased patients’ knowledge of the risks and benefits of lung cancer screening.22 We recently showed that both younger and older adults, regardless of numeracy skills, were more successful at estimating PPVs and NPVs for fictitious diagnostic tests when information was presented in an experience format, compared with when it was presented in a numerical format.23 Similar findings were reported in a study comparing PPV estimates for a Down syndrome screening.24
In summary, there is strong evidence suggesting an advantage of experience over numerical formats in the context of diagnostic inference. However, no study to date has tested this effect in clinicians. In the current study, we sought to test whether the experience advantage would extend to clinicians. We predicted that, similar to laypeople, clinicians would provide more accurate estimates of the PPV and NPV after being exposed to relevant information in an experience format, compared with a numerical format. To test the robustness of the format effect, participants provided estimates of the PPV and NPV for three different fictitious diagnostic tests that differed in sensitivity and specificity.
Methods
Fifty clinicians affiliated with the Department of Community and Family Medicine from St Michael’s Hospital in Toronto, Canada, provided informed consent before completing a 1-hour online experiment via Qualtrics (Provo, Utah, USA), in which they received information about a fictitious disease and three separate fictitious diagnostic tests.
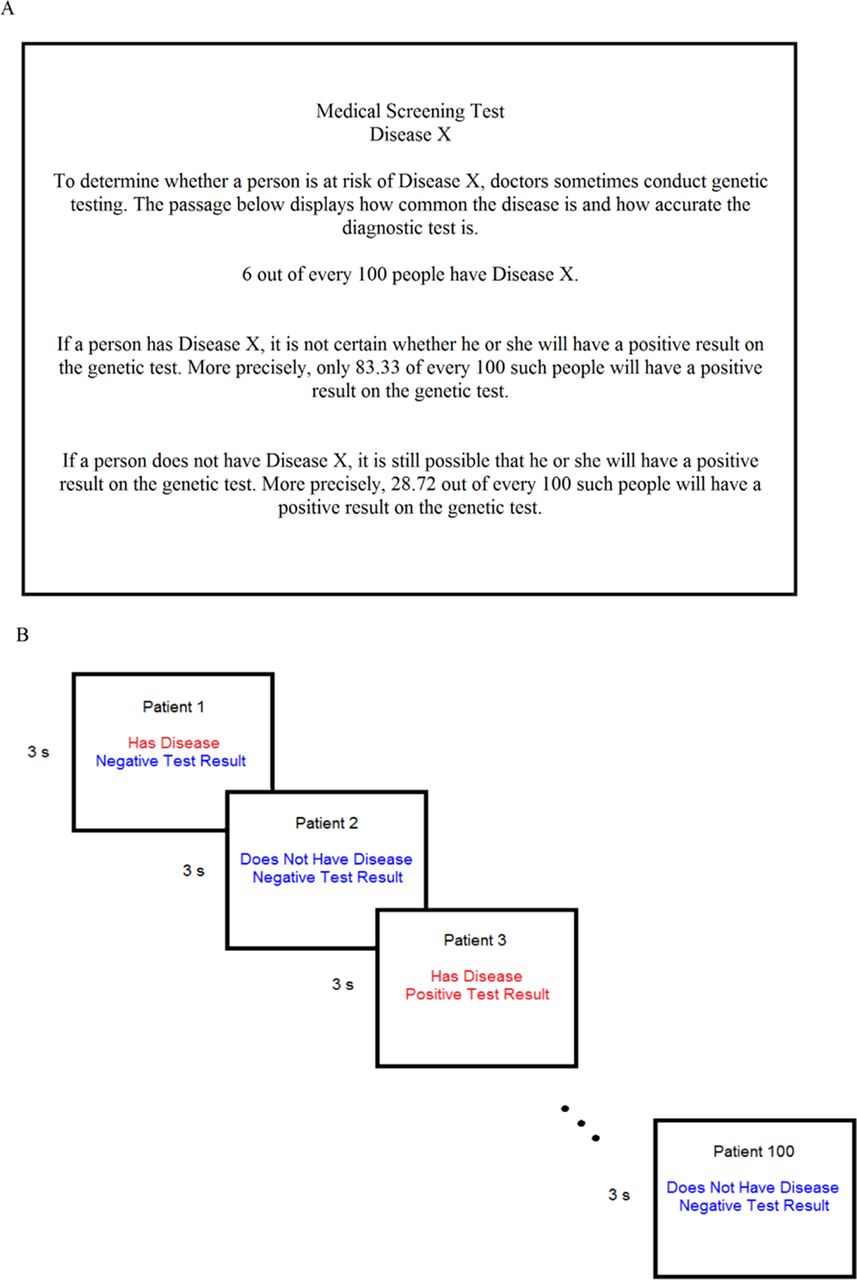
Information about each of the three tests was provided in a numerical format and an experience format. The numerical format was based on prior literature5–8 14–20 and involved reading a verbal passage describing the prevalence of a disease, as well as the sensitivity and the false-positive rate (ie, 1—specificity) of the diagnostic test. Numerical information was expressed in normalised frequencies, in which the base rate frequency was normalised to 100 (see figure 1A). In the experience format (see figure 1B), participants were presented with a slideshow of 100 representative patient cases. Each patient was characterised by a combination of disease status (does vs does not have the disease) and diagnosis (positive vs negative). The words ‘Has Disease’ and ‘Positive Test Result’ appeared in red, and the words ‘Does Not Have Disease’ and ‘Negative Test Result’ appeared in blue. Therefore, same-colour patient cases indicated a true test result (eg, Has Disease and Positive Test Result), whereas different-colour patient cases indicated false test results (eg, Has Disease and Negative Test Result). Each slide presented a single patient case for 3 s. Participants were instructed not to take notes.

(A) An example of the numerical format. (B) An example of the experience format. The numerical format provides the prevalence of disease, as well as the sensitivity and the false-positive rate of the diagnostic test. In the experience format, 100 representative patient cases were viewed in the slideshow for each of the three tests. Each slide was presented for 3 s, and describes each patient in terms of disease status (ie, has disease or does not have disease) and test result (negative or positive). ‘Has Disease’ and ‘Positive Test Result’ were shown in red font, and ‘Does Not Have Disease’ and ‘Negative Test Result’ were shown in blue font.
In order to test the robustness of the format effect (numerical vs experience) on the accuracy of PPV and NPV estimates, three separate diagnostic tests with varying test characteristics were used. The gold standard test had high sensitivity and high specificity, the low- sensitivity test had low sensitivity but high specificity and the low-specificity test had high sensitivity but low specificity (see table 1 for details). Each participant completed testing for all six combinations of format (numerical vs experience) and test (gold standard vs low sensitivity vs low specificity). Presentation order was counterbalanced, such that half of the participants completed the scenarios in the numerical format first (with test order counterbalanced across participants), followed by the scenarios in the experience format (with test order once again counterbalanced). The other half of participants received the reverse order (experience then numerical). Participants were not told that the three diagnostic tests were identical in both formats.
Test characteristics
In both the numerical and experience formats, information for each test was presented for a total of 3 min before participants were prompted for estimates, specifically ‘how many patients had the disease, out of all patients who received a positive test result’ (PPV) and ‘how many patients did not have the disease, out of all patients who received a negative test result’ (NPV).
PPV and NPV estimates were solicited using a frequency response format in which participants had to fill in both the numerator and the denominator (eg, ‘6 out of 98’). PPV and NPV estimate errors, defined as the absolute difference between true and estimated values, were submitted to separate 2 (format: numerical vs experience) × 3 (test: gold standard vs low sensitivity vs low specificity) repeated-measures analyses of variance. Given the sample size (n=50) and the repeated-measures design, the statistical power to detect medium-sized effects,26 with an alpha of 0.05, was 0.93 for the ‘format’ factor and 0.98 for the ‘test’ factor.27 Statistical analysis was performed using SPSS (Version 22), with alpha set to 0.05.
Results
Thirty-one female and 19 male clinicians completed the online study. The sample included 38 residents and 12 practising clinicians. On average, residents had completed 1.4 years of residency, and practising clinicians had completed 4.3 years of practice.
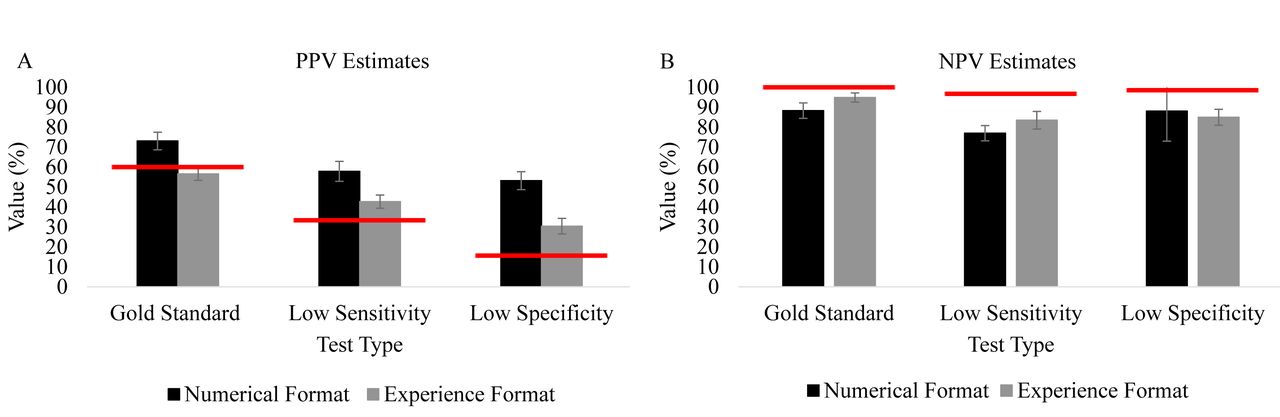
As a measure of task performance, mean absolute estimation errors (MAE) are reported. Low MAE values indicate more accurate estimates.23 We chose MAE over alternative performance measures (eg, percentage of participants with responses close to the true value) because the MAE provides fine-grained information about the distance between estimates and true values. Because MAE does not distinguish between underestimation and overestimation, figure 2 additionally shows the mean raw PPV (panel A) and NPV (panel B) estimates for each experimental condition, as well as the true values. For PPV estimates, errors were larger in the numerical format (MAE=32.6%, 95% CI 26.8% to 38.4%) than in the experience format (MAE=15.9%, 95% CI 11.8% to 20.0%, d=0.697, P<0.001). As seen in figure 2A, the classic overestimation of the PPV was replicated when information was described numerically. In contrast, the extent to which PPVs were overestimated was reduced dramatically when information was experienced. For NPV estimates, the numerical format also produced larger errors (MAE=24.4%, 95% CI 14.5% to 34.3%) compared with the experience format (MAE=11.0%, 95% CI 6.5% to 15.5%, d=0.303, P=0.015), with less underestimation and reduced variability in estimates when information was experienced (figure 2B). For PPV and NPV estimates, the effect of format was stable across the three tests (P=0.54). There was also no effect of presentation order of format (P=0.48) and no statistically significant difference between residents’ and qualified clinicians’ accuracy for either the PPV (P=0.35) or the NPV (P=0.80).

Mean PPV (A) and NPV (B) estimates for each format and test type. The X axis displays the experimental factors (format x test) and Y axis displays mean estimate values. The grey bars represent mean estimates in the experience format. The black bars represent mean estimates in the numerical format. The red lines indicate the true PPVs and NPVs. Error bars for each mean represent SEs. PPV, positive predictive value; NPV, negative predictive value .
Discussion
Compared with a numerical format, an experience format in which simulated patient cases were viewed over time produced more accurate PPV and NPV estimates in clinicians. The format effect was replicated across three separate diagnostic tests, demonstrating the robustness of the effect across variations of the problem. Critically, the experience format reduced overestimation of the PPV. Trainees and fully licensed clinicians commonly commit errors when making Bayesian inferences. Most notably, overestimating the PPV5–10 can lead to a variety of negative consequences.11 12 The current study thus adds to a growing literature demonstrating that the format in which decision-relevant information is presented influences predictive value estimates.13–20 More specifically, the current data lends further support to the finding that experience formats boost diagnostic inference relative to numerical formats,21–25 and it extends this finding to a clinician population.
Why does the ‘experience advantage’ occur? While the current study was not designed to address this question, there are several possible explanations. First, the experience format promotes an intuitive estimation strategy, requiring little in the way of statistical knowledge or active manipulation of numerical information. Second, the experience format presented participants with naturally occurring frequencies of the four possible diagnostic scenarios (ie, the absolute number of true positives, false positives, true negatives and false negatives). This is in contrast to the ‘normalised frequencies’ presented in the numerical format. For example, in the numerical format, participants learnt that the sensitivity of one of the tests was 83.33%. This number represents the relative frequency of true positive findings among those with the disease. In contrast, in the experience format, participants encountered five true positives and one true negative in the slideshow of 100 patients, and could subsequently derive subjective natural frequency values based on memory of the patient cases. While both formats convey the same statistical information, the experience format may produce superior predictive value estimates because of its use of naturally occurring frequencies.5 13 16–20 28–30 To what extent the strength of the experience format is due to the ‘slideshow’ method that encourages intuitive responses, or from the use of natural as opposed to normalised frequencies, remains to be addressed in future work.
There are both strengths and weaknesses of the current study. A main strength is that we controlled for the potential confound of prior knowledge through the use of fictitious information. Previous research has investigated clinicians’ probability estimates for real diseases and tests.5 7 10 However, knowledge of medical statistics, such as disease prevalence or test sensitivity and specificity, may have influenced clinicians' estimates. Results presented here demonstrate the effect of format on clinicians’ estimate accuracy more cleanly. Another important strength of the study is that participants were shown information for three separate diagnostic tests, varying in sensitivity and specificity, presented in both formats within subjects. The purpose of this design was to demonstrate the stability of the format effect across individuals, as well as different versions of the problem (ie, for reliable and unreliable diagnostic tests that are subject to different types of errors such as false alarms or misses). The findings of the study illustrate the robustness of the format effect. An important limitation of the study is that the sample includes clinicians from one discipline (family and community medicine) from the same hospital, restricting the generalisability of the results. A second limitation is that the study was conducted online, which may affect the ecological validity of the study findings because the experimental setting cannot be fully controlled by experimenters. For example, participants may have had different browser experiences, or distractions in the physical environment. Future studies should test the effect of format on medical experts’ probability estimates in more controlled settings (eg, an in-lab environment).
The current study shows that exposure to simulated patient cases is an effective technique for enhancing experts’ predictive probability estimates without the need for statistical training. Importantly, the experience format significantly reduced the common error of overestimating the PPV relative to the numerical format. Of note, the latter is commonly used in medical education and in real patient cases.1–4 As discussed, more research is needed to shed light on the mechanisms underlying the experience advantage. In particular, it would be important to contrast the experience format with a numerical format in which decision-relevant information is presented in natural, rather than in normalised, frequencies.28–30 Additional avenues for future research include studying the impact of experience formats on clinicians' treatment decisions and other clinical outcomes across a variety of medical disciplines, and examining the viability of these formats for communicating test results to patients.
Acknowledgments
We thank Ryan Marinacci for his help with programming the online study, as well as Taehoon Lee and Anjli Bali for their help recruiting participants.
References
Footnotes
Contributors BA (study guarantor): study design, study programming, participant recruitment, data collection, data analysis and manuscript writing. JS: study design and manuscript writing. NP: study design, study funder, participant recruitment and manuscript writing. All authors had full access to all of the data (including statistical reports and tables) in the study and can take responsibility for the integrity of the data and the accuracy of the data analysis.
Funding This research received no specific grant from any funding agency in the public, commercial or not-for-profit sectors. NP funded the study and is supported by the Department of Family and Community Medicine of St Michael’s Hospital, the Department of Family and Community Medicine of the University of Toronto, an Early Researcher Award from the Ministry of Research and Innovation and the Physicians Services Incorporated Graham Farquharson Knowledge Translation Fellowship.
Disclaimer The funders had no role in the study.
Competing interests None declared.
Patient consent Not required.
Ethics approval Ethics approval to conduct the current study was obtained from both St. Michael’s Hospital Research Ethics Board (REB number: 16-282) and the Ryerson Ethics Board (REB number: 2014-129).
Provenance and peer review Not commissioned; externally peer reviewed.
Data sharing statement No additional data available.