Article Text

Abstract
Objective Previous studies on the relationship between birth weight and obesity in adolescents have mostly been conducted within Western populations and have yielded inconsistent results. We aimed to investigate the association between birth weight, obesity, fat mass and lean mass in Korean adolescents using the fifth Korea National Health and Nutritional Examination Survey (KNHANES V).
Methods The study population consisted of a total of 1304 (693 men and 611 women) participants aged between 12 and 18 years. Adjusted ORs and 95% CIs were calculated by multivariable logistic regression analyses to determine the association between birth weight and being overweight or obese. Furthermore, adjusted mean values for body mass index (BMI), fat mass index (FMI) and lean mass index (LMI) according to birth weight were calculated by multiple linear regression analyses.
Results Individuals within the highest 25th percentile in birth weight were more likely to be overweight (adjusted OR (aOR) 1.75, 95% CI 1.11 to 2.76) compared with adolescents within the 25th and 75th percentile in birth weight. Female adolescents who were in the highest 25th percentile in birth weight were more likely to be obese (aOR 2.13, 95% CI 1.03 to 4.41) compared with those within the 25th and 75th percentile in birth weight. Increasing FMI, but not LMI was associated with increasing birth weight (P for trend: 0.03). This tendency remained only in female population in sex-stratified analysis (P for trend: 0.03).
Conclusions High birth weight may lead to obesity and increased fat mass, but not lean mass. Adolescents born with high birth weight may benefit from close weight monitoring and early intervention against obesity.
- birth weight
- obesity
- body composition
- fat mass
- lean mass
This is an Open Access article distributed in accordance with the Creative Commons Attribution Non Commercial (CC BY-NC 4.0) license, which permits others to distribute, remix, adapt, build upon this work non-commercially, and license their derivative works on different terms, provided the original work is properly cited and the use is non-commercial. See: http://creativecommons.org/licenses/by-nc/4.0/
Statistics from Altmetric.com
Strengths and limitations of this study
The study population of this study consisted of Koreans, an ethnicity few previous studies targeted, and was relatively large (1304 participants), raising the credibility of this study.
We evaluated the effect of birth weight on BMI, and fat mass and lean mass.
Since observational data were used, inferences about causal effects cannot be made clearly and only assumptions about the relationship can be suggested.
Parental factors such as maternal obesity and diabetes that may influence the birth weight of the offspring were not included in the survey. Furthermore, birth weight, which was self-reported in the survey, may be subject to recall bias.
Introduction
Obesity among children and adolescents have increased in prevalence from around 16.5% in 1980 to around 23.0% in 2013 in high-income countries.1 This dramatic increase in obesity is also shown in Korea, with an increase in prevalence of 6.8% in 1998 to around 10.0% in 2005.2 3 Obesity in adolescence is associated with cardiovascular disease and pulmonary disease, and has psychosocial consequences4 that may have long-lasting implications well into adulthood. Therefore, identifying and controlling risk factors of adolescent obesity is imperative in reducing the risk of serious illnesses later in life. Meanwhile, early life events have been suggested to play an important role in developing obesity by altering the body composition and control in appetite.5 Furthermore, as one’s ability to regulate and metabolise nutrients is determined prenatally or postnatally, perinatal factors may be important predictors of obesity.6
Among perinatal factors, birth weight is closely related to intrauterine nutrition7 and early body composition. Several previous studies investigating the relationship between birth weight and obesity in adolescents have yielded inconsistent results. While some studies have shown J-shaped or linear associations between birth weight and body mass index (BMI) in childhood,8–10 other studies have shown no significant relationships between birth weight and BMI.11 In terms of the association between birth weight and body composition, previous studies have shown that birth weight is more closely related to lean mass compared with fat mass in adolescents in the UK,12 13 and in Brazilian children aged 9 years.14 Interestingly, relatively few studies have investigated the association between birth weight and body composition in an Asian population. As there are innate differences in body composition according to ethnicity,15 16 studies determining the association between birth weight and body composition among Asian populations are needed.
Therefore, we investigated the association between birth weight, obesity and body composition including fat mass, and lean mass in adolescents using the fifth Korean National Health and Nutrition Examination Survey of 2010–2011 (KNHANES V).
Methods
Study population and data collection
KNHANES is a national survey conducted every year by the Ministry of Health and Welfare. KNHANES V was performed from 2010 to 2011, and included 17 476 nationally representative non-institutionalised civilians in Korea. KNHANES V contains data on heath interviews, health behaviours, health examination, nutrition and large-scale whole-body dual energy X-ray absorptiometry (DXA). Target sampling follows a stratified multistage clustered probability design. Details on KNHANES can be found elsewhere,17 and the original data are publicly available via the KNHANES website.
Participants aged from 12 to 18 years (n=1510) were initially selected for this study. We excluded participants who did not respond to the birth weight questionnaire (n=203), and those who did not have BMI values (n=3). The final study population included 1304 individuals (693 men and 611 women) (figure 1). For the body composition study, only those with DXA examination values (n=884) were used.

Flow diagram of the selection procedure for the study population. BMI, body mass index; KNHANES V, fifth Korea National Health and Nutritional Examination Survey.
Sociodemographic factors
This study considered sociodemographic factors that could affect the outcome of the analyses. Age, sex, residential area and household income, all of which were self-reported, were included in the analyses. Residential area was categorised into capital, metropolitan area and town/city. Household income was divided into tertiles.
Assessment of birth weight, body composition and obesity
Birth weight was reported by the participants’ mothers. We categorised participants into three groups according to their percentile of birth weight (0%–25%, 25%–75%, 75%–100%). The cut-off points for each group were 3.00 and 3.50 kg. The middle group in terms of birth weight (25%–75%, birth weight between 3.00 and 3.50 kg) was used as the reference group.
BMI was calculated by dividing weight by height squared (kg/m2). Body composition was measured by DXA examinations, which were conducted by skilled technicians. We divided total fat mass and lean mass obtained from DXA examinations by height squared to calculate fat mass index (FMI) and lean mass index (LMI) (kg/m2) for each individual.
We defined obesity according to the guidelines by the WHO Western Pacific Region.18 We classified the study participants into being overweight (between 85th and 95th percentiles of BMI of each age and sex groups or between 23 and 25 kg/m2) and being obese (BMI ≥ 95th percentile BMI of each age and sex group or >25 kg/m2).
Statistical analysis
All statistical analyses were conducted using SPSS Statistics V.23 (IBM, Armonk, New York, USA) and Stata V.13.0 (STATA, College Station, Texas, USA). The association between birth weight, being overweight and being obese was determined by adjusted ORs (aORs) and 95% CIs calculated by logistic regression analysis. Participants being neither overweight nor obese were used as a ‘non-case’ in both overweight and obesity analyses. Factors such as sex, age, residence and household income were adjusted for. The association between birth weight and the adjusted mean values of BMI and body composition was determined by linear regression analysis.
Additionally, we ran a sensitivity analysis imputing the missing data as there is a possibility that missing data are non-random. Markov chain Monte Carlo multiple imputation technique was used to create 40 datasets, following conservative recommendations.19 In addition to variables included in the primary analyses (eg, sociodemographic factors, birth weight, BMI and DXA data), health behaviours information (eg, smoking, drinking, physical activity and energy consumption) and health status related to obesity (eg, hypertension, diabetes, asthma and impaired fasting glucose) were included as auxiliary variables. The pooled effect on the primary outcome was analysed after multiple imputation. For all analyses, a P value of <0.05 was considered statistically significant.
Results
Characteristics of the study population
The general characteristics of the total study population, male participants and female participants are shown in table 1. In the total population, the mean birth weight was 3.3 kg, and was slightly higher in men compared with women (3.3 and 3.2 kg, respectively). The prevalence of being overweight and obese was higher in men than in women (overweight: 14.0%, 10.6% respectively; obesity: 14.7%, 11.3% respectively). The mean values (SD) of FMI in adolescents was 5.8 (±2.5) kg/m2 in the total population, 5.0 (±2.5) kg/m2 in men and 6.7 (±2.2) kg/m2 in women. The mean values (SD) of LMI was 15.0 (±2.1) kg/m2 in the total population, 16.0 (±2.0) kg/m2 in men and 13.8 (±1.5) kg/m2 in women.
General characteristics of the study population
Table 2 describes characteristics of three groups: those with complete data (n=884), those with missing values on birth weight or BMI (n=206) and those with missing values on DXA (n=420). There were no significant differences in the distribution of characteristics, including birth weight, BMI, FMI and LMI among the three groups. However, those without birth weight or BMI data had higher percentage of those living in the capital area, and being in the lowest tertile of household income compared with those with complete data. Furthermore, both of the distribution of area of residence and household income differed significantly from the complete case (P<0.01 for both area of residence and household income).
Comparison of general characteristics between complete cases and cases with missing data
Relationship between birth weight, BMI, overweight and obesity
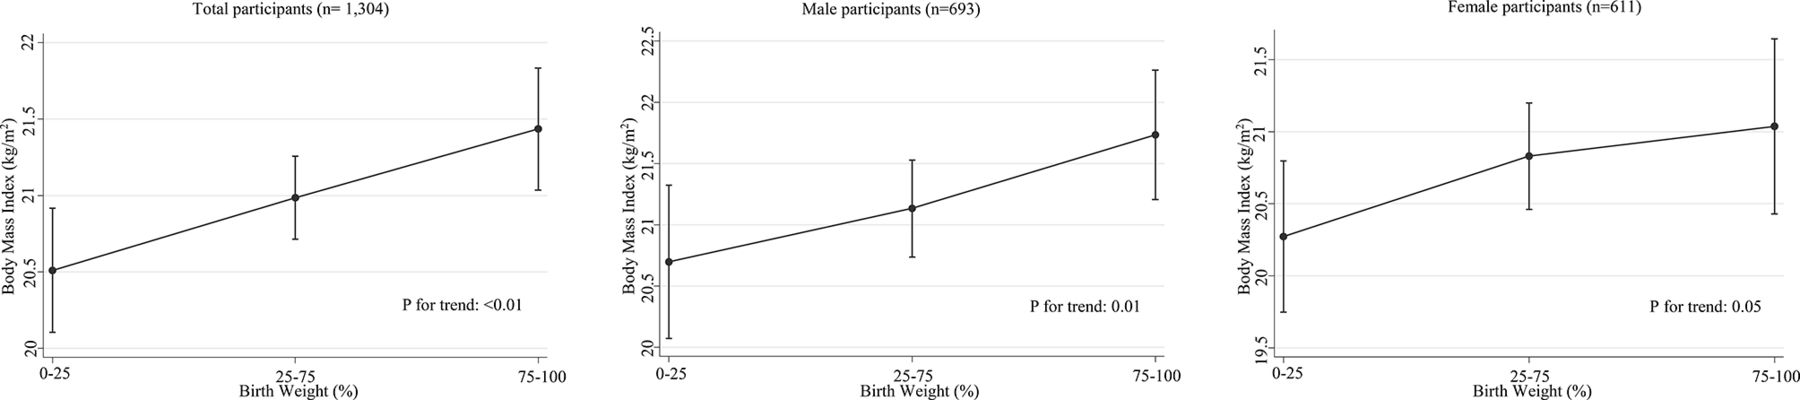
BMI of adolescents tended to increase linearly with increasing birth weight in total participants, men and women (P for trend: <0.01, 0.01 and 0.05, respectively) as presented in figure 2. Table 3 shows the total and sex-stratified ORs of being overweight and being obese according to birth weight. In the total population, the unadjusted OR for overweight in the high birth weight group (highest 25th percentile group) was 1.87 (95% CI 1.17 to 2.97) compared with the reference group. In the adjusted analysis, the high birth weight group also had higher risk of being overweight (aOR 1.75, 95% CI 1.11 to 2.76) compared with the reference group. In men, the unadjusted OR for being overweight was 2.32 (95% CI 1.30 to 4.16), and the association remained significant after adjustment of covariates (aOR 2.19, 95% CI 1.20 to 3.98). However, there was no association between high birth weight and obesity in men (aOR 1.16, 95% CI 0.62 to 2.18). In contrast, in women, adjusted analysis demonstrated the association between high birth weight and being obese after adjustment (aOR 2.13, 95% CI 1.03 to 4.41), but no association with being overweight (aOR 1.05, 95% CI 0.47 to 2.37). After data imputation, results that were significant in the complete case analysis remained consistent. In the total population and male population, the high birth weight group had higher risk of being overweight (aOR 1.70, 95% CI 1.08 to 2.54; aOR 2.12, 95% CI 1.17 to 3.99) compared with the reference group after adjustment. In female population, high birth weight group had higher risk of being obese (aOR 2.18, 95% CI 1.11 to 4.49) compared with the reference group after adjustment.

Least squares means of body mass index in total participants (n=1304), male (n=693) and female (n=611). We adjusted for age, sex, residence and household income according to birth weight.
Crude and adjusted analyses of the association between birth weight and obesity in Korean adolescents
Relationship between birth weight and body composition
The associations between birth weight, fat mass and lean mass are presented in figure 3 (total participants), figure 4 (men) and figure 5 (women). After adjusting for sociodemographic factors, the adjusted mean values of FMI increased significantly with increasing birth weight in the total population (P for trend: 0.03). However, LMI showed no significant increase with increasing birth weight (P for trend: 0.08). In male participants, higher birth weight was neither associated with higher FMI nor LMI (P for trend: 0.20, 0.25, respectively). In female participants, higher birth weight was associated with higher FMI (P for trend: 0.03), while LMI showed an inverse U-shape (P for trend: 0.25). Even after imputing the missing data, the overall trend of positive correlation between birth weight and FMI did not change. In women and the total population, FMI increased significantly with increasing birth weight (P for trend: <0.01 for both women and the total population). However, LMI did not increase with increasing birth weight (P for trend: 0.20).

Least squares means of fat mass index and lean mass index in total participants (n=884). We adjusted for age, sex, residence and household income according to birth weight.
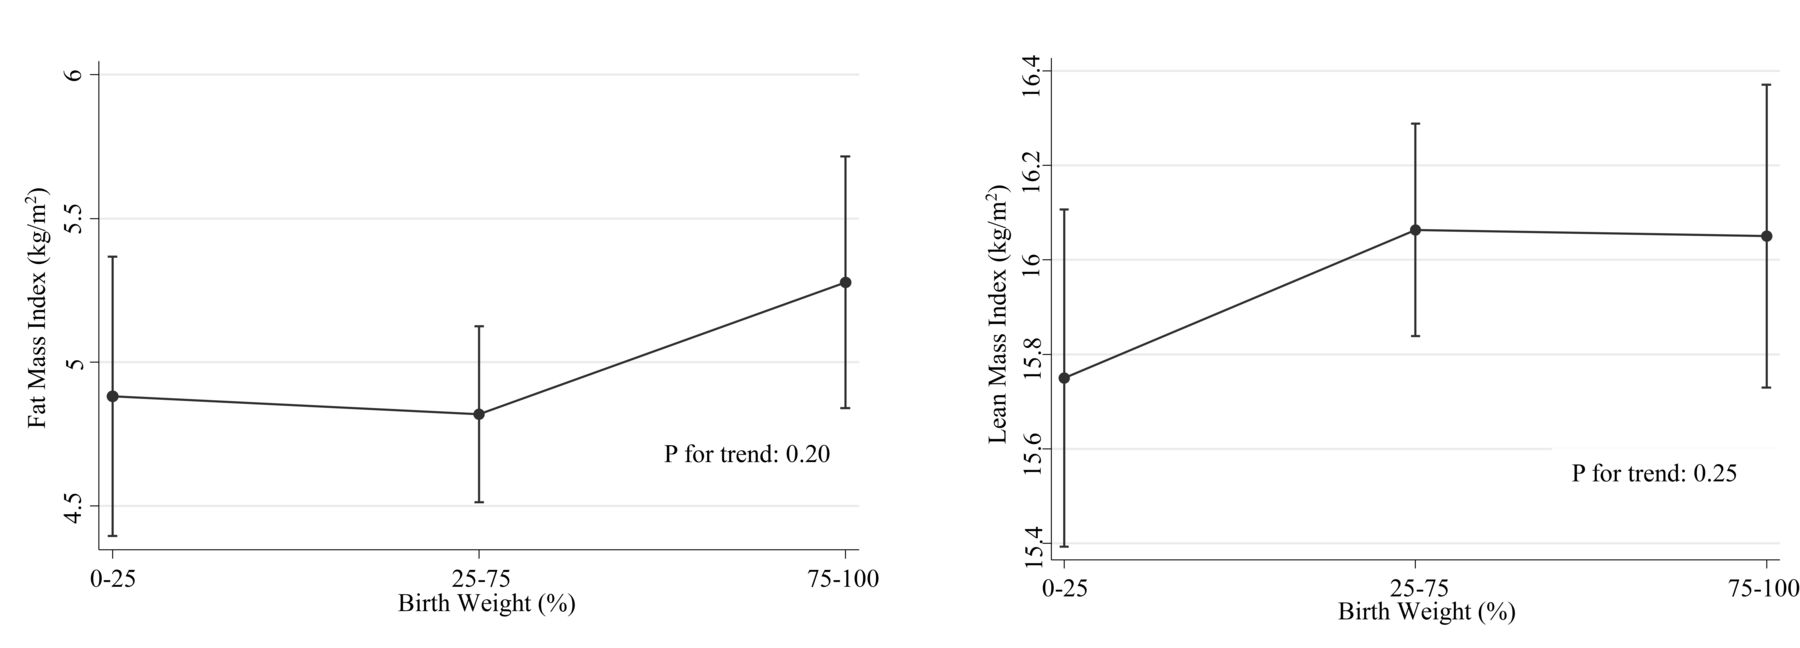
Least squares means of fat mass index and lean mass index in male participants (n=407). We adjusted for age, sex, residence and household income according to birth weight.

Least squares means of fat mass index and lean mass index in female participants (n=477). We adjusted for age, sex, residence and household income according to birth weight.
Discussion
In this cross-sectional study of Korean adolescents, we have shown that higher birth weight was associated with a higher risk of being overweight in men and obese in women. Also, higher birth weight was associated with greater BMI and FMI, but not LMI.
Higher birth weight was associated with increased risk of being overweight in the total population and in male adolescents. This is consistent with previous cohort studies that showed birth weight is associated with being overweight in male adolescents.11 20 Furthermore, high birth weight was associated with increased risk of obesity among women, but not in men or the total population. This differs from previous studies that have shown that high birth weight increased the risk of obesity in adolescents in both men and women.8 10 However, it was consistent with another study11 that additionally adjusted for family income. Several other studies have shown that higher birth weight is associated with being overweight or obese in children,8 21 and in adults.5 22 23 It is known that alterations in body fat distribution begin during puberty due to hormones including cortisol, insulin, growth hormone and sex steroids.24 The fact that adolescents are physiologically different in body composition from children and adults may account for the differing results from studies that targeted children or adults.
Higher birth weight was related to higher FMI, but not LMI. This contradicts preceding studies, which have shown that higher birth weight is associated with greater lean mass.12–14 One possible explanation for this trend in increasing fat mass but not lean mass with greater birth weight may be due to the fact that Asians tended to have greater proportions of fat compared with other ethnicities. It has been shown that BMI and body fat percent are ethnic specific, possibly due to the differences in frame size, relative leg length and physical activity level.15 16 25
The linear relationship between birth weight and FMI contradicts some of the previous studies that have shown J-shaped or U-shaped relationships between birth weight and fat mass.8 26 27 Previous studies have attempted to explain the J-shaped or U-shaped relationship between birth weight and fat mass by citing studies that show infants who are born small experience rapid catch up growth in early infancy, which results in larger fat mass in later life.28 29 While we could not reveal clear reasons for the discrepancy in our results compared with previous studies as we did not have information on postnatal weight gain, one possible explanation may be due to the ethnic differences of body composition as mentioned previously. Future studies investigating the association between birth weight and postnatal weight gain in terms of the effect of body composition are needed.
The significant association between birth weight, obesity, and FMI may be explained by genetic factors. It is said that about 50% of the variance in birth weight and >50% of the variance in BMI are attributed to shared genetic factors.30 31 Therefore, it seems rational to speculate that the genetic factors that made infants heavier could also contribute to the increased risk of greater BMI later in life. Another explanation could be that intrauterine environment, which contributes to birth weight, also affects the formation of the fetal organs involved in energy metabolism by altering the transfer of metabolic substances between mother and fetus.32
In this study, the relationship between birth weight and both obesity and body composition was different among men and women. Similarly, among previous studies that dealt with relationships between birth weight and possible outcomes in later life including obesity, blood pressure,33 lipid levels34 and insulin action,35 many have shown gender differences. As those factors, such as metabolic variables and blood pressure, are closely related to body composition,36–38 these findings indicate that men and women could have different mechanisms for body composition. It is suggested that sex steroid hormones alter the body composition during pubertal development.39 40 Oestrogen, for example, is known to play a crucial role in body fat distribution.39 This difference in hormone actions lead to more increased lean mass in boys, and comparatively high fat mass in girls.41 Moreover, some studies suggested that bone and muscle growth may be programmed differently by gender during intrauterine life.42 43 These factors may have contributed to the strong association between birth weight and FMI in women.
There are several limitations in this study. First, since observational data were used, inferences about causal effects cannot be made clearly and only assumptions about the relationship can be suggested. Further studies are needed to clarify the causality and its mechanism. Second, birth weight was self-reported in a survey, which means that the data could be less accurate compared with birth records. Although parental factors including maternal obesity, diabetes may influence the birth weight of their offspring, such information are not included in this survey. Despite these limitations, we tried to account for parental factors by adjusting for household income. Also, we used a large study population (n=1304) and performed sensitivity analysis, which makes our study generalisable to the Korean population, while further studies on other population are recommended to apply the results to other ethnics. Most importantly, this study targeted Koreans, an ethnicity few previous studies have investigated on, suggesting that ethnic differences and gender differences may exist in the body composition and in the risk of developing obesity.
Conclusion
The results of our study suggest that high birth weight may be an indicator of being overweight in Korean adolescents. Particularly in women, high birth weight is associated with higher risk of general obesity. High birth weight was associated with greater fat mass compared with lean mass. These findings suggest that those born with high birth weight may be more susceptible to being overweight and obese and may merit close monitoring and early intervention against obesity.
Acknowledgments
This study used survey data from the Korea National Health and Nutritional Examination Survey, conducted by Ministry of Health and Welfare, Republic of Korea. The authors express their gratitude towards investigators and participants of survey for providing these data.
Kyuwoong Kim received a scholarship from the BK21-plus education programme provided by the National Research Foundation of Korea.
References
Footnotes
Contributors In this study, MK designed the study, analysed the data, interpreted the results and wrote the paper as a first author. JEY and SC contributed to data analysis and result interpretation. KK contributed to data analysis and literature research. SMP contributed to study design and results interpretation. All authors were involved in revising the paper and approved the final paper as submitted.
Funding This research received no specific grant from any funding agency in the public, commercial or not-for-profit sectors.
Competing interests None declared.
Patient consent Obtained.
Provenance and peer review Not commissioned; externally peer reviewed.
Data sharing statement All relevant materials are provided in the manuscript. KNHANES V, raw data used in this is available from http://knhanes.cdc.go.kr.