Article Text

Abstract
Objective To study trends in socioeconomic equality in mortality amenable to healthcare and health policy interventions.
Design A population-based register study.
Setting Nationwide data on mortality from the Causes of Death statistics for the years 1992–2013.
Participants All deaths of Finnish inhabitants aged 25–74.
Outcome measures Yearly age-standardised rates of mortality amenable to healthcare interventions, alcohol-related mortality, ischaemic heart disease mortality and mortality due to all the other causes by income. Concentration index (C) was used to evaluate the magnitude and changes in income group differences.
Results Significant socioeconomic inequalities favouring the better-off were observed in each mortality category among younger (25–64) and older (65–74) age groups. Inequality was highest in alcohol-related mortality, C was −0.58 (95% CI −0.62 to −0.54) among younger men in 2008 and −0.62 (−0.72 to −0.53) among younger women in 2013. Socioeconomic inequality increased significantly during the study period except for alcohol-related mortality among older women.
Conclusions The increase in socioeconomic inequality in mortality amenable to healthcare and health policy interventions between 1992 and 2013 suggests that either the means or the implementation of the health policies have been inadequate.
- health care
- health policy
- socioeconomic equality
- mortality
- register study
This is an open access article distributed in accordance with the Creative Commons Attribution Non Commercial (CC BY-NC 4.0) license, which permits others to distribute, remix, adapt, build upon this work non-commercially, and license their derivative works on different terms, provided the original work is properly cited, appropriate credit is given, any changes made indicated, and the use is non-commercial. See: http://creativecommons.org/licenses/by-nc/4.0/.
Statistics from Altmetric.com
Strengths and limitations of this study
The nationwide register-based data allowed us to study simultaneously several causes of death categories comprehensively.
We were able to use individual-level data on socioeconomic indicators.
Mortality amenable to healthcare interventions is a crude indicator of effectiveness of healthcare.
While the study addressed associations between income and mortality, the other aspects of socioeconomic position nor contextual factors were not studied.
Introduction
Reducing socioeconomic health inequalities is a major goal of health policy in most countries, including Finland. Simultaneously, persisting socioeconomic differences in health have consistently been reported in both mortality and morbidity.1 2 In Finland, socioeconomic differences in life expectancy increased from the late 1980s up to 2007, but have since diminished slightly.3 4 Earlier research has suggested that the differences in health may be associated with unequal distribution of social and material resources, living environment as well as more proximate causes like health behaviours, social ties or psychological circumstances.1 5 6 It has further been suggested that healthcare may play a role and that this role is increasing due to better disease prevention strategies, improved diagnostic tools and treatment methods.7 8 Health policy programmes may also have different effects on socioeconomic groups affecting inequalities in health outcomes.9 It is essential to explore trends in socioeconomic inequality in health outcomes in relation to these potential contributing factors since the findings may increase our understanding of how health systems and policy changes contribute to inequalities in health.
Mortality amenable to healthcare interventions refers to ‘unnecessary and untimely’ deaths that should not occur when timely, good quality healthcare is available for the population. The approach was first introduced by Rutstein et al in 1976.10 Since then researchers have several times amended the list of conditions, for instance, due to progress in effective treatments and preventive measures.11 Earlier studies have repeatedly found socioeconomic differences in mortality amenable to healthcare interventions.12–16 Additionally, trends in socioeconomic equality in amenable mortality have been explored.8 13–18
Several researchers have suggested that in addition to deaths amenable to healthcare interventions, also deaths preventable by health policy measures and behavioural interventions should be considered.19–21 Socioeconomic differences between population groups reflect the material and immaterial forms of disadvantage that people are exposed to. This is why observed changes in social inequalities in mortality may also reflect variations in these conditions, not only variations in healthcare or health policy. Changes in these conditions may potentially be affected by policies other than health, such as fiscal or social policies. For example, radical tax reforms could influence people’s livelihood that in turn affects their health risks in many ways including but not limiting to their options for using healthcare and drugs. Earlier research has understood preventable deaths to include a very large variety of causes of death, such as traffic accidents, suicides, HIV and AIDS, and smoking and alcohol-related causes. In Finland, according to earlier studies, the contribution of alcohol-related deaths to premature mortality has been significant.22 Socioeconomic differences in these deaths amenable to health policy measures have also been reported in many countries.2 14 16 23 24
It has been suggested that at least a part of ischaemic heart disease (IHD) mortality should be included in amenable mortality. However, Nolte and McKee7 suggested that IHD deaths should not be included as part of amenable deaths as they are ‘avoidable’ through both health policy measures and healthcare. In Finland, Laatikainen et al 25 have estimated that more than half of the decline in IHD mortality from the early 1980s to late 1990s was attributable to reductions in major risk factors including decline in total cholesterol levels. Laatikainen et al have further suggested that only 23% of the decline was attributable to medical care. The Finnish figure is much smaller compared with international estimates which are in general closer to 50%.26–29 The Finnish figure may currently be an underestimation as both prevention of coronary events and early detection and treatment methods have developed in the 2000s. However, IHD is one of the leading causes of death in Finland as well as in other countries and these deaths are considered as partly amenable to healthcare and health policy interventions. Earlier studies have found pronounced socioeconomic inequalities in these deaths.24 30–33
Relative socioeconomic inequalities in mortality, however, are not similar in all population groups. Earlier studies have found more pronounced socioeconomic differences in overall mortality among younger ages. A study from Scotland, for instance, found that the impact of social class on all-cause mortality was exacerbated among young adults in 1991–2009.34 Another study in Scotland has detected an increase in small area-based socioeconomic inequality in mortality among people aged 25–50 largely because of inequalities in deaths owing to alcohol, drugs, suicide and violence.35 A Finnish study found increasing age group differences in socioeconomic equality in IHD mortality and also in this study equality was higher among younger adults.30
The Finnish healthcare system provides a good case for examining mortality amenable to healthcare. While the Finnish system is mainly financed by tax revenues and has universal coverage with nominal user fees for most services, it in general supports equal access to healthcare. However, Finnish healthcare includes some features that compromise equality. While ambulatory services are primarily provided by the public sector and financed through taxation, there have been difficulties in access. Ambulatory care services are provided through three parallel systems. Public primary care services are provided by municipal health centres but waiting times for physicians’ consultations particularly may be long. As for parallel services, occupational healthcare mandatorily organised by employers provides easy and free of charge access to general practitioner-level services for the most employed persons. The private sector also provides ambulatory care services but mainly in urban areas and patients’ co-payments are high. For specialist somatic services, there are 20 hospital districts owned, funded and managed by municipalities, which organise and provide specialist medical services for the residents.36
Only a few of the earlier studies have used individual-level indicators of socioeconomic position when investigating trends in socioeconomic inequality and trends in age group differences in socioeconomic inequality in different causes of death categories.2 8 13 15 16 30 This study aims to evaluate socioeconomic equality in mortality amenable to healthcare, behavioural interventions and health policy in the period of >20 years in Finland using individual-level income information. More specifically, we study income-related differences in mortality amenable to healthcare interventions, alcohol-related mortality and IHD mortality utilising comprehensive register data between 1992 and 2013. Additionally, given the relative lack of studies comparing inequalities between age groups we assess here differences in socioeconomic equality in causes of deaths categories between younger and older adults.
Materials
This study was based on register data on deaths amenable to healthcare interventions, alcohol-related deaths and IHD deaths among the non-institutionalised Finnish residents aged 25–74 in 1992–2013 (see online supplementary appendix 1 I for a detailed list of causes of death coded according to the International Classification of Diseases (ICD)-10). For comparison reasons, we studied also ‘other mortality’ as one combined category (deaths other than amenable, IHD or alcohol related deaths). An adaptation of classifications by Page et al 37 and Nolte and McKee38 was used to categorise amenable deaths.15 Alcohol-related deaths were defined as those underlying causes of death attributable directly to excess alcohol consumption or diseases caused by excess alcohol consumption.
Supplementary file 1
The data on deaths came from the Causes of Death statistics compiled by Statistics Finland. Causes of death (as an underlying cause) were coded according to the ICD-9 for the period 1992–1996 and ICD-10 for the period 1996–2013. Deaths due to ‘accident or misadventure due to healthcare’ were not included in the amenable mortality category since these deaths are not classified separately in the Finnish Causes of Death statistics. Those deaths, however, represent a small fraction of all amenable mortality.7 By means of unique personal identity codes, data on death events were linked to the population Censuses and the annual Employment statistics of Statistics Finland for information on individual demographic and socioeconomic factors.
Disposable family income was used as an indicator for socioeconomic position in this study. The family net income was adjusted for family size using the Organisation for Economic Co-operation and Development (OECD) modified equivalence scale.39 The income record for the year before the death was used. The income information was further categorised into 20 income groups by the fifth percentiles of the annual Finnish income distribution. The same income limits were applied for men and women.
Due to data protection regulations, we received the data compiled from individual-level registers in tabulated form. Thus, the final data sets included records on deaths grouped by other variables including gender, year, family disposable income bracket and age (in 5-year age bands).
Methods
Statistical analyses were based on multidimensional tabulations of deaths and sociodemographic factors. Men and women were studied separately. First, we calculated age-standardised mortality rates (per 100 000 person-years (py), the direct method) by causes of death categories for two age groups, the younger adults 25–64 and the older adults 65–74, using the European Standard Population as the standard.40
The concentration index (C) was used for detailed analyses of socioeconomic equality. C is a widely used tool to measure the degree of socioeconomic inequality in health and healthcare.41–46 C can have values between [−1, 1] and the value 0 denotes total equality. In case of a negative outcome (as death), negative values of C denote for inequality favouring the higher socioeconomic groups. For aggregated data, C can be estimated as
 ,
,
where  is the healthcare score of the
g
th socioeconomic group and
is the healthcare score of the
g
th socioeconomic group and  is the mean of the
  ,
,  is the relative rank of the
g
th socioeconomic group and
is the relative rank of the
g
th socioeconomic group and  is its population share.47 The relative rank is defined as
  and indicates the cumulative proportion of the population up to the midpoint of each group interval.
We estimated the CIs for C using the method developed for register data.48 The changes in mortality rates and C were tested separately for each category by fitting a linear or non-linear regression across the outcome variables for the years. If the slope of the model significantly differed from zero, dependence was interpreted to exist. We estimated average annual per cent changes (AAPC) to describe the changes of mortality rates over the study period. AAPC was estimated fitting a regression model for logarithm of the yearly age-adjusted rates and transformation of the slope was interpreted as the annual relative change of the rate. If the change was not constant over time, the AAPC was estimated separately for the segments.
Patient and public involvement
Patients were not involved in the design or the implementation of the study.
Results
In 1992, a total of 13 296 deaths among men and 7056 among women aged 25–74 occurred in Finland (table 1). Of these deaths, 15% were considered as amenable to healthcare among men and 27% among women. The proportion of IHD deaths was 32% and 23% and alcohol-related deaths accounted for 6% and 3%. By 2013, the total number of deaths decreased by 18% among men and by 23% among women. The proportion of deaths amenable to healthcare decreased slightly, the proportion of IHD deaths significantly and the proportion of alcohol-related deaths doubled among both genders.
The number of deaths (and proportions of these deaths to the total number of deaths) by causes of death categories among inhabitants aged 25–74 in 1992 and 2013 in Finland
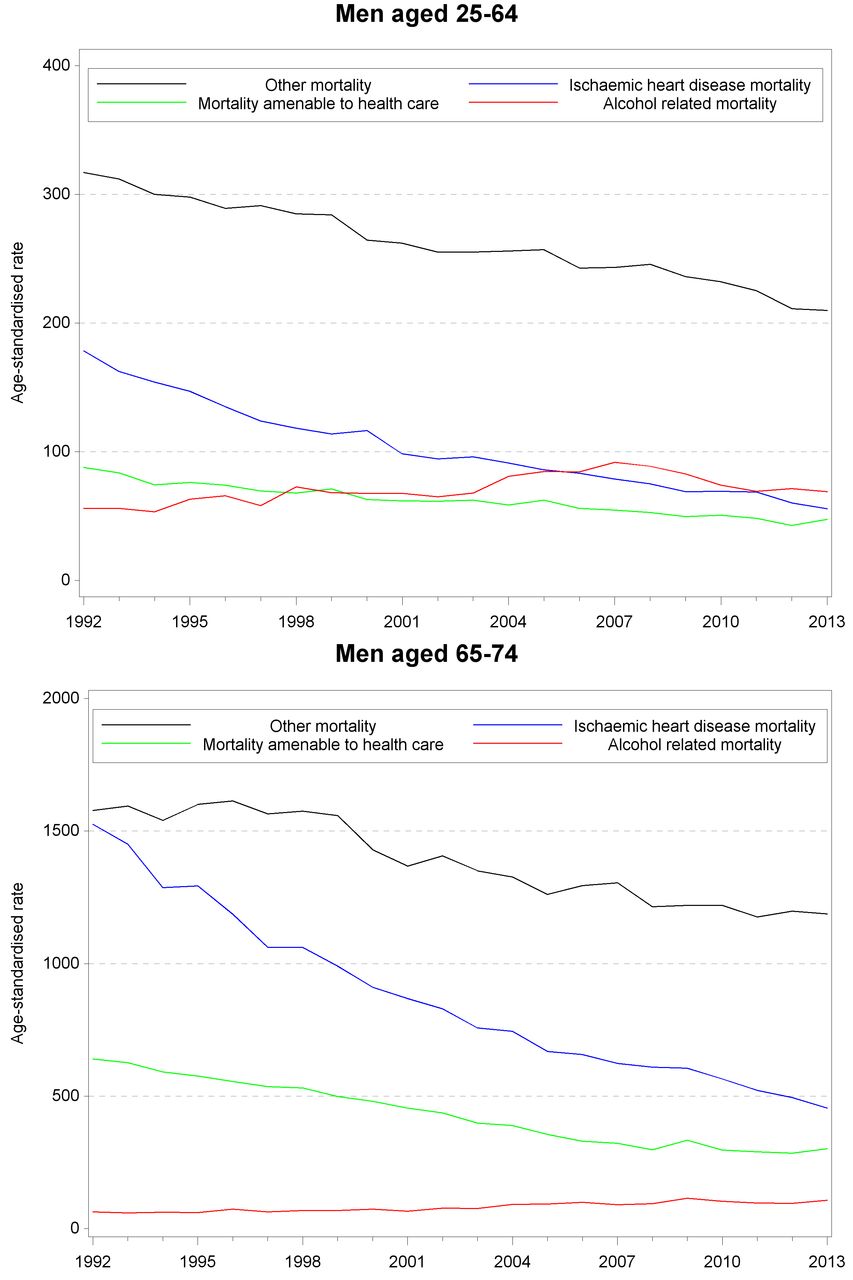
Next we calculated the annual age-standardised rates (per 100 000 py) for each cause of death category by age group (figures 1, men, and 2, women). The rate was highest for ‘other deaths’ in both age groups throughout the study period among both genders. The rate decreased significantly (p value<0.001) for amenable, IHD and ‘other deaths’, whereas alcohol-related mortality rate increased significantly (p value<0.001) in younger (aged 25–64) and older (aged 65–74) age groups among both genders. Among younger men, the decrease was absolutely and relatively highest in IHD mortality; the rate fell by 123 deaths (per 100 000 py) between 1992 and 2013 and the average annual percent change was −5%. Alcohol-related mortality rate increased by 35 deaths (per 100 000 py, AAPC+4%) until 2007, and declined after that by 23 deaths (per 100 000 py, AAPC −2%). Among older men, the decrease in mortality was also absolutely and relatively highest in IHD mortality; the rate fell by 1070 deaths per 100 000 py and the AAPC was −5%. Alcohol-related mortality rate increased by 44 deaths (per 100 000 py, AAPC+3%). Among younger women, the decrease was absolutely highest in ‘other mortality’ (the rate fell by 34 deaths per 100 000 py) and relatively highest in IHD mortality (AAPC −5%). Alcohol-related mortality rate increased until 2008 by 13 deaths (per 100 000 py, AAPC+5%) and declined after that by six deaths (per 100 000 py, AAPC −2%). Among older women, the decrease was relatively and absolutely highest in IHD mortality; the rate fell by 427 deaths (per 100 000 py, AAPC −7%). Alcohol-related mortality rate increased by 15 deaths (per 100 000 py, AAPC+6%). The decline in ‘other mortality’ rate stagnated after 2007 and the rate increased somewhat after that.

Age-standardised mortality rates (/100 000 person-years) by causes of death categories and by age among men aged 25–74 in 1992–2013 in Finland

Age-standardised mortality rates (/100 000 person-years) by causes of death categories and by age among women aged 25–74 in 1992–2013 in Finland
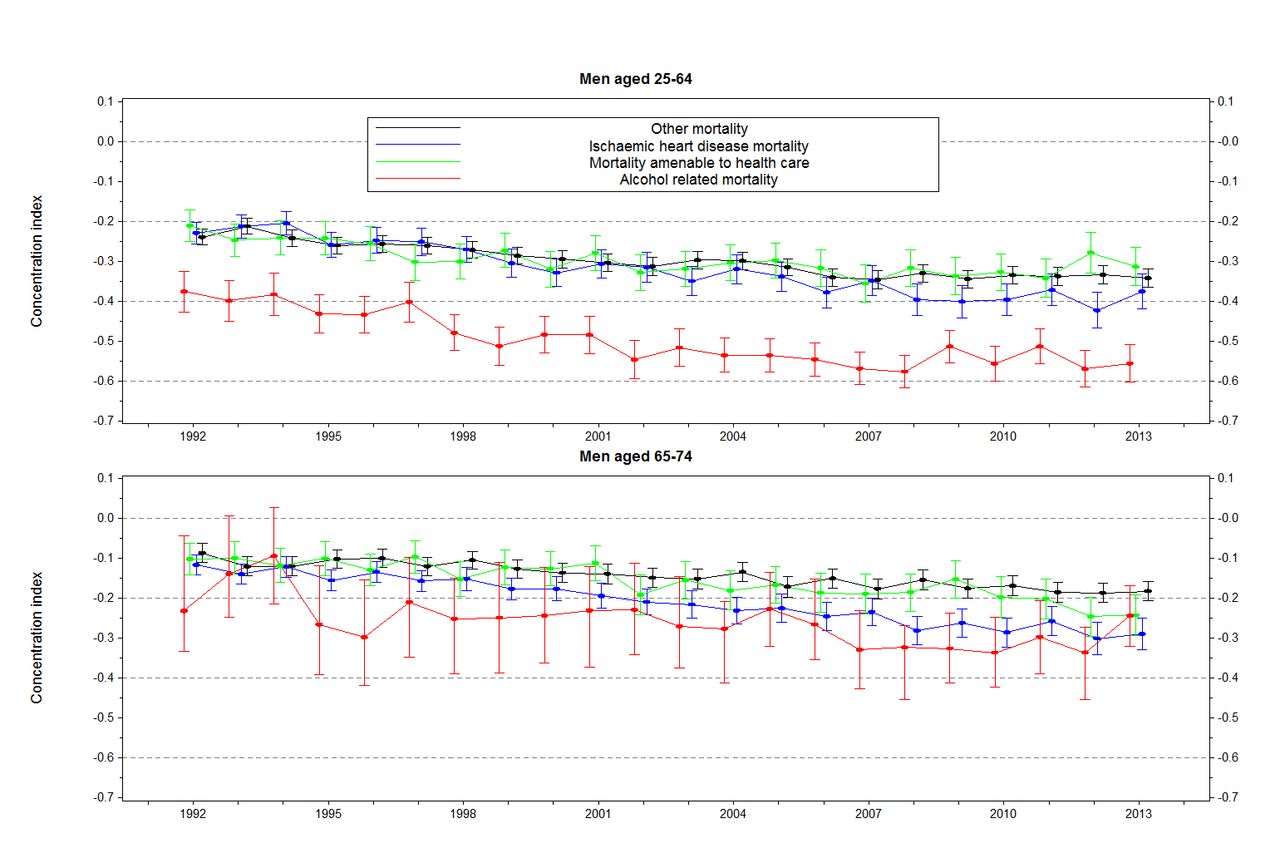
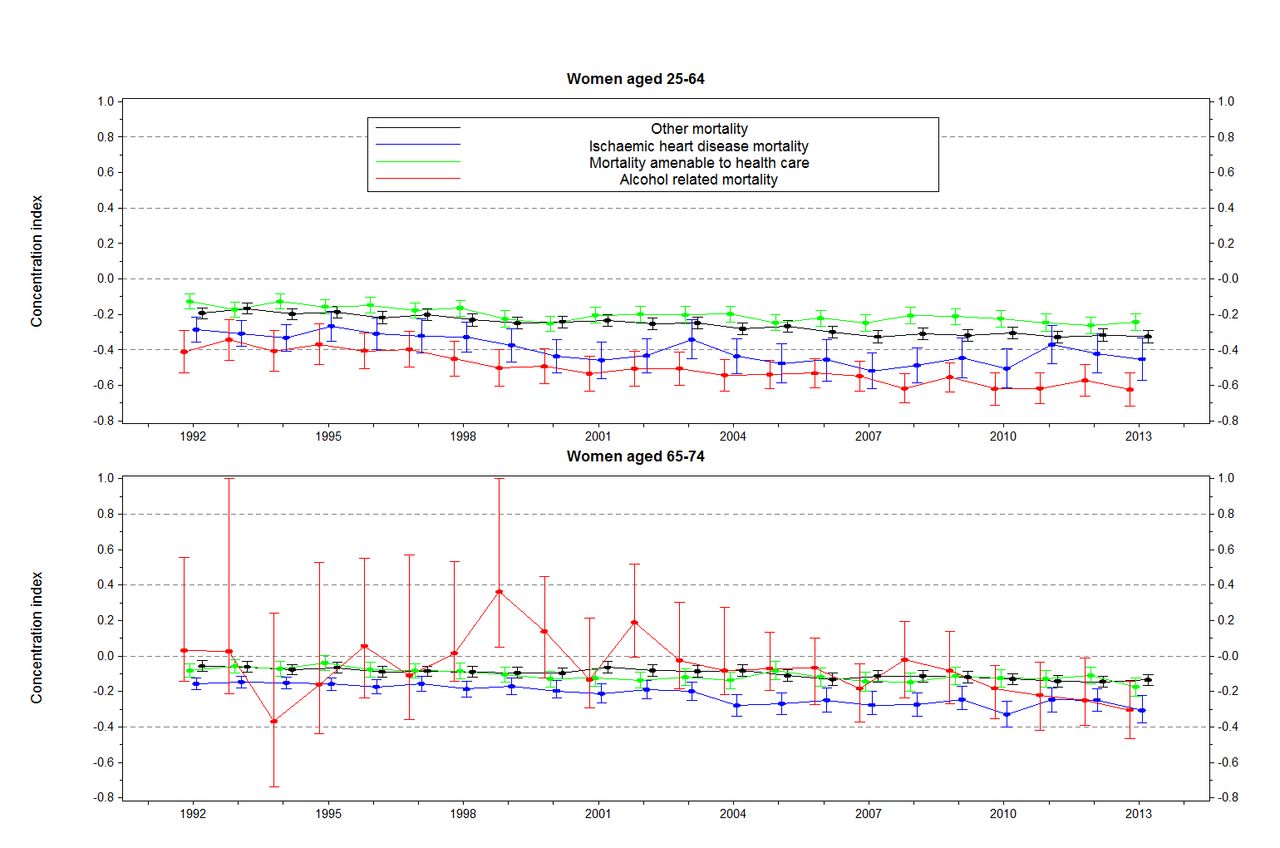
The age-standardised rates varied substantially between income groups in all mortality categories among both genders and age groups in the period 1992–2013. Figure 3 (men) and 4 (women) present results for relative inequality in different mortality categories. Among younger men (aged 25–64) and younger women, the concentration index (C) was negative and significantly smaller than zero for each category in each year indicating inequality favouring the better off. Among older men (aged 65–74), C was significantly smaller than zero for each category throughout the years, except for alcohol-related mortality in 1992 and 1993. Among older women, C was similarly significantly negative except for alcohol-related mortality in most of the years.

Concentration index for mortality by causes of death categories and by age among men aged 25–74 in 1992–2013 in Finland

Concentration index for mortality by causes of death categories and by age among women aged 25–74 in 1992–2013 in Finland
Among younger men, C for alcohol-related mortality was −0.38 (95% CI −0.43 to −0.32) in 1992 and −0.55 (−0.60 to −0.51) in 2013. For the other causes of death categories, C was at the same level with each other; in the beginning of the period C was about −0.23 and in the end of the period about −0.34. Among older men the value of C was in general closer to zero indicating smaller inequality and differences in inequality between alcohol-related mortality and the other causes of death categories were not statistically significant.
Among younger women, the absolute value of C was in general smallest for amenable mortality and highest for alcohol-related mortality. C for amenable mortality was −0.13 (−0.17 to −0.09) in 1992 and −0.24 (−0.29 to −0.19) in 2013 and for alcohol-related mortality −0.41 (−0.29 to −0.53) in 1992 and −0.62 (−0.72 to −0.53) in 2013. Similarly to men, the value of C was closer to zero among older women compared with younger women indicating smaller inequality. Due to a small number of alcohol-related deaths among older women, the value of C varied markedly for alcohol-related mortality and induced large CIs, especially during the first years of the study period.
Additionally, the value of C decreased for each cause of death category significantly suggesting increasing inequality in both age groups (p values for trend <0.05); this was the case for all groups studied except among older women, among whom the decreasing trend for alcohol-related mortality was not significant (p value 0.09). Among younger men the change was greatest for IHD mortality, estimated by the magnitude of the slope of the regression line across Cs for the years. The slope was significantly steeper for IHD mortality compared with the slopes for amenable mortality and ‘other mortality’. For IHD mortality, alcohol-related mortality and ‘other mortality’, the decrease of C slowed down after 2003 (p value for the change before 2003 was <0.001). For alcohol-related mortality, the change was not significant anymore after that (p value 0.071). Among older men the slope was steepest also for IHD mortality and it was significantly greater than for ‘other mortality’. The decrease of C was constant over time.
Among younger women the slope was steepest for alcohol-related mortality and it was significantly greater than the slopes for amenable mortality and ‘other mortality’. The decrease of C was constant over time for other than IHD mortality for which the decrease slowed down after 2003 (p value for change before 2003 was <0.001 and after that 0.023).
Among older women the slope was steepest for IHD mortality and it was significantly steeper than the one for ‘other mortality’. The decrease was constant for IHD mortality but for amenable mortality the decrease slowed down after 2003 (p value<0.001) and was not significant anymore after that (p value 0.101). For ‘other mortality’ the decrease started to accelerate after 2003 (p value for change before 2003 was <0.01) and the slope was steeper after that, but not significant anymore (p value 0.086).
Discussion
The overall objective of this study was to analyse trends of socioeconomic equality in mortality amenable to healthcare and public health interventions to assess the potential of healthcare and public health policies to influence these trends. In line with a recommendation by Nolte and McKee49 we have assessed time trends ‘to compare changes between amenable and non-amenable deaths as a pointer for influencing improvements in healthcare’. Evaluating the outcomes of healthcare and the effects of policy measures requires a broad framework for analysis. We examined socioeconomic equality in mortality amenable to healthcare interventions, alcohol-related mortality and IHD mortality together with deaths due to all other causes during a long period to get a detailed overview of the state of equality in mortality in Finland. We used comprehensive register data on mortality and disposable family income as a measure of socioeconomic position. Deaths amenable to healthcare interventions are classified as preventable since explicit medical interventions for these specific diseases exist. Alcohol-related deaths are considered partly as preventable since alcohol policy (both distribution and price policies) and interventions may reduce the harms of excess alcohol use at the population level.50 51 Finally, IHD deaths are considered partly amenable through healthcare and partly by health policy interventions as suggested by earlier research.28
According to this study, mortality amenable to healthcare and IHD mortality decreased markedly between 1992 and 2013. This decreasing development is in line with other studies from high-income countries.52–54 In our study, the favourable trend was seen in both younger (aged 25–64) and older (aged 65–74) adults. Alcohol-related mortality, however, increased significantly in both age groups among men and women although in the late 2000s it started to decrease somewhat among younger age groups. This pattern has been reported earlier in Finland where it is associated to changes in alcohol consumption due to the sharp decrease in excise on alcohol in 2004 and its subsequent gradual increases.3 Also in England and Wales alcohol-related mortality increased until 2008—as a main contributor the increased affordability and availability of strong alcohol—but declined after that with simultaneous changes in affordability of alcohol.55
Our study found, however, that the improvement in amenable, IHD mortality and mortality due to other causes was not similar between socioeconomic groups. Mortality in these causes of death categories decreased relatively more rapidly in high-income groups causing increasing socioeconomic inequality, which is in general similar to findings in other countries.33 56 57 We detected significant inequality in these deaths each year in younger as well as older adults among both genders. Although the decrease in amenable mortality was larger than the mortality change for ‘other causes’, socioeconomic differences remained similar in these categories. While the overall decrease was largest in IHD mortality, socioeconomic inequality simultaneously increased the most in it among men and among older women, especially compared with mortality due to ‘other causes’.
The changes in alcohol-related mortality were also divergent in different socioeconomic groups. The increase in overall level of alcohol-related mortality was caused by the marked increase in mortality in lower socioeconomic groups. Of the studied causes of death categories, socioeconomic inequality was in general highest for alcohol-related mortality; inequality was notable marked throughout the years. Moreover, socioeconomic inequality increased significantly during the study period; except among older women for whom the number of alcohol-related deaths in the beginning of the study was low. Similar findings have been obtained in other countries.2 In our study, the worsening trend was particularly obvious among younger adults. Among younger women inequality increased the most for alcohol-related mortality and it was significantly greater than inequality for amenable mortality and ‘other mortality’.
Marked socioeconomic inequalities in the studied causes of death categories are likely to partly reflect differences in poorer physical health and poorer health behaviours leading to adverse outcomes. It has been suggested that health promotion actions may reach better those with already more favourable positions and thus improve their lifestyle. Further, developments in medical and social care tend to benefit the better-off more. Treatments of IHD have developed markedly during the study period, but the morbidity differences have seemingly widened. Health policy actions or more advanced treatment methods have not been able to diminish these inequalities. In addition to health behaviour interventions and prevention of health risks and improving equity in healthcare, tackling different aspects of socioeconomic deprivation needs to be included as a modifiable risk factor in health policies and taken into account in the surveillance of health risks.1 58 59
In our study, the level of inequality in all causes of death categories was higher among younger adults compared with older adults; this was especially the case for alcohol-related mortality. Our results add to findings from earlier studies in regard with overall mortality using sample data and occupation as socioeconomic position34 and cause-specific mortality using population-based data and area-level socioeconomic position.35 The less pronounced socioeconomic inequalities in older age may in part be due to homogenisation of health differences with passing of the years. For instance, those people with the worst health in their mid-life experience in general more often premature death. A study by Hoffmann60 suggests that health is a more important factor than age in diminishing socioeconomic differences in mortality by age, that is, the impact of socioeconomic position is mediated through poor health and is stable across age groups. Additionally, income transfers and social security provided by the welfare state results in smaller income differences between retired people compared with people in working age. In Finland, the available healthcare services are also more equal for retired people since the occupational healthcare services for working people is one of the most important factors of inequality of care.61
In this study, we were able to use comprehensive register data covering entire population in Finland, which can be seen as a major strength. Finnish data on mortality are exhaustive due to the completeness of registration of deaths, the process for expert review of disputed cases and the high autopsy rate for deaths from external and suspicious causes.62 The use of individual-level family income information is also a major strength. Our measure of alcohol-related mortality is based on a standard classification by Statistics Finland and takes into account not only alcohol poisonings but also a broad range of diseases brought up by excess alcohol consumption.63 The strength of amenable mortality as an indicator of effectiveness of healthcare is that it relies on a list of conditions in which death could be avoided by identifiable effective interventions in healthcare. On the other hand, it sums up death rates from a long list of diseases some of which have a negligible contribution to amenable mortality. Tobias and Jackson have suggested that amenable mortality could be considered to ’measure the theoretical scope for further population health gain, not what may be considered feasible given current technology, available resources and competing values’.64 Thus, it is a crude indicator of access to care and thus the results should be interpreted with caution.
The differences in the prevalence and incidence of some diseases between socioeconomic groups may also have an effect on disparities in amenable mortality, but those differences could not be taken into account in this study. Nevertheless, inequalities in the use of and access to health services may affect the incidence of subsequent disease. In addition, we were not able to examine smoking-related deaths that could be influenced by price policies since a large part of smoking-related deaths are likely to be lung cancer deaths and part IHD or chronic obstructive pulmonary disease deaths and it cannot be estimated which part of these deaths would be smoking related and how that would vary between population groups from the register data used in this study. Furthermore, the current data did not contain information about smoking or its distribution in each income group. In this study, we used only income as a measure of socioeconomic position which can be regarded as a limitation. Income describes strongly a part of the individual’s position in the societal structure, material living conditions, but does not fully describe social resources.
An earlier international study covering 17 countries suggests that healthcare has the potential to be an effective policy instrument for diminishing socioeconomic inequalities in amenable mortality.56 Correspondingly, the possibilities to reduce inequalities in IHD mortality exist due to the evident susceptibility of IHD to prevention and treatment.65 Even though inferences to be drawn from our results are tentative, the following observations concerning healthcare and health policy can be made. Our results suggest that even though healthcare and health policy measures have generally been effective in reducing amenable mortality and preventable IHD deaths they have failed to reduce socioeconomic differences in them. Instead, the differences in both groups of mortality have increased. Moreover, socioeconomic inequalities in alcohol-related deaths, in addition to overall level of alcohol-related mortality, have increased. An earlier study has shown that during this century a large part of the increase of general mortality can be assigned to alcohol mortality.50 In other words, the reduction in alcohol prices and its outcomes explain much of the general trends. These outcomes, such as the consequences of excess alcohol use, however, vary to a large extent socioeconomically. Further, it should be noted that some of the changes in alcohol policy were not driven by health concerns but rather either by fiscal reasoning or by more general changes towards more liberal policies.66
To conclude, our study shows that despite reducing health inequalities having been one of the key aims of health policy of practically all governments during the study period some political decisions seem to have been conducted ignoring health impact assessment and the varying health effects of interventions on social groups. The implementation plans of public health programmes aiming at reducing inequalities should be more targeted.
References
Footnotes
Patient consent for publication Not required.
Contributors SL participated in the conception and planning of the study, designed the study, analysed and interpreted the data and was a major contributor in writing the manuscript. KM, SK, and IK participated in the conception and planning of the study and the interpretation of the results for important intellectual content and writing the manuscript. All authors read and approved the final manuscript.
Funding This work was supported by the Academy of Finland (project numbers 277939 and 312708), but the Academy had no involvement in its design, data collection, analysis, findings or decision to publish.
Competing interests None declared.
Ethics approval Ethics Committee of National Institution for Health and Welfare.
Provenance and peer review Not commissioned; externally peer reviewed.
Data sharing statement No additional data are available.