Article Text

Abstract
Purpose The systemic epidemiology of salt sensitivity (EpiSS) study aims to combine molecular biology, epidemiology and bioinformatics methods to discover the potential causes of salt sensitivity of blood pressure (SSBP) using single-nucleotide polymorphisms in the genome and non-coding RNAs in the transcriptome to uncover both the genetic and environmental factors of SSBP.
Participants Between July 2014 and July 2016, we enrolled adults from 11 study centres in Beijing and Liaoning Province; participants were of the Han population and were 35–70 years of age. We collected blood samples, spot urine samples and 24-hour urine samples, in addition to baseline data on demographics, health-related lifestyle factors, chronic diseases, family history of illness and anthropometric information through face-to-face interviews using a standardised questionnaire. EpiSS uses the modified Sullivan’s acute oral saline load and diuresis shrinkage test (MSAOSL-DST) to evaluate the effects of salt on blood pressure.
Findings to date In total, 2163 participants were included in the EpiSS, of which 2144 participants completed the questionnaire, 2120 (98.0%) completed the MSAOSL-DST and 2083 (96.3%) provided a 24-hour urine sample. A total of 2057 participants (1501 women and 556 men) completed all the steps of the investigation and were included in the analysis. Among them, 583 (28.3%) subjects were classified as having salt sensitivity of blood pressure, and 1061 (51.6%) had hypertension.
Future plans The next step of our study is to evaluate the incidence of cardiovascular disease in the participants. Biennial follow-up, including face-to-face questionnaire surveys, laboratory measurements of blood, urinary creatinine, glomerular filtration rate and anthropometric measurements, will occur two additional times. DNA and RNA will be collected for subsequent genetic biomarker studies. We plan on screening the salt-sensitive-related gene loci and non-coding RNAs based on relative environmental risk factors.
Trial registration number ChiCTR-EOC-16009980; Pre-results.
- blood pressure
- dietary sodium
- genes
- salt sensitivity
- epidemiology
This is an open access article distributed in accordance with the Creative Commons Attribution Non Commercial (CC BY-NC 4.0) license, which permits others to distribute, remix, adapt, build upon this work non-commercially, and license their derivative works on different terms, provided the original work is properly cited, appropriate credit is given, any changes made indicated, and the use is non-commercial. See: http://creativecommons.org/licenses/by-nc/4.0/.
Statistics from Altmetric.com
Strengths and limitations of this study
A systemic epidemiological approach was used for enrolment and quality control throughout the study protocol to analyse the comprehensive risk factors for the effects of salt on blood pressure. Trained researchers used uniform and standardised methods of data collection and laboratory testing.
The systemic epidemiology of salt sensitivity (EpiSS) study was designed to include patients with hypertension and also to simultaneously compare these patients with healthy participants so that the results would be sufficient to draw further conclusions.
To our knowledge, no study has been carried out regarding the distribution frequency of salt-sensitive individuals in the Beijing and Liaoning areas, and EpiSS is the largest salt sensitivity study in China that has used the modified Sullivan’s acute oral saline load and diuresis shrinkage test.
The subjects volunteered to participate in the study; we did not use a random sampling method. Additionally, there were more elderly women in communities. Thus, our participants may not represent the general population.
Due to logistical reasons and insufficient funds, we were unable to evaluate the glomerular filtration rate and creatinine in baseline survey. We would like to evaluate these two indices at the subsequent follow-up.
Introduction
Hypertension is a complex disease caused by both genetic and environmental factors. According to WHO, in 2008, hypertension affected more than 1 billion people worldwide1 and led to 9.4 million deaths in 2010.2 By 2025, the global prevalence of hypertension is expected to increase by 60%, to a total of 1.56 billion cases.3 Due to its high prevalence and the concomitant increase in risk for cardiovascular and kidney disease, hypertension presents a great challenge for global public health.
Previous studies have found that family history, a genetic predisposition, being overweight or obese,4 5 excess salt intake6 and excessive drinking7 are risk factors for hypertension.8
A large number of studies have shown that among the environmental factors, a high salt intake is one of the most important risk factors of increasing blood pressure.9–11 The causal relationship between sodium intake and blood pressure was demonstrated by the Intersalt study, which included 52 study centres located in 32 countries.12 Similar to the Intersalt study results, the majority of salt intake–related epidemiological studies have shown a positive correlation between sodium intake and blood pressure; however, even with the same dietary sodium intervention, the blood pressure responses can vary significantly among individuals, a phenomenon called salt sensitivity of blood pressure (SSBP).13 The definition of SSBP was first proposed by Kawasaki et al as an increase in blood pressure in response to high dietary salt intake.14 More recently, SSBP is believed to be a continuous physiological trait.15 16 According to research, salt sensitivity is an intermediate genetic phenotype of hypertension17 and is an independent risk factor for cardiovascular events and a strong predictor for total mortality in both hypertensive and normotensive patients.18 In 2005, the American Society of Hypertension stated that salt effects on blood pressure represent a marker for early hypertension damage.19 The early identification and diagnosis of salt effects can be helpful to prevent the occurrence of salt-sensitive hypertension and will aid in the individual salt reduction process among high-risk populations.20
The detection of salt sensitivity is key to the prevention and treatment of hypertension. The evaluation methods include the chronic dietary salt intake, which could take several weeks, the acute intravenous infusion of 2 L of saline in 4 hours, the cold pressor test and so on15; however, there is still no accurate and standardised method for the evaluation. In 1978, Luft et al pioneered the use of a combination of rapid salt loading (2 L of saline within 4 hours of intravenous infusion) with sodium reduction (10 mmol Na+, 40 mg of furosemide, oral administration, three times daily) to determine salt sensitivity.17 A large number of studies have been carried out since then, with researchers using various methods and standards for the determination of salt sensitivity. In these studies, salt loadings ranged from 10 mmol/day to 340 mmol/day, and test times ranged from 4 hours to 28 days.14 21 22 Some studies have used the absolute value of blood pressure before and after the intervention to determine salt sensitivity, while other studies have used the relative value of blood pressure changes to determine salt sensitivity.14 23 24 Consequently, the different study designs and incompatible determination criterion have resulted in an insufficient data set from which to draw strong conclusions regarding the effects of salt on blood pressure. Therefore, it is important to establish a method that can quickly and accurately screen for the effects of salt on blood pressure.
Genetic variation also plays a significant role in salt sensitivity,25 including variations in the renin–angiotensin–aldosterone system,26 ion and water channels, transporters and exchanger systems, such as the endothelial sodium channel,27 the endothelial system,28 the intracellular messenger system,29 the sympathetic nervous system,30 31 the apelin–APJ system,32 and the natriuretic peptide and kallikrein–kinin systems.33 This finding suggests that it may be possible to discover genetic biomarkers to help determine the effects of salt on blood pressure.
To prevent the occurrence of hypertension at an early stage, it is important to be able to fully understand the effects of salt on blood pressure and its environmental and genetic risk factors in a population. Systemic epidemiology is a new approach to epidemiology that looks at multiple levels of causation (eg, sociodemographic, clinical, biological) and combines several exposure measurements to identify risks using genomics, metabolomics, transcriptomics, lipidomics and RNomics methods, among others, to analyse the inter-relationships among risk factors.34
With the rapid development of precision medicine and next-generation sequencing technology, the role of the genome and transcriptome in the pathogenic mechanisms of chronic diseases that have complex aetiologies is drawing increasing attention. The combination of multiomics will assist in the discovery of the primary targets of diseases and will be able to evaluate the effects of genetic factors impacted by various environmental features, which may be useful for the prevention and treatment of disease. Thus, using the systematic epidemiology approach to the Han population of northern China, the EpiSS cohort study was established to combine molecular biology, epidemiology and bioinformatics methods to investigate the potential causes of SSBP using single-nucleotide polymorphisms (SNPs) from the genome and non-coding RNAs from the transcriptome to elucidate both the genetic and the environmental factors affecting SSBP. To our knowledge, EpiSS is the largest salt sensitivity study in China that has used the modified Sullivan’s acute oral saline load and diuresis shrinkage test (MSAOSL-DST).
Cohort description
Between July 2014 and July 2016, subjects were recruited from 11 study centres in Beijing (five community health centres) and a representative city of Liaoning Province (six community health centres), which is commonly considered to be a high-sodium-intake area in northern China. The selection of our study sites was stratified by the districts of the administrative regions. The community centres in each district that had the ability to undertake the survey and cooperated well were selected as the study sites. The prevalence of SSBP in hypertensive and normotensive patients is 50% and 42%, respectively.15 According to the sample size equation for the cohort study, we required a minimum of 814 subjects for the two groups, with α=0.05 and β=0.10. The total sample size was 1791, and 10% were estimated to be lost to follow-up.
All individuals aged between 35 and 70 years living in the selected communities for more than 5 years were interviewed and participated voluntarily. Additionally, all of the participants were Han Chinese and were independent. The detailed inclusion and exclusion criteria for the study population are listed in table 1 and table 2. Details of the process are shown in figure 1, including the questionnaire survey, anthropometric measurements, MSAOSL-DST, and collection of the 24-hour urine and blood samples. Patients with hypertension were required to stop the intake of all antihypertensive drugs for at least 24 hours considering the half-life of antihypertensive drugs, which followed voluntary principles. We recorded the situation of drug use and discontinuation on the day of the survey and excluded those who took the medicine. Additionally, all subjects had fasted for at least 8 hour prior to testing.
Inclusion/exclusion criteria for normal blood pressure participants
Inclusion/exclusion criteria for hypertension participants

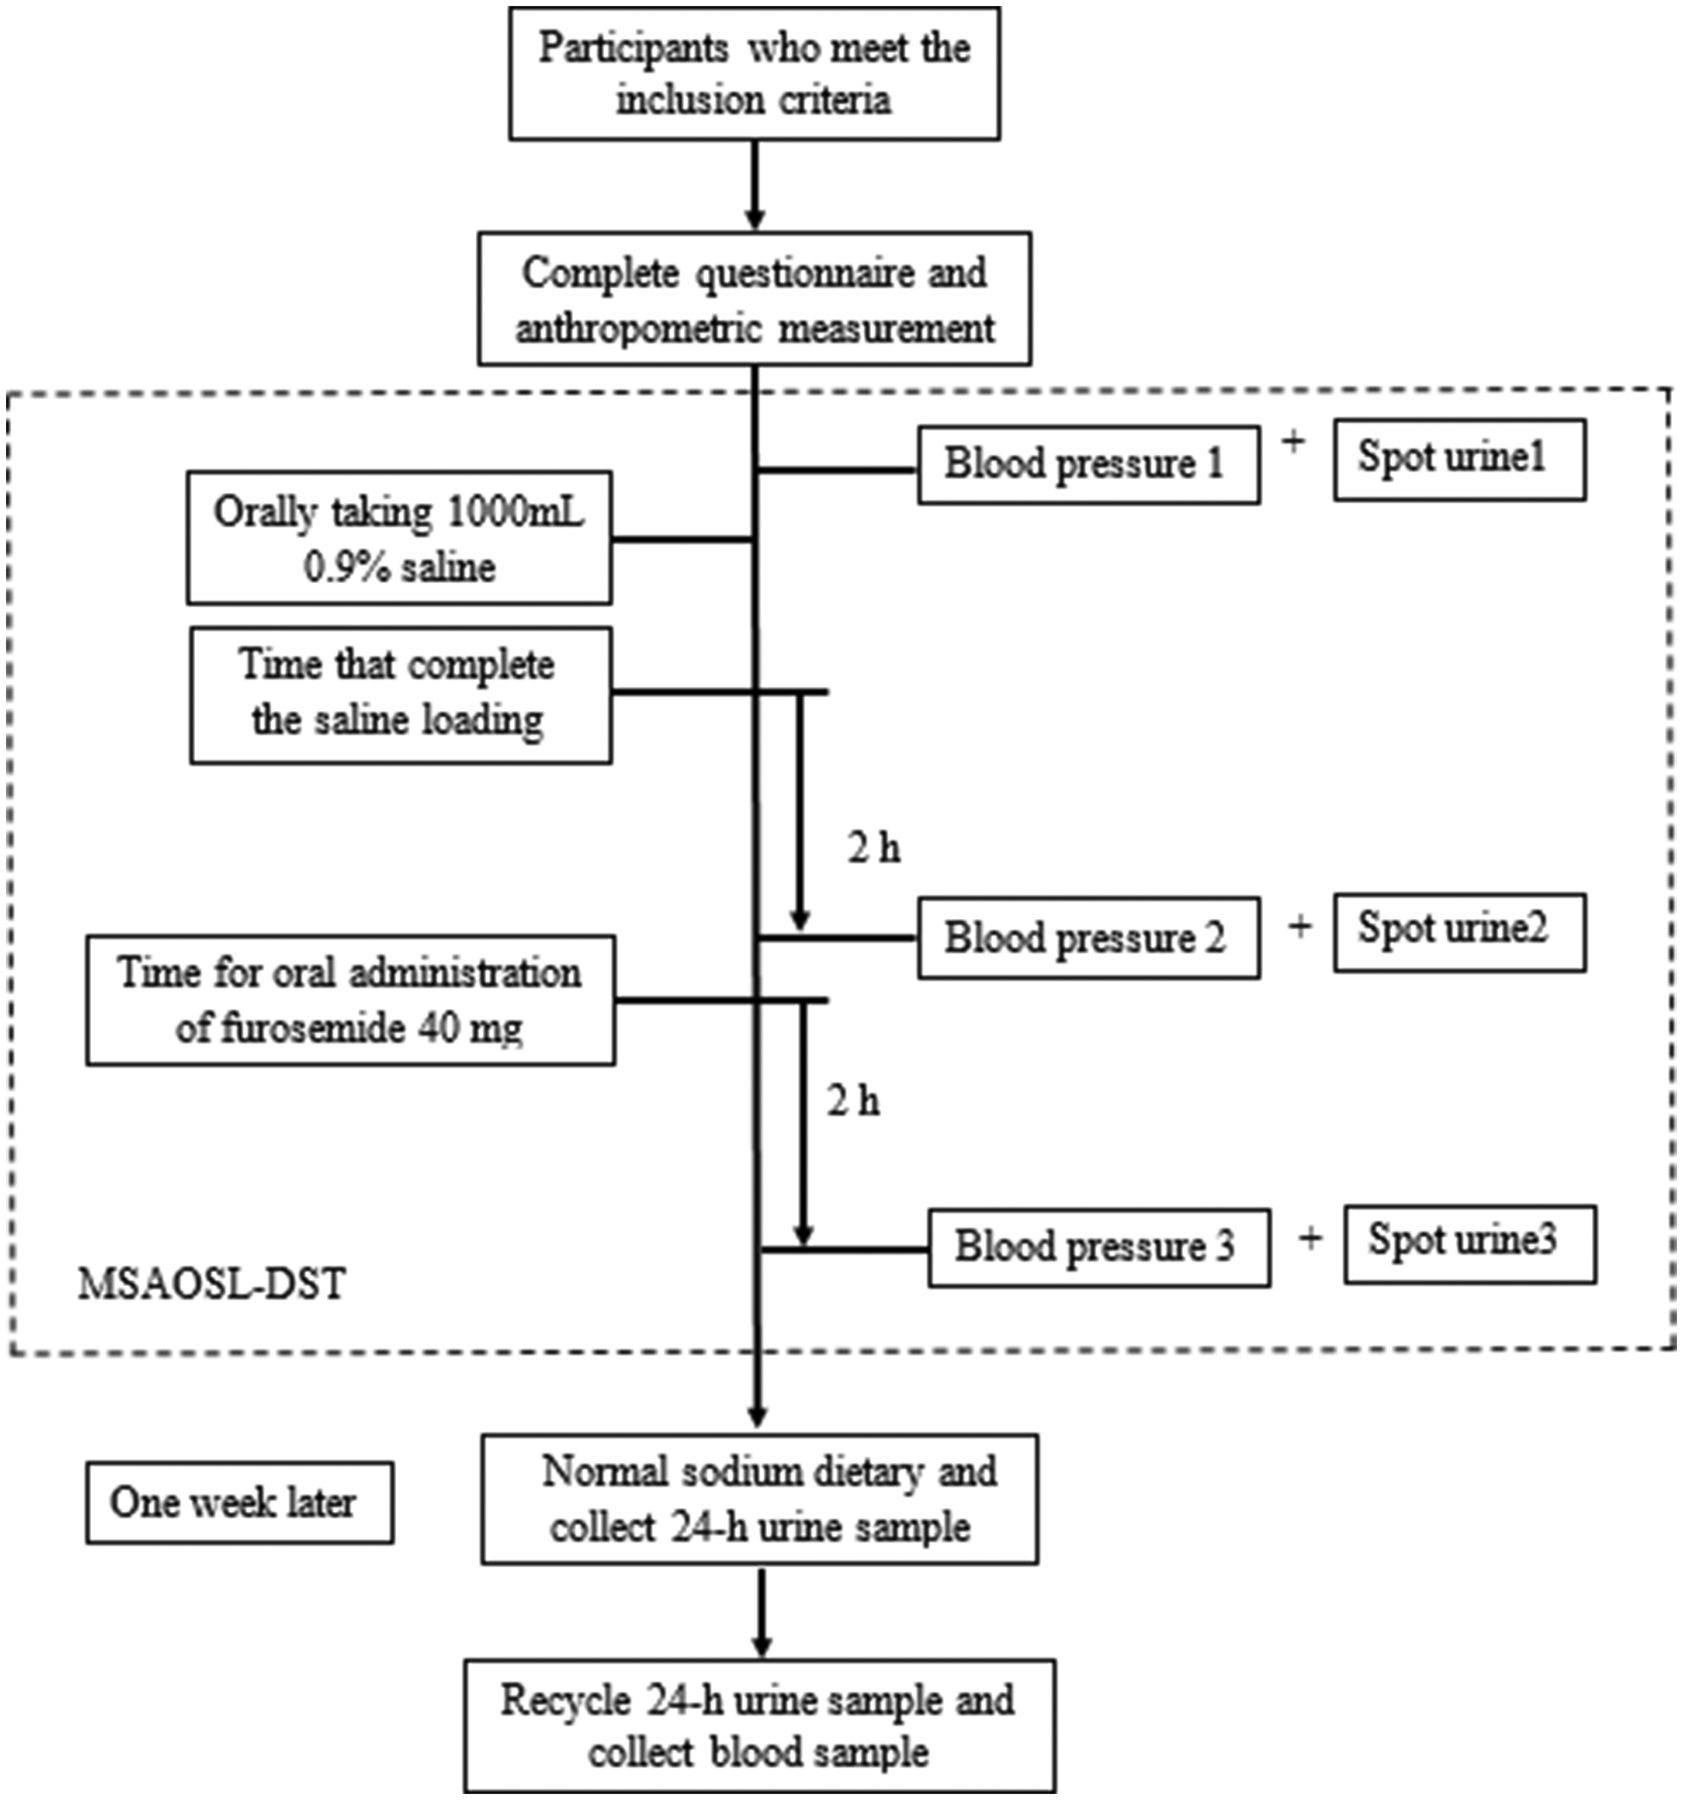
Process of the modified Sullivan’s acute oral saline load and diuresis shrinkage test (MSAOSL-DST).
Questionnaire survey
The participants completed the structured questionnaires through a face-to-face interview under the guidance of trained researchers. The information collected included sociodemographic information (age, gender, ethnicity, marital status, education, occupation, etc), health-related lifestyle information (smoking status, alcohol consumption, physical exercise and dietary habits), self-reported chronic disease (hypertension and diabetes), history of drug use and family history of illness (hypertension, diabetes, cardiovascular disease and cancer).
Anthropometric measurements
The trained examiner carried out simple standardised anthropometric measurements of each participant. The measurements included height, weight, and waist and hip circumference. The participants were asked to take their shoes and coats off for the measurements. The waist:hip ratio was defined as waist circumference (cm) divided by hip circumference (cm). Body mass index (BMI) was defined as body weight (kg) divided by squared height (m2). Obesity was defined as a BMI of 28 kg/m2 or greater.35
Blood pressure was measured with an automatic sphygmomanometer (Omron HEM-7118, Japan) using the American Heart Association method.36 After an initial 5 min rest in the sitting position, blood pressure was measured twice with a 1 min interval between the measurements. The mean value was considered as the final blood pressure value.37 If the difference between the two blood pressure values was greater than 5 mm Hg, then a third measurement was taken after an additional 1 min interval, and the mean value of the last two measurements was recorded as the blood pressure.
According to the 2010 Chinese Guidelines for the Management of Hypertension, the diagnostic standard criteria for hypertension are having a systolic blood pressure (SBP) ≥140 mm Hg and/or a diastolic blood pressure (DBP) ≥90 mm Hg, having been diagnosed with hypertension or having taken antihypertensive drugs in the previous 2 weeks.38
MSAOSL-DST and salt sensitivity of blood pressure
We used the MSAOSL-DST to evaluate the SSBP, which was first used by Sullivan,39 and then modified by Ym et al in 1994 in order to apply it to a large population for epidemiological investigations.40
According to the MSAOSL-DST, subjects take 1000 mL of 0.9% saline solution orally within a 30 min time frame (figure 1). The blood pressure is then measured three times as follows: (1) the baseline blood pressure, (2) 2 hours after sodium loading and (3) 2 hours after diuresis reduction (40 mg). Three mean arterial pressure (MAP) values (MAP1, MAP2 and MAP3) were calculated according to the corresponding SBP and DBP. The MAP was defined as the DBP plus one-third of the pulse pressure. Patients with MAP2−MAP1 ≥5 mm Hg or MAP3−MAP2 ≤−10 mm Hg were diagnosed as salt sensitive, and the other patients were defined as salt resistant.40
Urine sample
Two types of urine samples were taken: spot urine and 24-hour urine. The spot urine samples were collected at baseline, at 2 hours after the salt loading test and at 2 hours after the furosemide dose.
The 24-hour urine samples were collected 1 week after the MSAOSL-DST test, with normal sodium intake during the intervening time. According to the Regional Consultation on Strategies to Reduce Salt Intake from WHO,41 all participants were asked to discard the first voided urine of the day and then to collect all urine samples for the next 24 hours, including the first morning void of the following day. Every participant was given a 5 L plastic container with a lid. To assess for completeness of the 24-hour urine sample, volumes of less than 500 mL were defined as invalid samples.42
All urine samples were used to measure the urine sodium and potassium concentrations with the ion-selective electrode method, carried out automatically by a Cobas C8000 analyser (Roche, Basel, Switzerland).
Based on the 24-hour urine sodium excretion, the formula to assess the daily intake of salt is as follows41:

24hUNaE=24-hour urinary Na+ excretion value (mmol/L)
24hUV=24-hour urine volume (L)
M=molecular mass
Blood samples
Blood samples were collected in the early morning after an 8-hour fast. Trained nurses collected the blood samples from the antecubital vein using vacutainer tubes containing either EDTA or coagulant. The blood samples were immediately stored in insulated containers on ice and were centrifuged, aliquoted and stored at −80°C. The fasting blood glucose was measured via the hexokinase/glucose-6-phosphate dehydrogenase method. The total cholesterol (TC), triglyceride (TG), low-density lipoprotein (LDL) and high-density lipoprotein (HDL) concentrations were determined by enzymatic methods.
Genomics
Genomic DNA was extracted from fasting peripheral blood leucocytes using the Whole Blood DNA Extraction Kit (AU18016) according to the manufacturer’s instructions (BioTeke Corporation, Beijing, China). A NanoDrop 2000 spectrophotometer (Thermo Fisher Scientific, Waltham, Massachusetts, USA) was used to measure the purity and concentration of the isolated DNA. All SNPs were genotyped using high-throughput sequencing methods by a Sequenom Mass ARRAY Platform (Sequenom, San Diego, California, USA). Candidate SNPs were summarised, drawing on four different approaches: tag-SNPs of candidate genes in the pathogenic pathway of salt-sensitive hypertension; literature retrieval of association studies of candidate SNPs; the genome-wide association study results of salt sensitivity; the associated SNPs in 36 miRNAs from our previous study results. In the next phase of our study, we will apply the general multifactor dimensionality reduction method 0.9 using Haploview V.4.0 and genetic risk scores to carry out a combined analysis of the SNPs and to construct prediction models with environmental risk factors to predict SSBP in essential hypertensive and normotensive individuals.
Transcriptomics
We extracted total RNA from whole blood samples with TRI Reagent (Invitrogen, Carlsbad, California, USA), chloroform, isopropanol and 75% ethanol. The total RNA samples were then reverse-transcribed into cDNA, and a Truseq DNA Sample Preparation Kit (Illumina, San Diego, California, USA) was used to construct a cDNA library for next-generation sequencing. The samples were sequenced using an Illumina Hiseq 2000 system (Illumina). DEseq2 and EdgeR were used to identify significantly different miRNA expression. We then screened the candidate miRNAs using the following four criteria: (1) differential expression ratio >2 or <−2; (2) expression levels in salt sensitive hypertension (SSH) or salt-resistant hypertension (SRH) contained more than five copies; (3) miRNAs that were related to pathways involved in hypertension pathology, as determined by literature analysis; (4) miRNAs that had SNPs in the seed region.
To validate the candidate miRNAs that were identified by RNA-Seq, qRT-PCR was performed using the SYBR Green PCR method (Geneskies, Shanghai, China). SnU6 was used as a stable endogenous control. The threshold cycle values (Ct values) were determined from amplification curves. The 2−ΔCt method was used to calculate relative quantitative expression. The differential expression levels between the SSH and SRH groups were analysed by an independent two-sample t-test.
Follow-up
We plan to follow up all participants an additional two times, every 2 years, by telephone and through community health centres. The biennial follow-up will include an interview-based questionnaire survey, laboratory measurements of blood, urinary creatinine, glomerular filtration rate (GFR) and anthropometric measurements to assess whether there has been any cardiovascular event (for those indicated as hypertensive at baseline), renal function changes or whether hypertension has developed (for those indicated as normotensive at baseline).
Statistical methods
All data were input by two independent researchers using EpiData V.3.1 (Epidata Association, Odense, Denmark), and the database was established after checking differences in the two records. Education level was classified according to six categories: illiterate, primary school, junior high school, secondary or high school, college and undergraduate, and graduate and above. These categories were collapsed into two overarching categories: less than a high school education (illiterate and primary school) and high school graduate and above. Smoking status and the consumption of alcohol were assessed using two categories: yes or no. The family history was defined as at least one parent having a history of hypertension or diabetes.
All statistical analyses were performed using SPSS V.19.0 for Windows. The means (±SD) or medians (25% and 75% percentiles) for continuous variables and frequencies for categorical variables were used to describe the characteristics of the study participants. The χ2 test and Mann-Whitney U test were applied for categorical variables and continuous variables, respectively, to assess differences between hypertensive and normotensive individuals. The Cox proportional hazard model and competing risk model were used to analyse the influence of salt sensitivity to cardiovascular disease. Missing data were addressed through the mean imputation method. Statistical significance was defined as p value <0.05.
Quality control
To ensure the quality of the procedures, a community work manual was distributed to all personnel. Prior to the field survey, we had a unified technical training for all staff members that included the purpose and significance of this study, blood pressure measurement methods, anthropometric measurement methods, survey methods of the questionnaire with an electronic form, special requirements in collection, storage, transportation of blood and urine samples, and so on. Moreover, all personnel involved in blood pressure measurement underwent additional training to ensure the accuracy of blood pressure.
The questionnaire survey was conducted with electronic equipment, which could guarantee the data integrity. The non-electronic, original data were processed using EpiData V.3.0 software and double inputted by independent staff. The discrepancy data were rechecked and corrected according to the original data.
Patient and public involvement
The patients and public were not involved in the development of the research questions, outcome measures or study design. The patients were also not involved in the recruitment and performance of the study. The examination results were mailed to the health centres first, and then the personnel of the centres called the patients to simultaneously explain the results and recommend lifestyle changes.
Findings to date
A flow chart of the participant enrolment is shown in figure 2. Overall, 2163 participants from 11 communities in two cities were included in EpiSS, of which 2144 (99.1%) participants completed the questionnaire, while a total of 2120 (98.0%) completed the MSAOSL-DST and 2083 (96.3%) completed the 24-hour urine sample collection. A total of 2057 (95.1%) participants (1061 hypertensive and 996 normotensive) finished all of the investigation steps and were finally enrolled in the analysis, which excluded those who dropped out of the study, did not finish the MSAOSL-DST or did not give a fasting blood sample. More than 95% of the questionnaires, anthropometric measurements, blood pressure measurements and biomedical sample collections were completed. Among the enrolled individuals, 28.3% were classified as SSBP.

Flow chart of participant enrolment. EpiSS, systemic epidemiology of salt sensitivity study; MSAOSL-DST, modified Sullivan’s acute oral saline load and diuresis shrinkage test.
The baseline statistical descriptions of the sociodemographic characteristics, disease prevalence, health-related lifestyle factors, anthropometric information and laboratory measurements are shown in table 3. Data were missing for 23, 99, 20, 4, 75 and 78 participants for cigarette smoking, education, alcohol consumption, obesity, family history of hypertension and family history of diabetes, respectively. The study participants were predominately women, and the median age was approximately 59 years old. In total, 51.6% of the participants were hypertensive, and compared with the normotensive individuals, the hypertensive participants were more likely to be smokers (17.0% were current smokers), have a higher BMI (26.84 kg/m2 for hypertensive, 25.15 kg/m2 for normotensive), be overweight and have a family history of hypertension and diabetes (all with p<0.05). For normotensive individuals, the median waist circumference was 89.00 cm and 84.00 cm for men and women, respectively. For hypertensive individuals, the value was 93.00 cm and 89.00 cm for men and women, respectively, which was significantly higher than that in the normotensive group (p<0.001). The prevalence of diabetes and obesity was higher for the hypertensive group than for the normotensive group.
Baseline sociodemographic characteristics, health-related lifestyle factors, anthropometric information and laboratory measurements
For all the participants, the average serum TC, TG, LDL and HDL were within the normal range. The average serum fasting blood glucose and TG levels were all slightly higher in the hypertensive patients, while the TC and LDL levels were slightly higher in the normotensive group.
The median SBP was 135.00 mm Hg, and the median DBP was 78.50 mm Hg among the entire study population. The SBP (142.00 mm Hg vs 126.50 mm Hg), DBP (82.00 mm Hg vs 74.50 mm Hg) and MAP (102.00 mm Hg vs 91.75 mm Hg) values were significantly higher in the hypertensive group than in the normotensive group (p<0.001).
In total, 2083 participants gave a 24-hour urine sample, and 2071 participants (99.42%) had a valid sample. The mean urine volume, sodium excretion and potassium excretion were higher in the hypertensive group than in the normotensive group. The overall estimated salt intake was 8.01 g/day among the entire study population. Generally, the median salt intake in the hypertensive patients was approximately 2.10 g/day higher than that of the normotensive group (p<0.001). Female participants tended to have a lower salt intake than male participants (p<0.001).
We used MSAOSL-DST to screen for salt sensitivity. A total of 2120 participants completed the test, of which 583 participants were classified as having salt-sensitive blood pressure. The prevalence of salt sensitivity was not significantly higher in the hypertensive group than in the normotensive group (p>0.05).
Strengths and limitations
The strengths of our study include using a systemic epidemiological approach to the enrolment and quality control throughout the study protocol. Trained researchers used uniform and standardised methods of data collection and laboratory testing. The detection bias was therefore reduced by applying all of the above measurements. We were able to analyse the comprehensive risk factors for the effects of salt on blood pressure. The EpiSS study was designed to include patients with hypertension and also to simultaneously compare them with healthy participants so that the results are sufficient for drawing further conclusions. To our knowledge, there is no other report regarding the distribution frequency of salt-sensitive individuals in the Beijing and Liaoning areas, and EpiSS is the largest salt sensitivity study in China that has used the MSAOSL-DST. The next phase of our study will be to screen gene loci and non-coding RNA based on the relevant environmental risk factors.
There were some limitations in our study. The subjects volunteered to participate in the study; we did not use a random sampling method. Additionally, there were more elderly women in communities, so our participants were not representative of the general population. Due to the conditions of the field survey, we were not able to evaluate GFR and creatinine in the baseline. We would like to evaluate these indices in the subsequent follow-up.
Collaboration
The EpiSS study will continue to follow up and collect data to investigate the potential causes of SSBP and the incidence of cardiovascular disease. Researchers who are interested in collaboration are invited to propose environmental and genetic research based on the data available in the EpiSS study or to submit a request for additional data collection. Requests can be submitted via email to the corresponding author (zlilyepi@ccmu.edu.cn).
Acknowledgments
We are grateful to all of the participants and to the entire staff of the community health centres and patient advisers.
References
Footnotes
Patient consent for publication Obtained.
Contributors HQ and BL designed and performed the epidemiology field survey in Beijing and Liaoning Province, carried out staff training, registered the project in the WHO clinical trial platform and wrote the manuscript. HQ, BL, CG, ZL, HC, KL and WS performed the field study and collected and analysed the data. HQ, CG and KL revised the manuscript. LZ obtained funding, supervised the overall study process and revised the manuscript. All authors read and approved the final manuscript.
Funding This work was financially supported by the National Natural Science Foundation of China (grant no. 81373076), the National Key Research and Development Program of China (grant no. 2016YFC0900603), the Natural Science Foundation of Beijing Municipality (grant no. 7172023) and the Importation and Development of High-Caliber Talent Project of Beijing Municipal Institutions (grant no. CIT&TCD201504088).
Competing interests None declared.
Ethics approval EpiSS obtained the approval of the Capital Medical University ethics committee (no. 2013SY22).
Provenance and peer review Not commissioned; externally peer reviewed.
Data sharing statement The datasets collected and/or analysed during the study are available from the corresponding author on reasonable request. We welcome potential collaborators and researchers who are interested in independently investigating specific questions regarding the EpiSS study. Therefore, we hope to receive valuable suggestions from collaborators and researchers in order to obtain the full value from our cohort data.