Article Text

Abstract
Objectives The predictive ability of the STarT Back Tool (SBT) has not yet been examined among acute/subacute back and/or neck pain in a primary care setting in respect to health-related quality of life (HRQoL) and work ability outcomes. The aim of this study was to evaluate the SBT’s predictive validity for HRQoL and work ability outcomes at long-term follow-up in a population with acute/subacute back and/or neck pain.
Setting Prospective data from 35 primary care centres in south Sweden during 2013.
Participants Patients (n=329) with acute/subacute back and/or neck pain, aged 18–67 years, not on sick leave or <60 days of sick leave completed the SBT when applying for physiotherapy treatment. Long-term follow-up measures (median 13 months, range 11–27 months) of HRQoL (EQ-5D) and work ability (Work Ability Score) was completed by 238 patients (72%).
Outcomes The predictive ability of the SBT for HRQoL and work ability outcomes was examined using Kruskal-Wallis test, logistic regression and area under the curve (AUC).
Results Based on SBT risk group stratification, 103 (43%), 107 (45%) and 28 (12%) patients were considered as low, medium and at high risk, respectively. There were statistically significant differences in HRQoL (p<0.001) and work ability (p<0.001) at follow-up between all three SBT risk groups. Patients in the high risk group had a significantly increased risk of having poor HRQoL (OR 6.16, 95% CI 1.50 to 25.26) and poor work ability (OR 5.08, 95% CI 1.75 to 14.71) vs the low risk group at follow-up. The AUC was 0.73 (95% CI 0.61 to 0.84) for HRQoL and 0.68 (95% CI 0.61 to 0.76) for work ability.
Conclusions The SBT is an appropriate tool for identifying patients with a poor long-term HRQoL and/or work ability outcome in a population with acute/subacute back and/or neck pain, and maybe a useful adjunct to primary care physiotherapy assessment and practice.
Trial registration number NCT02609750; Results.
- STarT Back Tool
- health related quality of life
- work ability
- primary care
- back pain
- neck pain
This is an open access article distributed in accordance with the Creative Commons Attribution Non Commercial (CC BY-NC 4.0) license, which permits others to distribute, remix, adapt, build upon this work non-commercially, and license their derivative works on different terms, provided the original work is properly cited, appropriate credit is given, any changes made indicated, and the use is non-commercial. See: http://creativecommons.org/licenses/by-nc/4.0/.
Statistics from Altmetric.com
Strengths and limitations of this study
This is the first study to evaluate the predictive validity of STarT Back Tool (SBT) of the outcomes health-related quality of life and work ability at long-term follow-up in a population with acute/subacute back and/or neck pain.
In this prospective study, we have recruited patients from 35 different primary care centres, where many physiotherapists were engaged.
The predictive validity of the SBT was examined in different ways.
Limited baseline data were available for one part of the study population.
Limitations of the study were the broad variation in time to follow-up.
Introduction
Musculoskeletal pain, especially back pain (BP) and neck pain (NP) are highly prevalent in the general population1 2 causing disability for the individual and high costs for society.3–5 Individuals with BP and NP are mostly managed in primary care6 7 and patients presenting with these conditions are at risk of sickness absence8 and poor health-related quality of life (HRQoL).9 10 To have concurrent BP and NP is also common11 and increases the risk of work disability further in the long-term.12 While most individuals with acute BP improve quickly and return to work,13 for some of them the pain is more severe and lasts for a longer period.14 15 In a Swedish cohort of individuals with BP and NP, about half of the population reported pain and disability 5 years after onset.16 There are recommendations for the use of screening methods in healthcare to identify patients in early stages with the purpose to guide them to the best treatment,17–19 to support staying at work or for enhancing return to work.20 21 The UK National Institute for Health and Care Excellence guidance recommend using brief questionnaires to identify individuals of poor outcomes and stratify care,22 but there is a lack of such tools that can be used in primary care. The widely used STarT Back Tool (SBT)23 is a brief risk stratification tool that includes nine questions on predictors for long-term disabling BP, in order to match individuals to appropriate targeted treatments, according to their prognostic profile. Using the SBT together with targeted treatment pathways has shown improved efficiency regarding patients’ clinical outcomes and reduced healthcare costs in the UK.24 The SBT is cross-culturally adapted and validated in Swedish25 and recently also for a population with both BP and NP in primary care.26 The SBT is developed and validated to predict future disability due to low BP of any duration,23 27–30 but it has not yet been studied for the outcomes of HRQoL and work ability for a population with acute/subacute BP and NP in primary care. The aim of this study was therefore to evaluate the predictive validity of SBT of the outcomes HRQoL and work ability at long-term follow-up in a population with acute/subacute BP and/or NP.
Methods
Design
We conducted a prospective psychometric validation study with long-term follow-up. The sample was identified in connection to a randomised clinical trial (RCT) in a primary care setting (ClinicalTrials.gov ID: NCT02609750).
Participants and procedure
Participants were consecutively recruited between January 2013 and January 2014 from 35 primary care centres in the southern parts of Sweden, as part of an RCT.31 Patients who all applied for physiotherapy treatment on self-referral due to an episode of acute/subacute (<12 weeks) BP and/or NP, who were not currently on sick leave or had been on sick leave for <60 days and who had been working ≥4 consecutive weeks last year were asked to participate. It could be either a first episode or a recurrent episode of BP and/or NP after a period of at least 3 months of no substantial pain. Patients who were pregnant, had severe pathology (‘red flags’)32 or were not able to understand the Swedish language were not eligible to participate. At baseline, patients completed the ‘ÖMPSQ-short’,33 which was used for screening for inclusion to the RCT (≥40 points)31 and the SBT, which was administered only for the purpose of psychometric testing. Thereafter, the SBT was not actively used by the physiotherapists or any other professionals. In all, 329 patients completed the SBT questionnaire and formed the population of this psychometric study. Patients who were older than 67 years or younger than 18 years (n=3), declined participation (n=4), had any missing item on the SBT (n=11) or those who were lost to follow-up (n=73) were excluded. The final study population (n=238) consisted of patients included in the RCT (RCT intervention, n=61 and RCT control, n=99) and patients not included in the RCT (n=78). The analyses were restricted to those who had complete data for work ability (n=235) and HRQoL (n=238) outcomes at long-term follow-up. The reason we included both RCT and not RCT patients was to ensure as broad a sample as possible for this SBT predictive validity study. RCT patients received either structured physiotherapy treatment with a workplace intervention (RCT intervention) or structured physiotherapy without a workplace intervention (RCT control)31 and were followed up at the planned 12 months follow-up. Not RCT patients received usual primary care and were followed up by postal questionnaires. Data from all questionnaires were manually entered into a SPSS V.22.0 database and were thoroughly checked and validated. All questionnaires were scored, and missing items handled, according to the methods specified by the instrument developers.
Baseline data
Baseline questionnaire data included type of treatment received (RCT intervention, RCT control or usual primary care) and self-reports of SBT, age and gender.
STarT Back Tool
The SBT is a 9-item questionnaire with questions relating to modifiable physical (item 1–4) and psychosocial (item 5–9) risk factors for long-term disabling BP, designed to support clinicians in directing individuals to different levels of care.23 The SBT has three risk subgroups which classifies patients into low, medium or high risk for poor disability outcomes. The SBT overall score ranges between 0 and 9. Item 1–4 is about referred leg pain, neck or shoulder pain, difficulties in walking and difficulties in dressing. Item 5–9 form the psychosocial subscale, which screen for fear of physical activity, anxiety, pain catastrophising, depressive mood and overall impact from their BP. Items 1–8 have a dichotomous response option; ‘disagree’ (0 p) or ‘agree’ (1 p). Item 9 uses a 5-point Likert scale from ‘not at all’ to ‘extremely’, where responses ‘very much’ or ‘extremely’ are counted as one point and the other responses as zero. A total score of ≤3 points indicates low risk, a total score ≥4 points in combination with <4 points on the psychosocial subscale (item 5–9) are medium risk and a psychosocial subscale score of ≥4 points indicates high risk for poor disability outcomes.23
Long-term follow-up data
Health-related quality of life
HRQoL was measured by the EuroQol five-dimension (EQ-5D, 3 L) questionnaire,34 which is a generic, HRQoL instrument.35 36 The EQ-5D comprises the EQ descriptive system which has five dimensions: mobility, self-care, usual activities, pain/discomfort and anxiety/depression. The digits for the five dimensions are combined in a 5-digit number describing the respondent’s health state.37 The 5-digit number is given a value between −0.59 and 1.0 according to the UK tariff,38 where 1 corresponds to full health and lower EQ-5D values reflect lower HRQoL. HRQoL was also dichotomised into ‘poor’ HRQoL (EQ-5D<0.6) and ‘good’ HRQoL (EQ-5D≥0.6), based on a proposed cut-off for having sufficient capacity to be able to work for a population with BP and NP.39
Work ability
Work ability was measured by self-reports on the single item question (‘current work ability compared with the lifetime best’) from the Work Ability Index (WAI).40 41 This first item in the WAI is known as the ‘Work Ability Score’ (WAS).42 It consists of a scale from 0 representing ‘cannot work at all right now’ to 10 representing ‘my work ability as at its best right now’ and has been proposed to be used as a simple indicator for assessing the status and progress of work ability.43 44 Work ability was also dichotomised using a previously published cut-off score43 into ‘poor’ work ability (WAS <8 points) and ‘good’ work ability (WAS ≥8 points).
Statistical analyses
SPSS V.22.0 was used for all analyses. We used a non-parametric approach which was chosen based on the distribution of the data. Descriptive data on the study population was presented for the total population and for each SBT risk group. We separately evaluated the SBT-specific risk groups and also the SBT overall score.
Predictive performance of the SBT
First, cross-tabulations were used to describe the proportion of participants in each SBT risk group that had poor outcome in long-term follow-up for each outcome. The Kruskal-Wallis test was used to study if there were any differences between the SBT risk groups on follow-up data on HRQoL and work ability (median), respectively. Potential differences were confirmed with Mann-Whitney U test. Χ2 test for trend was used to confirm potential differences concerning poor or good HRQoL and work ability.
Second, we calculated the ORs (95% CIs) for SBT risk groups to predict poor HRQoL (EQ-5D<0.6) and poor work ability (WAS<8) using binary logistic regression. Independent variables age, sex, treatment group and time to follow-up were also included in the analysis. We built a multiple logistic model where all independent variables were entered together with the SBT risk groups. For SBT, we used the SBT low risk group as the reference group and for treatment groups (RCT intervention n=61, RCT control n=99, not RCT n=78), we used the ‘not RCT group’ as the reference group. The significance level was set at 5%.
Third, we evaluated the ability of the SBT overall scores (0–9 points) to discriminate between individuals with poor or good HRQoL/work ability in long-term follow-up. For that purpose, we used the area under the curve (AUC) statistics from receiver operating characteristic (ROC) curves.45 The strength of discrimination was set according to the following descriptors: 0.7 to <0.8 acceptable discrimination, 0.8 to <0.9 excellent discrimination, and ≥0.9 outstanding discrimination.46
In addition, the predictive validity of the SBT risk group cut-offs (low/medium and medium/high) was assessed by calculating sensitivity, specificity, positive predictive values (PPV), negative predictive values (NPV) and positive and negative likelihood ratios (LRs) against long-term HRQoL and work ability outcomes. The SBT risk group cut-offs (low/medium and medium/high) were used in line with the original study.23 The PPV is the probability that a poor outcome is present when the test is positive and the NPV is the probability that a good outcome is present when the test is negative. Higher positive LRs and lower negative LRs indicate better discrimination. LRs >5 or <0.2 are generally seen as supporting a strong test, whereas values close to 1 indicate poor test performance.47
Patient and public involvement
Relevant patient organisations were involved in the development and design of the RCT, where this study was embedded. For this psychometric study, no patients were involved. The results of this study will be disseminated to study participants by the use of SBT in primary care.
Ethics
Prior to inclusion, all patients obtained written information about the purpose of the study and each individual gave informed consent to participate in the study (opt-out). The principles of the Declarations of Helsinki were followed.
Results
Study population
The inclusion and exclusion of participants in the study is presented in a flow chart (figure 1).
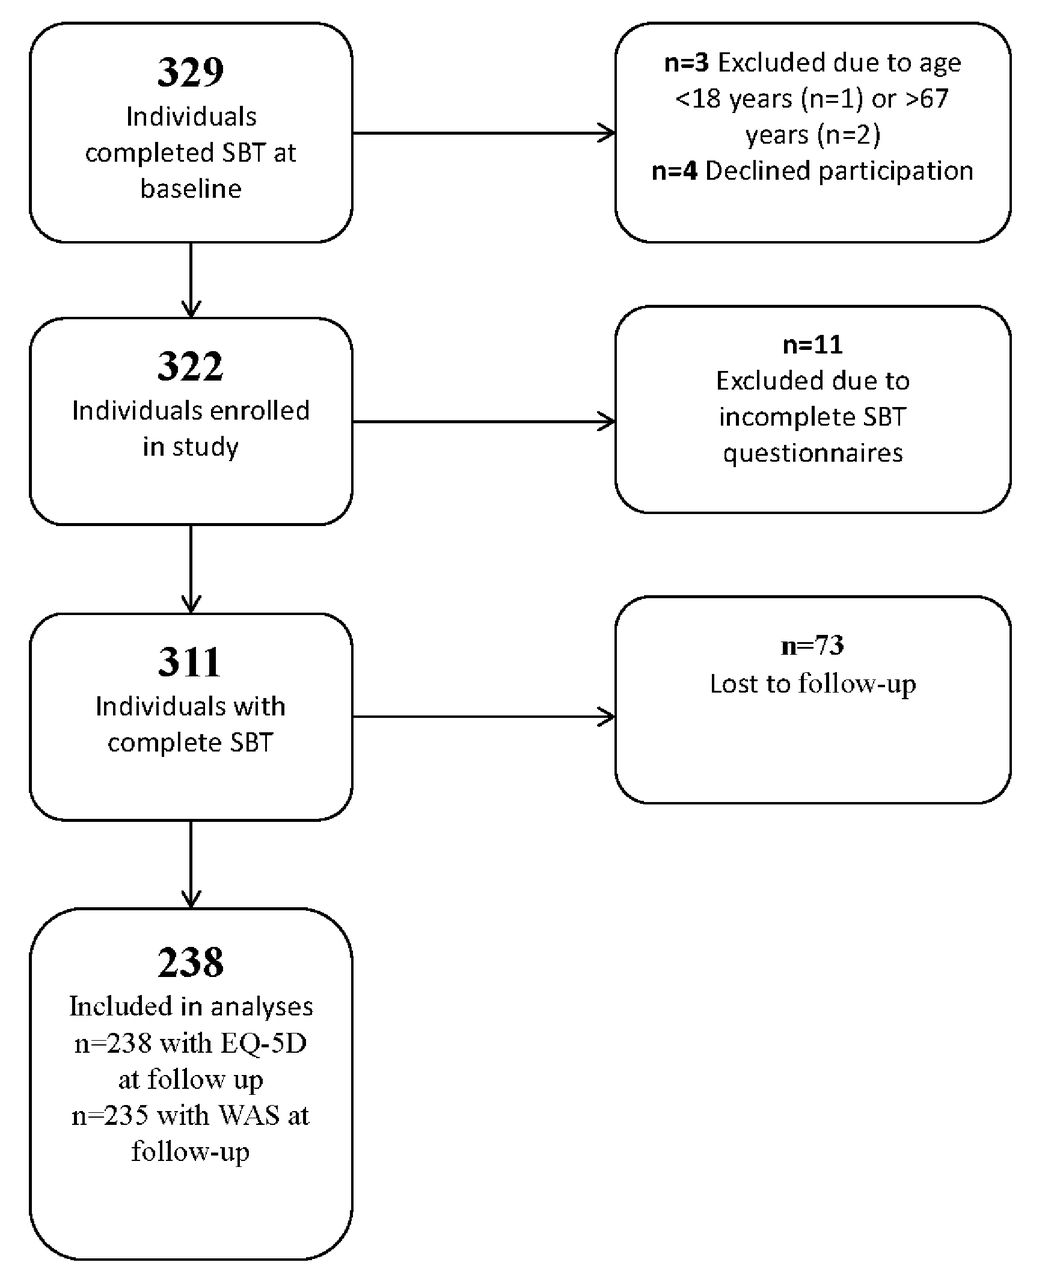
Flow chart of inclusion and exclusion of participants. EQ-5D, EuroQol five-dimension; SBT, STarT Back Tool; WAS, Work Ability Score.
The final sample consisted of 238/329 patients (72%) including 160 (67%) females and 78 (33%) males. Baseline characteristics of the study population are summarised in table 1. The patient sample included 103 (43%) patients at low risk, 107 (45%) patients at medium risk and 28 (12%) patients at high risk. The median time to long-term follow-up was 13 (range 11–27) months. For RCT patients, the median time to follow-up was 12 months (range 11–19) and for not RCT patients, the median time was 22 months (range 16–27).
Baseline characteristics of the study population—total population and stratified by SBT risk groups
Predictive performance of the SBT
There were statistically significant differences in the distribution of HRQoL scores (n=238) between the SBT low, medium and high risk groups at long-term follow-up (p<0.001) and the proportion of patients with poor HRQoL (EQ-5D<0.6) was significantly higher in higher risk groups (low risk 4%, medium risk 11%, high risk 36%) (p<0.001) (table 2). We also found differences in the distribution of work ability (WAS) scores (n=235) between the SBT low, medium and high risk groups at long-term follow-up (p<0.001) and the proportion of patients with poor work ability (WAS <8) was significantly higher in higher risk groups (low risk 22%, medium risk 35%, high risk 68%) (p<0.001) (table 2).
Health-related quality of life and work ability at long-term follow-up—total population and stratified by SBT risk groups
The regression analysis showed that the SBT high risk group could significantly predict poor HRQoL (OR 6.16, 95% CI 1.50 to 25.26, B=1.82, p=0.012) and poor work ability (OR 5.08, 95% CI 1.75 to 14.71, B=1.62, p=0.003) at long-term follow-up also after adjusting for age, sex, treatment and time to follow-up (table 3). Our regression model was well adapted to the data material as a non-significant p value >0.05 of the test by Hosmer and Lemeshow indicates that the model is good48 (table 3).
The ability of the SBT risk groups to predict poor HRQoL* and poor work ability† at long-term follow-up
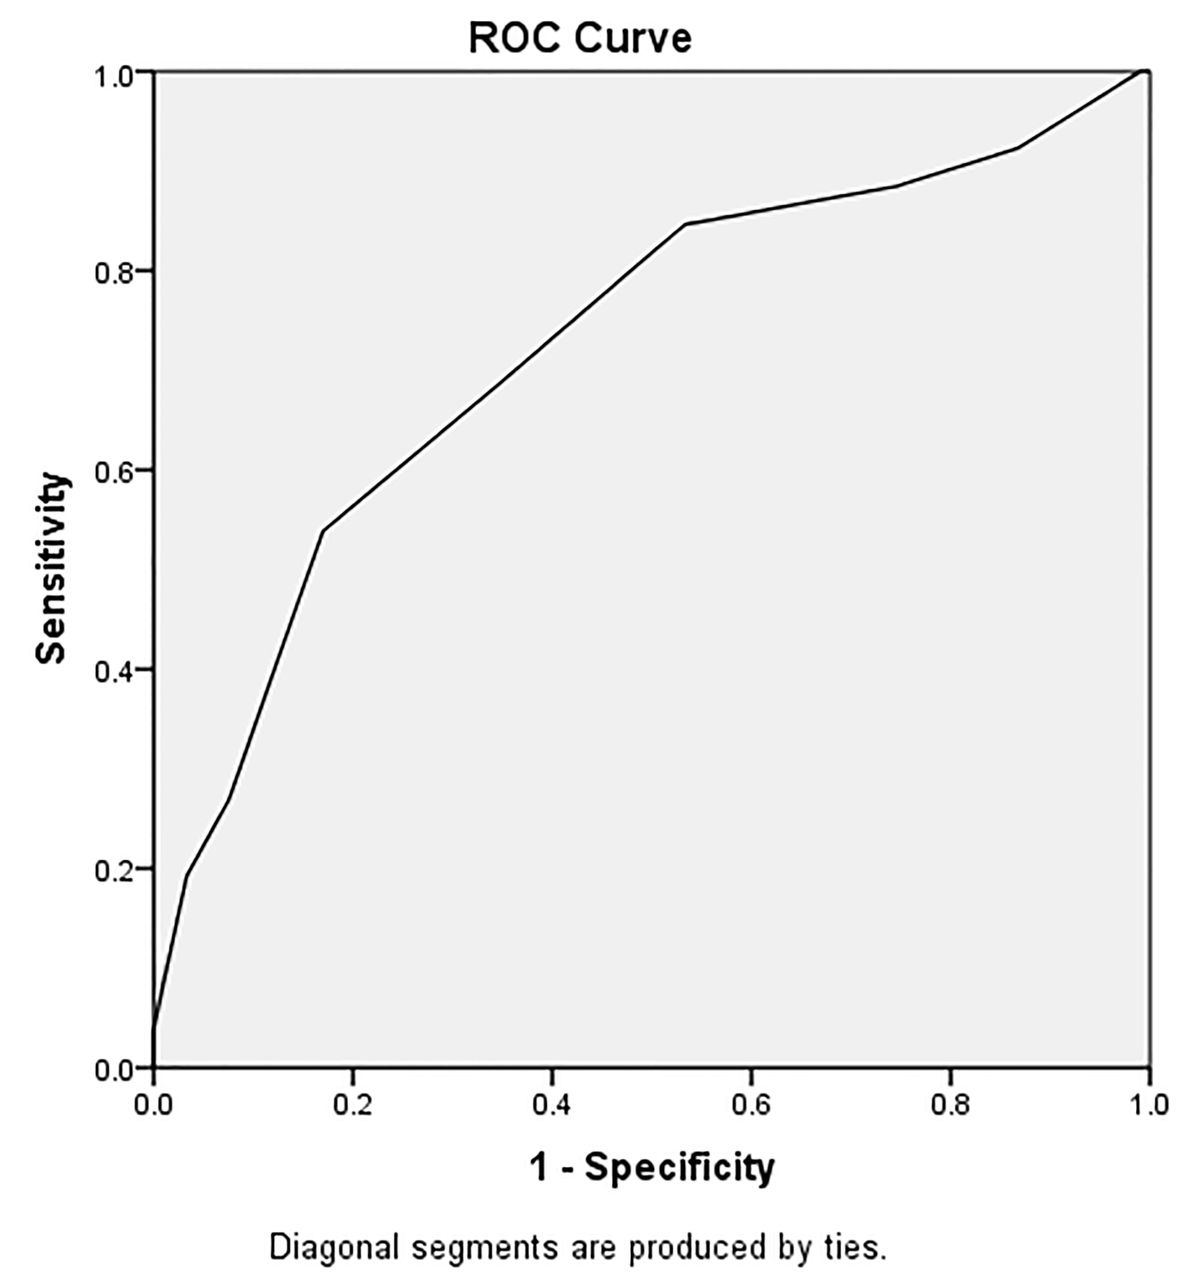
Regarding the ability of the SBT total scores (0–9 points) to discriminate between individuals with poor or good HRQoL at long-term follow-up, the AUC was 0.73 (95% CI 0.61 to 0.84), which was ‘acceptable’ (≥0.7) (figure 2). For work ability, the AUC was 0.68 (95% CI 0.61 to 0.76), which was just below the limit (≥7) for acceptable discrimination (figure 3).

AUC and ROC curve for overall STarT Back Tool scores to discriminate between individuals with poor health-related quality of life (EQ-5D<0.6) in long-term follow-up. Each point on the ROC curve has a corresponding cut-off value. The area under the ROC curve was 0.73. AUC, area under the curve; EQ-5D, Euroqol 5-dimension questionnaire; ROC, receiver operation characteristic.

AUC and ROC curve for overall STarT Back Tool scores to discriminate between individuals with poor work ability (WAS<8) in long-term follow-up. Each point on the ROC curve has a corresponding cut-off value. The area under the ROC curve was 0.68. AUC, area under the curve; EQ-5D, Euroqol 5-dimension questionnaire; ROC, receiver operation characteristic.
The sensitivity, specificity, PPV, NPV and LRs for the SBT risk groups for HRQoL and work ability are presented in table 4. The LRs+ were higher and the LRs− were lower for HRQoL outcomes compared with work ability outcomes which indicate better discrimination of the SBT for poor HRQoL compared with poor work ability (table 3).
Discriminative ability of the SBT risk group cut-offs (L/M and M/H) to predict poor HRQoL and poor work ability in long-term follow-up
Discussion and conclusions
This is the first study to evaluate the predictive validity of SBT for HRQoL and work ability outcomes at long-term follow-up in a population with acute/subacute BP and/or NP. The findings of this study support the ability of the SBT risk groups to predict future poor HRQoL or poor work ability, for patients presenting with an episode of acute/subacute BP and/or NP in primary care. Individuals classified as SBT high risk had a significantly increased risk of having poor HRQoL (OR 6.2) and poor work ability (OR 5.1) in the long-term compared with individuals classified as SBT low risk. The population studied was relatively homogenous including only patients with acute or subacute pain, not individuals with chronic pain. This study population differs from the original UK development population for SBT by excluding chronic BP and including NP. As might be expected, the distribution between the SBT risk groups at baseline differed compared with the UK development population.23 In our study population, the percentage of individuals at high risk was lower (12%) compared with the original UK sample (15%),23 which may be due to our sample including patients with acute/subacute pain. However, there is still a clear and statistically significant difference in HRQoL and work ability outcomes between the three risk groups in the expected direction in our Swedish sample.
Strengths of this study include the prospective design of a well-characterised group of individuals from 35 different primary care centres. The SBT was used and administered by many different physiotherapists which makes this setting real and clinically relevant. Another strength is that we analysed the predictive validity in different ways, for example, we studied both the established SBT risk groups and the SBT overall score to predict the outcomes of HRQoL and work ability. We also analysed the outcomes HRQoL and work ability both on the continuous scale (Kruskal-Wallis) and as dichotomised (logistic regression).
A weakness of this study is that we had limited access to baseline data from patients not included in the RCT (n=78/238) compared with RCT patients (n=160/238). For not RCT patients, we did not have access to baseline data from HRQoL and work ability questionnaires. For that reason, we were not able to do comparative analyses on baseline and follow-up data. When recommending tools for use in primary care settings, preferably they should have been validated in large trials within this specific setting. However, as is the case with this study of the SBT, information from smaller studies is still of scientific value. We accept that our study population (n=329) is unlikely to be representative of all individuals consulting primary care for acute/subacute BP and/or NP. However, even if they are a selected group of participants, we do not think that this will have substantially affected the psychometric validation questions examined in this study.
The time to follow-up varied between patients in our study which may have influenced the results. The optimal time point for identifying patients at risk of developing persistent BP may vary and is a forum for discussion.49 In our study, two-third of the study population (n=160) were in the RCT and were followed up at a planned physiotherapy visit at 12 months. For not RCT patients (n=78), the ambition was also to follow-up at 12 months but these patients were followed up with postal questionnaires and due to practical reasons there were a wider variation on the time for follow-up. This is of course a limitation, but did not have impact on the results in the regression analyses. However, we had access to information about tentative confounding factors and we investigated several of these factors (age, sex, treatment and time to follow-up) that may have potentially influenced the prognostic ability of the SBT. In this study, we included both patients with NP and BP. Since this group of patients often have concurrent pain from the back or neck,11 we decided to not include this in the regression analysis. In another SBT non-stratified primary care setting where they studied different influences (care setting, episode duration and time to follow-up) on the prognostic ability of the SBT for disability outcomes50 they found that the only factor that modified the prognostic ability of the SBT risk groups was episode duration with SBT being less predictive in very acute patients (<2 weeks duration).
The ability of the SBT overall score to discriminate between patients with poor or good HRQoL and work ability differed slightly between the two outcomes with a slightly better discrimination for HRQoL (0.73) than for work ability (0.68). The AUC values are not very high, but still around 0.7, which is considered as acceptable.46 In a recent systematic review, Karran et al 51 investigated how well prognostic screening instruments for BP, including the SBT, discriminate between patients who develop a poor outcome and those who do not.51 Prognostic screening tools tend to perform poorly at assigning higher risk scores to individuals who develop chronic pain compared with those who do not and they also tend to predict disability outcomes better than most other outcomes.51 The discriminative performance of SBT for work ability outcomes in this study (AUC 0.68) was higher than for other prognostic tool’s reported abilities to discriminate pain outcomes (pooled AUC=0.59)51 and the SBT discriminative performance for HRQoL outcomes in this study (AUC 0.73) was in line with the pooled disability predictive performance (pooled AUC=0.74). In comparison to the original UK sample and a Danish sample in primary care, where participants had variable duration of BP and the primary outcomes were disability at 3 months follow-up,23 28 the predictive ability of the SBT in our study was not as strong as in the UK population (AUC 0.81) but similar to the Danish population (AUC 0.71). In our study, as in the Danish study, the physiotherapy treatment was not targeted to SBT risk groups and treatment was therefore likely to be heterogeneous. A variation of values are expected as the AUC (derived from the ROC curve: sensitivity/1−specificity), depends on the characteristics of the population and possible explanations might be cultural and differences in treatment. Another possible explanation in variation of AUC values may be that a ROC curve analysis requires dichotomisation of outcomes and the definitions of poor outcome may also have affected the results. The discriminative ability of the SBT risk groups to predict poor HRQoL and work ability outcome was affected of how the three risk groups were merged and dichotomised (low vs medium/high or low/medium vs high). Similar differences in discrimination were also found in the original study for disability outcomes.23 But regardless of which cut-off that was used, the results of the LRs indicate a slightly better discrimination of the SBT for poor HRQoL than for poor work ability and that the NPVs were consistently high for both outcomes which indicate a high probability that a good outcome is present when patients are classified as low risk. The proportion of patients with poor HRQoL and poor work ability was significantly higher in higher SBT risk groups at long-term follow-up, but not all patients were correctly classified. When patients are misclassified as low risk they may be undertreated and when patients are misclassified as high risk they may be overtreated. It is important for clinicians to be aware of the potential of misclassification as costs for misclassification and overtreatment of patients with a good prognosis can be high24 and also detrimental in patients with acute BP.52
The EQ-5D was applied to measure HRQoL because it has been found to have good prediction of return to work and the cut-off ≥0.6 on EQ-5D has been proposed to be a limit for having sufficient capacity to work for patients with BP and NP.39 Another cut-off has been used in a study of patients with musculoskeletal pain taking part in a national rehabilitation programme in Sweden where ≥0.5 on EQ-5D at start showed reduced sick leave days after the rehabilitation.53 Our population had a median EQ-5D score of 0.80, which is just below the mean scores for a Swedish normal population (0.84).54 The fact that our sample included patients at an early stage of their pain (acute/subacute) with no or short time of sick leave may have influenced the high level of HRQoL in our study sample. To measure work ability, we used the WAS which is the first item in the WAI, a widely used questionnaire for measuring the health and functional capacity dimension of work ability.41 The cut-off (WAS<8/≥8) chosen in this study represents poor or moderate (poor) and good/excellent (good) work ability based on the same categorisation as for the whole WAI.42 The WAS has shown to be a good alternative to the whole WAI,43 even though the whole WAI is superior compared with its individual items.55
SBTs concurrent validity has earlier been studied for patients with BP and/or NP26 and a modified SBT have been tested to predict physical health outcome, using the SF-3656 but this was the first time the predictive validity of the SBT was studied for the outcomes of HRQoL and work ability for individuals with both BP and NP. Therefore, this study widens the usefulness of the SBT compared with earlier studies.23 57–60 There is also need for short questionnaires that are easy to use in clinical to distribute and interpret, especially in primary care. The SBT is primarily designed as a ‘stratified care tool’, which involves targeting treatment to subgroups of patients based on their key characteristics61 but in this study, we wanted to study if the SBT could predict the important outcomes HRQoL and work ability when applied in an RCT of NP and BP. In this study, the physiotherapists did not target treatment based on SBT. However, we accept that some of the constructs within the SBT may have been addressed by the intervention provided, which may have affected SBTs ability to predict the above-mentioned outcomes. The results of this study suggest that the SBT can be used as a prognostic tool in primary care for subgroup identification of acute/subacute BP and/or NP patients at risk of poor long-term HRQoL and/or work ability outcome. This information about important risk factors may help clinicians in primary care to develop personalised treatment strategies which are a priority in research.62 Future studies are required to investigate whether the implementation of screening together with matched treatment pathways have an effect on HRQoL and work ability outcomes for these patients.
Acknowledgments
The authors would like to thank Senior statistician Mikael Åström for statistical support, data manager Chanchai Manuswin and the staff at Data analysis and Register Centre, Region Skåne, Lund, Sweden, the research team at the Institute of Primary Care and Health Sciences, Keele University, Stoke-on-Trent, UK and the staff at the Blekinge Centre of Competence, Karlskrona, Sweden for help with support. The authors would also like to thank all physiotherapists and patients involved in this project, including the WorkUp project, REHSAM, in Region Skåne, Region Kronoberg and Landstinget Blekinge, Sweden, for their help with data collection.
References
Footnotes
Contributors All authors discussed the results and commented on the manuscript. MF, IP, KS and BG were responsible for the study design, data analysis and interpretation. MF, BG and KS prepared and validated data. MF collected data and drafted the manuscript. JH and CPS took part in study design, data analysis and interpretation of data. All authors read and approved the final version of the manuscript.
Funding This work was supported by The Scientific Committee of Blekinge County Council, Sweden (Dnr 2017-00686) and the County Councils Region Skåne, Kronoberg and Blekinge, REHSAM research, Sweden (RS2011/005).
Competing interests None declared.
Patient consent Not required.
Ethics approval The study was approved by the Regional Ethical Review Board in Lund, Sweden (Dnr 2012/497, 2013/426, Dnr 2015/214).
Provenance and peer review Not commissioned; externally peer reviewed.
Data sharing statement The datasets analysed during the current study are available from the corresponding author on reasonable request.