Article Text

Abstract
Objectives To identify a group of palliative care doctors who perform well on a prognostic test and to understand how they make their survival predictions.
Design Prospective observational study and two cross-sectional online studies.
Setting Phase I: an online prognostic test, developed from a prospective observational study of patients referred to palliative care. Phase II: an online judgement task consisting of 50 hypothetical vignettes.
Participants All members of the Association of Palliative Medicine (APM) were eligible (n=~1100). 99 doctors completed the prognostic test and were included in the phase I analysis. The top 20% were invited to participate in phase II; 14/19 doctors completed the judgement task and were included in the phase II analysis.
Measures Phase I: participants were asked to give a probability of death within 72 hours (0%–100%) for all 20 cases. Accuracy on the prognostic test was measured with the Brier score which was used to identify the ‘expert’ group (scale range: 0 (expert)–1 (non-expert)). Phase II: participants gave a probability of death within 72 hours (0%–100%). A mixed model regression analysis was completed using the percentage estimate as the outcome and the patient information included in the vignettes as the predictors.
Results The mean Brier score of all participants was 0.237 (95% CI 0.235 to 0.239). The mean Brier score of the ‘experts’ was 0.184 (95% CI 0.176 to 0.192). Six of the seven prognostic variables included in the hypothetical vignettes were significantly associated with clinician predictions of death. The Palliative Performance Score was identified as being the most influential in the doctors’ prognostic decision making (β=0.48, p<0.001).
Conclusions This study identified six clinical signs and symptoms which influenced the judgement policies of palliative care doctors. These results may be used to teach novice doctors how to improve their prognostic skills.
- oncology
- adult palliative care
- palliative care
This is an open access article distributed in accordance with the Creative Commons Attribution Non Commercial (CC BY-NC 4.0) license, which permits others to distribute, remix, adapt, build upon this work non-commercially, and license their derivative works on different terms, provided the original work is properly cited, appropriate credit is given, any changes made indicated, and the use is non-commercial. See: http://creativecommons.org/licenses/by-nc/4.0/.
Statistics from Altmetric.com
Strengths and limitations of this study
The methodology adopted in this study enabled a direct comparison between the accuracy of different doctors’ estimates of imminent death; this has not been done before.
The approach that was taken in this study to quantify and objectively measure the ability of the ‘expert’ group was significantly more thorough than anything which has been done before and is preferable to simply assuming that years of experience or seniority are synonymous with expertise.
Judgement analysis offers a methodology to unpick clinical decision making, clinical intuition or ‘gut instinct’, regarding how doctors recognise which patients are dying.
The prognostic test may have lacked some face validity as the participants were not able to visually assess the patients. However, this lack of visual assessment was compensated for by the increased utility that arose from being able to compare numerous different doctors’ performances on the same prognostic test.
Background
The Liverpool Care Pathway (LCP) was a care plan developed to improve care at the end of life. It was withdrawn from use in the UK following criticism from some members of the public, healthcare professionals and the media. One of the concerns expressed was that the recognition of imminent death was often inaccurate1–3 and therefore some people were being inappropriately regarded as being in the terminal phase of their illness when they were not in fact ‘imminently’ dying. Following withdrawal of the LCP, the National Institute for Health and Care Excellence (NICE) published a clinical guideline, ‘Care of dying adults in the last days of life’ (2015). The guidance began by advising clinicians what to do if, ‘it is thought that a person may be entering the last days of life’. However, although this important first step in the process relies on clinical judgement, the guideline itself provided no advice about how clinicians should develop or hone their prognostic instincts.
Clinical judgement is subjective and as such it is difficult to investigate. Experts are often unable to articulate how their decisions are formulated.4 5 This means that it would not be very informative to simply ask expert palliative care doctors how they recognise which patients are imminently dying. They are unlikely to have a clear insight into how they actually make prognostic decisions and are more likely to simply report that they ‘just know’.4 Before being able to untangle the clinical skill of recognising the dying phase, it is necessary to establish a means of identifying which doctors, if any, are more accurate at prognosticating. It is usual in decision-making research to simply select experts on the basis of their seniority or years of experience.5–7 However, previous research has suggested that more experienced doctors are not necessarily the best prognosticators.8 9 Indeed, there is currently no objective mechanism for identifying which doctors are better prognosticators than others. We therefore decided to develop a prognostic test.
Once a group of experts has been identified, Social Judgement Theory offers a way to understand how these clinicians make decisions; using the ‘lens model’10 adapted to a medical field.11 Figure 1 shows a visual representation of this medical lens model. The left side of the lens model represents the ‘ecological validity’, which was defined as ‘the degree of correlation between the cues presented (patient information) and the event occurring (death)’.10 In the centre is the information presented (the cues) within the chosen environment (here, medical environment), and on the right hand side is the judges’ decision (the doctor’s judgement of the patient’s health). The ‘achievement arc’ is the relationship, or accuracy, between the doctor’s judgement and the patient event.

The lens model adapted to a medical decision.11
Judgement analysis aims to understand how decisions are made, this knowledge can then be shared with other people who might want to make decisions in a similar manner.10 12 13 The decision-making process (or judgement) is analysed by asking experts to assess a series of cases, or vignettes, in which a number of factors (or cues) are presented at various levels of severity. Presenting information in this manner allows the correlation between the various cues and the experts’ judgement to be statistically modelled. The different cues used by each expert and the relative weight given to each of those factors are referred to as that expert’s ‘judgement policy’.14 Judgement analysis has previously been applied successfully in other healthcare settings such as in the diagnosis of a heart failure by general practitioners,15 in risk assessment of nurses16 and in driving recommendations of occupational therapists.12
Aim
The purpose of this study was to identify how palliative care doctors, who perform well on a prognostic test, make predictions about which patients are imminently dying.
The aim was achieved through the following objectives:
The identification of a group of doctors who perform well on a prognostic test of imminent death.
Modelling the prognostic decisions of this group to understand what information was most important for the identification of dying patients, in a second prognostic task.
Method
Overview
The study consisted of two distinct phases each involving separate prognostic tasks. In phase I, participants were invited to complete a prognostic test based on summaries of real cases. In phase II, the best performers from the prognostic test were invited to complete a judgement analysis task consisting of a further 50 hypothetical case vignettes.
Participants
The participants for this study were all specialist palliative care doctors. These clinicians routinely work with people who are in the final days of life, and might be expected to have some special expertise at recognising imminent death. Eligible participants were members of the Association of Palliative Medicine (APM), which is the UK professional body for palliative care doctors. All members were invited to participate in the first phase (the prognostic test). They were contacted via an email through the association secretariat. At the end of phase I, the top performers on the prognostic task were invited to complete the second phase (judgement analysis).
Procedures
Phase I: test to identify the best prognosticators
No previous studies have attempted to objectively identify a group of prognosticators based on their performance (rather than on just their experience or training) and so it was necessary to develop a novel methodology. It would not have been adequate to simply identify doctors who are good at prognosticating based on a record of their own past performance, because most clinicians do not routinely record such data, and furthermore because any variations in performance may have been explained by differences in the case-mix of their patients. Nor would it have been practical to ask large numbers of geographically separated doctors to review the same patients and to prospectively make estimates about their survival. Therefore, the group of doctors with prognostic expertise were identified by selecting those doctors who performed best on an online prognostic test.
The prognostic test consisted of a series of 20 case studies, or ‘vignettes’, obtained by undertaking a prospective observational study of patients who had been referred to specialist palliative care services. Patients were assessed on one occasion and a record was made of whether or not they died within the subsequent 72 hours.
The clinical characteristics of each patient were summarised as a one page vignette. The aim was to provide information in a style that would be familiar to clinicians participating in a multidisciplinary team meeting. The structure of each vignette was standardised. In the first paragraph, there a general description of the patient and the circumstances that led to their admission. The second paragraph detailed the clinical condition on the day of admission and any changes since then. The final paragraph detailed the participant’s condition on the day of assessment. Additional information such as medications or recent blood tests were also presented, where they were available (see online supplementary file 1 for an example vignette).
Supplementary file 1
The prognostic test was open to recruitment between 22 April 2016 and 1 July 2016. Doctors were asked for some demographic information and to read through each case and were asked to make a numerical prediction about whether or not each patient would die within the subsequent 72 hours (0% indicating no chance and 100% indicating certainty).
Phase II: judgement analysis task
The top performing doctors (identified in phase I) were asked to complete an additional prognostic decision-making task, between 15 September 2016 and 31 October 2016. This task, which was similar in format to the prognostic test described above, required participants to estimate the probability (0% no chance–100% certain) of death within the next 72 hours for 50 vignettes describing fictional palliative care patients. The fictional nature of the cases included was necessary in order to allow the content of the vignettes to be statistically manipulated. This enabled the investigation of the relationship between the clinicians’ estimates and the putative prognostic factors.
Sample size
For each phase of this study, consideration was given to both the number of vignettes included in the online tasks and to the number of doctors participating.
Phase I
The aim of the prognostic test was to identify the top performers in terms of prognostic accuracy. Increasing the number of vignettes would increase the ability of the test to discriminate between respondents but would add to the study burden for the participants. Piloting of the test, established that with 20 vignettes the test would take approximately 1 hour to complete. It was therefore considered that including >20 vignettes would increase the risk that the prognostic test would not be completed by respondents.
No previous studies had used this methodology to identify respondents with prognostic skills and we therefore had no previous data on which to base our participant sample size calculation. The sample size was determined by the membership of the APM and the number who responded to the invitation to participate.
Phase II
The sample size for the judgement analysis task was not determined a priori. Instead, we examined the results of the prognostic test to see if a ‘natural’ group of experts emerged (ie, whether the data revealed a subgroup of doctors who were clearly superior in terms of prognostic abilities).
Factors
According to a standard judgement analysis methodological approach, each factor (piece of information about the patient) that is presented in a vignette requires between 5 and 10 vignettes to determine the judgement policy of the individual.10 Thus, if one wished to investigate five prognostic factors it would be necessary to include between 25 and 50 vignettes in the judgement analysis task. In order to reduce the study burden on participants (and thereby minimise the risk of attrition), we decided to limit the total number of prognostic factors included in the judgement analysis task to seven. The factors included in the vignettes were selected on the basis of a review of the relevant literature,17–21 excluding factors that are not routinely collected in the final days of life (such as the results of blood tests) and then by asking specialist palliative care clinicians (four nurses and eight doctors) at two London hospital sites to rank the factors in order of importance. There is no accepted methodology to reduce the number of factors; however, this process is commonly used within judgement analysis to select which cues to include and has good face validity.12 22 The final list of prognostic factors included in the vignettes were: Cheyne-Stokes breathing; performance status (measured with the Palliative Performance Score (PPS)23); urinary output; level of sedation/agitation (measured with the Richmond Agitation and Sedation Scale (RASS)24); presence of noisy respiratory secretions; the speed at which the patient’s overall condition was deteriorating and peripheral cyanosis.
Vignettes
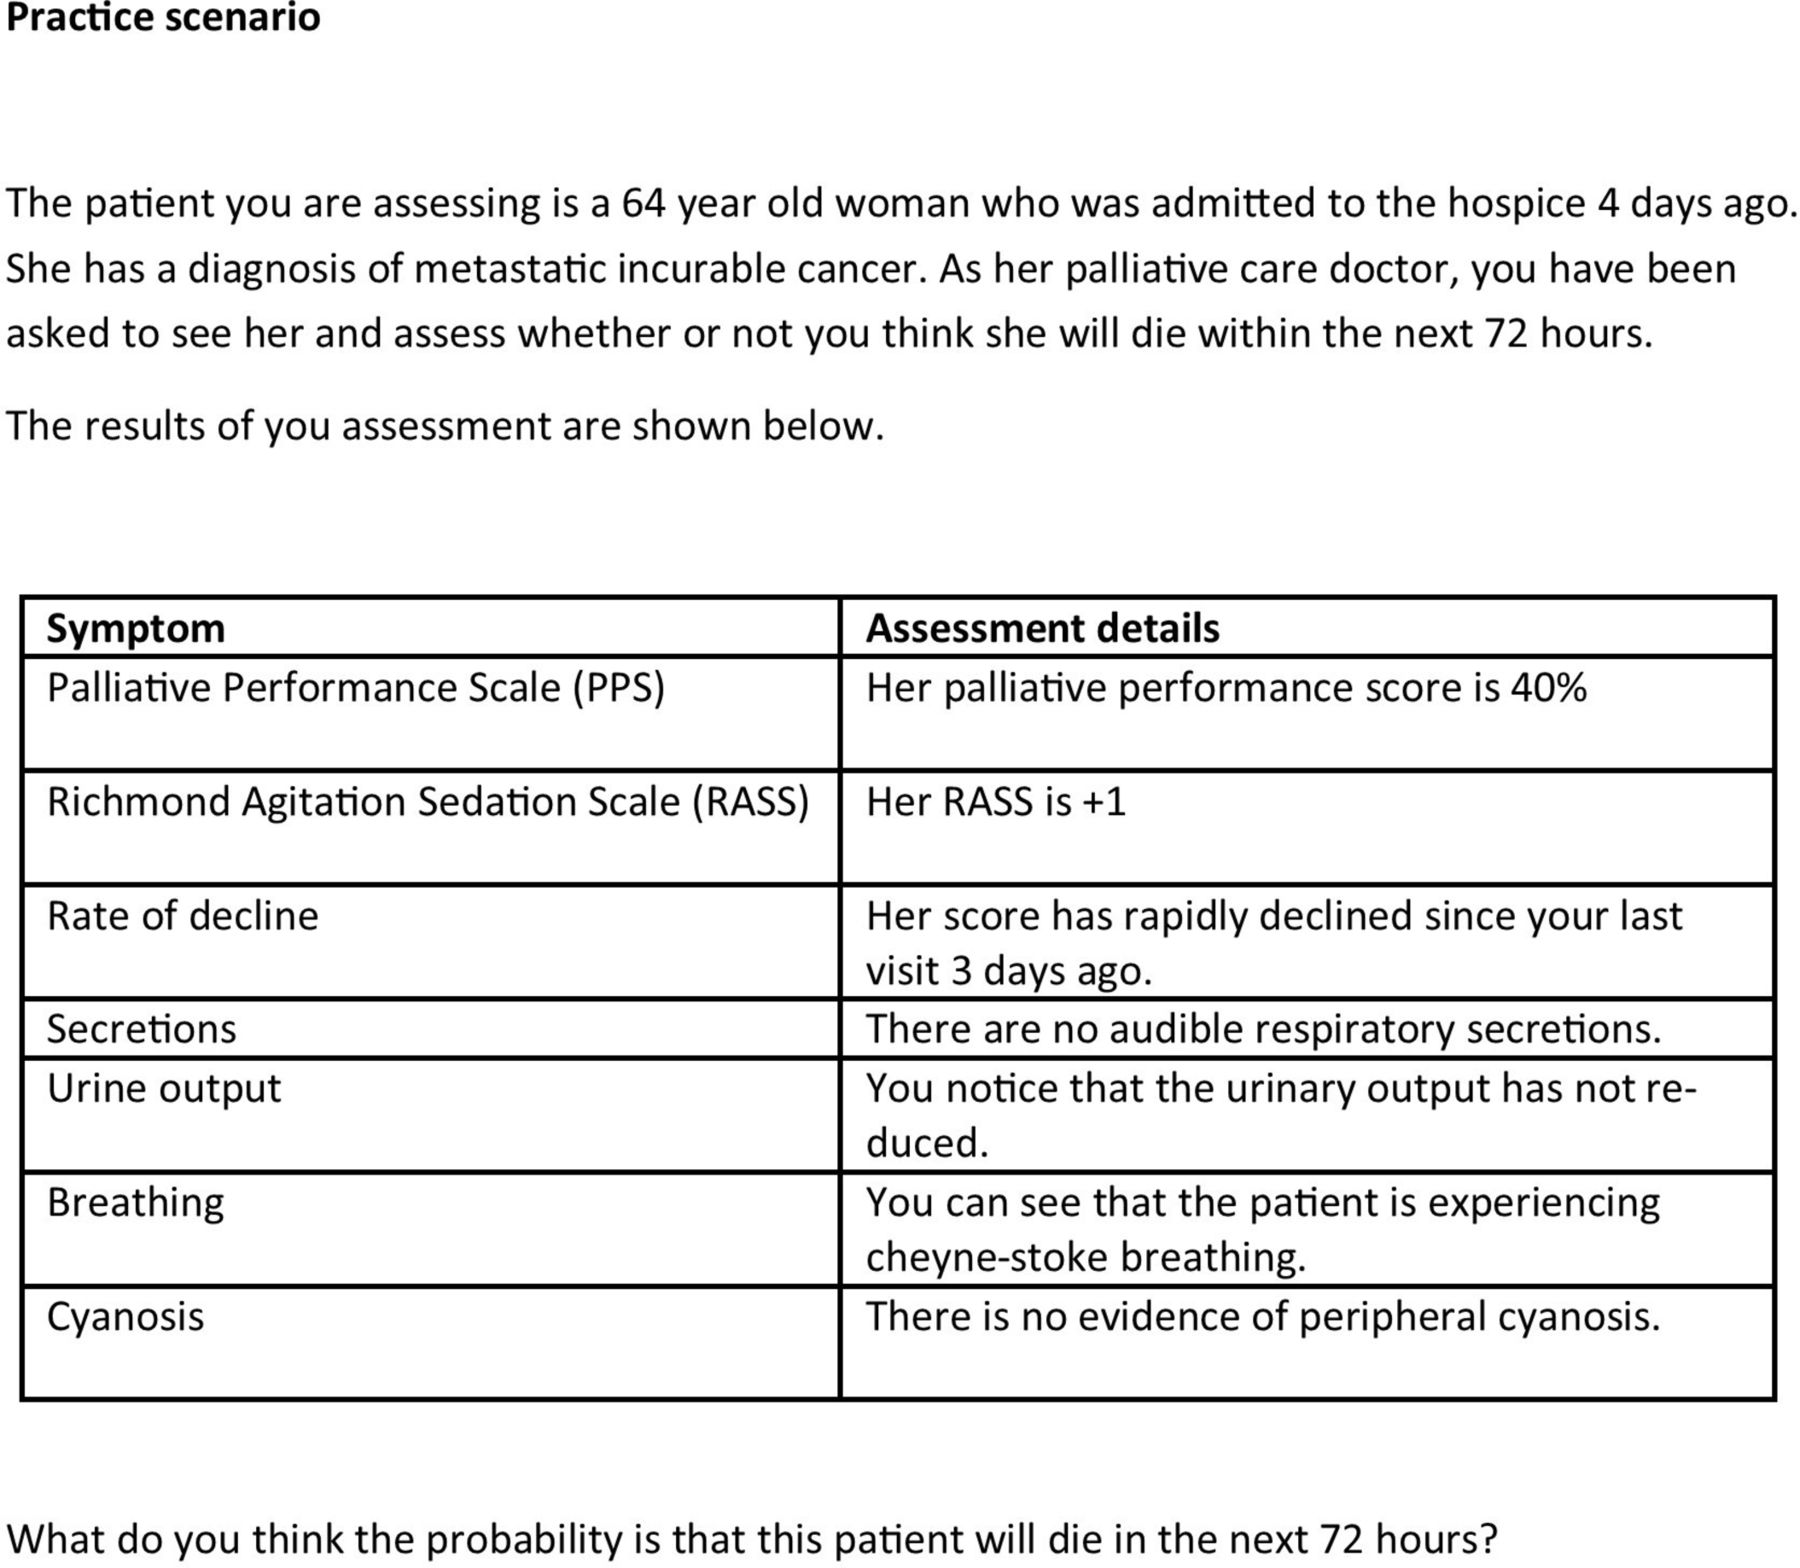
The vignettes in the judgement analysis task needed to span the range of severity of the different prognostic factors. However, with seven different factors, each with between two and seven levels it would have required an unmanageably large number of vignettes to include all of the possible scenarios as separate vignettes in the prognostic test. Therefore, 50 vignettes were created and selected using a fractional factorial design (using IBM SPSS V.22.0 orthogonal design function). This approach allows for the creation of a subset of all of the possible vignettes within which the levels of each factor are presented enough times to allow for determination of the judgement policy of the participant.25 Finally, the vignettes were checked for face validity, meaning that any impossible cases were removed. For example, it would not be possible to have a patient with a PPS score of 70% but a RASS score of −5. Core information about each patient (the stem) was kept the same for all vignettes so that any changes in doctors’ survival estimates could be attributed to changes in the seven prognostic factors only. Figure 2 shows an illustrative example of one of the vignettes used in the judgement analysis task.

Example hypothetical case vignette used in the judgement analysis.
Statistical methods
For both phases of this study, participants with missing estimates were excluded from the analysis (complete case analysis). Rates of attrition have been reported.
Analysis of phase I (the prognostic test)
The survival estimates provided by the participants in the prognostic test were compared with the known outcomes for each case (ie, whether the patient died within 72 hours). The accuracy of each doctor’s prognostic estimate was determined by calculating the Brier score (BS).
The BS takes into account whether or not the predicted outcome occurred and the degree of certainty with which it was predicted. BS can range between 0 and 1 with a score of 0 representing perfect accuracy and a score of 1 representing perfect inaccuracy. If a doctor had predicted a 50% probability of dying within 72 hours then regardless of whether or not the patient died, the BS would be 0.25 (see online supplementary file 2 for further explanation). Therefore, a BS of 0.25 provides a useful benchmark when gauging the accuracy of doctors’ prognostic estimates, because it can be obtained by consistently using a base-rate judgement (ie, always estimating the probability of death as 50%).
Supplementary file 2
For each doctor who completed the test, the mean of their BS across the 20 vignettes was calculated, and this was used as a summary measure of the participant’s prognostic ability. Additional analyses were completed to assess the BS and demographic information.
Analysis of phase II (judgement analysis)
The seven prognostic factors in each of the vignettes were coded so that a higher score indicated a greater severity of that factor. The five binary variables were coded as either ‘absent=0’ or ‘present=1’, where presence of the factor always indicated a poorer outcome. For the RASS, which can vary between −5 (heavily sedated) and +4 (highly agitated), the absolute value of the score was used, resulting in a transformed 6-point scale ranging from 0 (calm) to 5 (highly agitated/sedated). The PPS ranges from 0% (dead) to 100% (a healthy independent adult), however for the purposes of this study, the PPS scores were reduced to a 7-point scale ranging from 1 (equivalent to PPS of 70% or more, representing a patient with little or no care needs) to 7 (equivalent to a PPS of 10%, representing a patient who is bedbound and needs full support).
The level of agreement between the experts was assessed using a two-way random effects model intraclass correlation coefficient (ICC). The judgement policy of the expert group was calculated by using a mixed model regression analysis, with the individual doctors’ estimate of the patient’s percentage probability of dying for each vignette as the dependent variable, the seven prognostic factors included in each vignette as predictor variables, and the doctor as a random effect. This analysis accounted for the hierarchical nature of the data (ie, the correlation of individual estimates by the same doctor). A postestimation command of ‘esttab, beta’ was then applied to calculate the standardised coefficients for comparison. This standardised coefficient identified how influential each factor was in the model, with a larger score indicating more influence. All analyses were performed using Stata V.13.
Patient involvement
Members of the South West London Cancer Research Network reviewed the protocol and the patient vignettes used in the prognostic test phase of the research.
Results
Figure 3 presents an overview of the participants recruited in this study.

Consolidated Standards of Reporting Trials diagram of recruitment.
Phase I: the prognostic test
There were 166/1100 participants who responded to the invitation email (response rate of 15%). Out of the 166 respondents, 99 completed all 20 questions (60%) and were included in the analysis. Table 1 shows the detail of the doctors who completed the prognostic test.
Demographic information of all participants who completed the prognostic test
Overall, the mean BS of all participants was 0.237 (95% CI 0.235 to 0.239). The mean BS of women was 0.235 (95% CI 0.226 to 0.245) and this was not statistically significantly different (p=0.53) from the mean BS of men (0.241 (95% CI 0.226 to 0.257)). BS were not related to participants’ age (p=0.64), years qualified as a doctor (p=0.85) or years within palliative care (p=0.49).
We reviewed the distribution of the BS for the participants (figure 4) and based on this, decided that the top 20% of performers (n=19) should be invited to participate in the judgement analysis task. The mean BS of this group was 0.184 (95% CI 0.176 to 0.192), and their mean BS ranged from 0.136 to 0.199. Therefore, the scores of this group were clearly better than a base rate, or ‘random’ judgement, which would be indicated by BS=0.25.

Distribution of the mean Brier score for each doctor. The top 20% of performers, whose Brier scores were <0.2 (dashed line) were invited to participate in the judgement analysis study (n=19).
Phase II: determining the judgement policy of the ‘expert’ group
Of the top 20% (n=19) of doctors invited to participate in the judgement analysis task, 14 agreed to do so (74%). All of the participating doctors were female and the majority were British (13/14). The mean age was 42 years (SD 6.5). The mean time since qualification was 17 years (SD 7.9). The mean time spent working within palliative care was 10 years (SD 7.5). The frequency with which the participants identified dying patients in their clinical practice was: daily (n=6), weekly (n=7) or monthly (n=1). There was moderate agreement between the doctors about the probability of imminent death for each of the patients described in the case vignettes (ICC=0.55; 95% CI 0.44 to 0.66).
Judgement analysis
Table 2 shows the results from the mixed model analysis. It showed evidence that six prognostic variables were significantly related (p<0.001) to doctors’ predictions about the likelihood of imminent death.
Expert group judgement policy
Supplementary file 3
The most influential factor in the doctors’ decision making was the PPS (table 2). The presence of Cheyne-Stokes breathing was the next most influential factor. A decline in the patient’s overall condition and their level of agitation or sedation were the next most influential factors and had a similar level of influence. After these, the presence of noisy respiratory secretions and peripheral cyanosis had a similar level of influence on the model. A change in urinary output did not make a statistically significant difference to the doctors’ decision making.
Discussion
The aim of this research was to understand how doctors, with a measured prognostic ability, recognise when a patient is imminently dying. We found that for hospice inpatients with end-stage malignancy, the PPS was the most influential factor in doctors’ decision making, followed by the presence of Cheyne-Stokes breathing, decline in overall condition, level of agitation or sedation, presence of noisy respiratory secretions and peripheral cyanosis. This insight into the decision making of top prognosticators could be used to develop teaching resources to help less experienced doctors to model their own judgement policies on those of the experts. Using our results as a guide, novices could be taught to hone their clinical intuition by giving greater weight to certain factors (eg, PPS and presence of Cheyne-Stokes breathing) over other less important factors (eg, noisy respiratory secretions, peripheral cyanosis, urinary output). A similar approach to improving the decision-making abilities of novices by teaching them to model their judgement policies on those of experts has been shown to be successful in other (non-prognostic) situations and with other health and social care professionals.12 26 27
This research is important because, implicit in most clinical guidelines and policies about end of life care, is the assumption that it is possible to recognise which patients are, or are not, imminently dying. The NICE guideline28 on end-of-life care describes the recognition of imminent death as an essential first step towards improving care for dying patients. However, the guideline does not clearly explain how doctors are expected to identify such patients, nor how novice doctors can be expected to learn or improve this clinical skill. It is noteworthy that in the prognostic test we developed, we found no discernible difference in the prognostic accuracy of doctors by age or seniority, suggesting that experience alone does not make a better prognosticator. The prognostic inaccuracies highlighted by previous reports1 2 29 may be a reflection of a lack of prognostic training (specifically in the recognition of the dying phase) in medical school curricula and in postgraduate medical training. The results from phase I of this study emphasise how challenging predicting dying is in clinical practice, suggesting that it is essential for doctors to learn how to make decisions under conditions of uncertainty.
Strengths and limitations
This is the first study to have objectively identified a group of doctors by comparing prognostic accuracy and to have investigated their judgement policies. This study has provided a novel insight into how palliative care doctors make prognostic decisions. It is noteworthy that this insight could not have been achieved by simply asking palliative care doctors to reflect on and explain how they predict which patients are imminently dying. This is because not every palliative care doctor is necessarily very good at predicting imminent death and second because clinical judgement is, by its nature, a subconscious ‘gut instinct’ developed from many years of experience that cannot easily be articulated by the doctors themselves.5 30
One potential limitation of this research was that the group identified as the top performers may not, in fact, have been genuine ‘experts’ and, with repeated testing, their performance may have demonstrated regression to the mean. Repeated testing of participants to demonstrate sustained levels of performance on the prognostic test was beyond the resources of the current study but could (and should) be undertaken before adopting the prognostic test as a genuine measure of performance. Nonetheless, the results shown in figure 4 did demonstrate an overall skew in favour of increased accuracy (BS<0.25), which lends support to the idea that the best performers really did have some expertise in this area. Even taking into consideration these limitations, the approach that was taken in this study to quantify and objectively measure the ability of the ‘expert’ group was significantly more thorough than previous studies and is certainly preferable to assume that years of experience or seniority are synonymous with expertise.
Another limitation of the prognostic test was that it may have lacked ecological validity. Most doctors would prefer to review a patient face-to-face before making a prognostic estimate rather than relying on written clinical summaries and laboratory results. However, the test was not completely divorced from the realities of clinical practice, since doctors are often required to make prognostic decisions without the benefit of personally reviewing the patient (eg, when discussing patients at an MDT meeting or prioritising referrals to a service on the basis of information contained on referral forms). Moreover, the potential loss of ecological validity of the test was compensated for by the increased utility that arose from being able to compare numerous different doctors’ performances on the same prognostic test.
Similar issues about face validity may also be levelled at the judgement analysis task undertaken in phase II of the study. The orthogonal factorial design by which the factors were distributed across the vignettes may have led to the generation of some combinations that were less likely to be observed in the real world, where symptoms are more likely to ‘cluster’ together, or where one symptom might be a lot less common when found in the presence of another.
The response rate to the prognostic test was relatively low (15%) which could reduce the generalisability of the findings. However, it should be noted that the purpose of the test was not to obtain a ‘representative sample’, but to identify a group of experts.
Future research
It is important to emphasise that the judgement policy adopted by the doctors in this study was specific to the clinical scenario (the stem information) included in the judgement analysis task, that is, to predict imminent death (within 72 hours) among hospice inpatients with metastatic incurable cancer. The judgement policies of the doctors would almost certainly be different in other clinical circumstances. It is therefore important that our results are not extrapolated to other scenarios but are regarded as specific to the identification of imminent death among hospice inpatients with advanced cancer. To identify the best judgement policy in those situations would require further research using different participant groups and different case vignettes with the same methodology described in this study.
Conclusion
The results from this study has identified how specialist palliative care doctors, who performed well on a prognostic test, weighted clinical information in order to make a decision about whether or not a patient was thought to be dying imminently. This information could be used to inform the development of educational training materials to teach novice doctors how and when to model their judgement policies on those of the prognostic experts.
Acknowledgments
The authors would like to thank Professor Miriam Johnson and Dr Tim Rakow for their helpful comments on this research. The authors would also like to thank the South West London Cancer Research Network for their involvement in the development of the study documents and the patients and family members who kindly participated in this study.
References
Footnotes
Contributors NW developed the study concept, design and aims, designed data collection tools, completed the data collection for the whole study, wrote the statistical analysis plan, cleaned and analysed the data and drafted and revised the paper. She is the guarantor. PH and AJLH contributed to the development of the study concept, design and aims, monitored data collection throughout the study, aided in the analysis plan and analysis of the results and revised the paper. VV assisted in the statistical analysis and cleaning of the data, and revised the paper. PL, CMG, OM, AT assisted in the study design, aided the data collection for the observational study and revised the paper. CT aided in the design of the data collection, monitored data collection and revised the paper. FR initiated the PhD study concept, developed the design and aims of the study, monitored the data collection tools for the observational study and data collection, aided in the statistical analysis plan and analysis of the results and revised the paper. PS initiated the PhD study concept, developed the design and aims of the study, monitored the data collection tools for the entire study and data collection, monitored the statistical analysis plan and analysis of the results and revised the paper. All authors approved the final version of the paper.
Funding Financial support for this study was provided by a UCL PhD studentship and by Marie Curie Care (MCCC-FPO-16-U). The funding agreement ensured the authors’ independence in designing the study, interpreting the data, writing and publishing the report. The following authors are employed by the sponsor: NW, PS, VV.
Competing interests None declared.
Patient consent Not required.
Ethics approval The development and the administration of the prognostic test received ethics approval from West Midlands—Coventry & Warwickshire Research Ethics Committee (ref: 14/WM/0121). The judgement analysis study received ethical approval from University College London Research Ethics Committee (ref: 8675/001).
Provenance and peer review Not commissioned; externally peer reviewed.
Data sharing statement Anonymised data are available on reasonable request from the authors.