Article Text

Abstract
Objectives The prime objective of this study is to examine the trends of disease and age pattern of hospitalisation and associated costs in India during 1995–2014.
Design Present study used nationally representative data on morbidity and healthcare from the 52nd (1995) and 71st (2014) rounds of the National Sample Survey.
Settings A total of 120 942 and 65 932 households were surveyed in 1995 and 2014, respectively.
Measures Descriptive statistics, logistic regression analyses and decomposition analyses were used in examining the changes in patterns of hospitalisation and associated costs. Hospitalisation rates and costs per hospitalisation (out-of-pocket expenditure) were estimated for selected diseases and in four broad categories: communicable diseases, non-communicable diseases (NCDs), injuries and others. All the costs are presented at 2014 prices in US$.
Results Hospitalisation rate in India has increased from 1661 in 1995 to 3699 in 2014 (per 100 000 population). It has more than doubled across all age groups. Hospitalisation among children was primarily because of communicable diseases, while NCDs were the leading cause of hospitalisation for the 40+ population. Costs per hospitalisation have increased from US$177 in 1995 to US$316 in 2014 (an increase of 79%). Costs per hospitalisation for NCDs in 2014 were US$471 compared with US$175 for communicable diseases. It was highest for cancer inpatients (US$942) followed by heart diseases (US$674). Age is the significant predictor of hospitalisation for all the selected diseases. Decomposition results showed that about three-fifth of the increase in unconditional costs per hospitalisation was due to increase in mean hospital costs, and the other two-fifth was due to increase in hospitalisation rates.
Conclusion There has been more than twofold increase in hospitalisation rates in India during the last two decades, and significantly higher rates were observed among infants and older adults. Increasing hospitalisation rates and costs per hospitalisation are contributing substantially to the rising healthcare costs in India.
- disease and age-pattern
- non-communicable diseases
- india
- cost of hospitalization
- hospitalization rate
This is an Open Access article distributed in accordance with the Creative Commons Attribution Non Commercial (CC BY-NC 4.0) license, which permits others to distribute, remix, adapt, build upon this work non-commercially, and license their derivative works on different terms, provided the original work is properly cited and the use is non-commercial. See: http://creativecommons.org/licenses/by-nc/4.0/
Statistics from Altmetric.com
Strengths and limitations of this study
This study provides disease specific hospitalisation rates in a more comprehensive manner than ever using 11 age groups.
Change in disease specific costs per hospitalisation has been estimated over past two decades.
It decomposes the increase in unconditional costs per hospitalisation by increase in mean hospitals costs and hospitalisation rates.
Study only uses the hospitalisation cost that underestimates the total financial burden incurred by households on healthcare.
Introduction
Demographic transition and epidemiological transition have altered the age pattern of mortality and morbidity globally and nationally. While there has been significant progress in the reduction of infant and child mortality, adult mortality has shown varying patterns across regions and countries with deaths occurring at progressively older ages.1 2 Non-communicable diseases (NCDs) are now the leading cause of mortality, hospitalisation and disability in both developed and developing countries.3 4 Social, economic and human loss due to the changing disease pattern is profound and is affecting economic growth and development adversely across countries.5 6
The human capital models are based on the premise that health depreciates with age and can be augmented by investing in health, including medical care.7 Medical care is positively associated with income, educational attainment, accessibility and availability of health services and the share of elderly population.8–11 Age structural transition (due to demographic shift), increasing medical care, technological advancement and increase in the real cost of treatment are driving medical costs exponentially. Medical spending in developing countries is catastrophic for large households and families.12–20 Though publicly funded health programmes are covering primary health services, they are not equipped to meet the challenge of growing NCDs.
Demographic change in India is marked by three key developments: falling fertility in the states, increase in longevity across age and improvement in child survival across socioeconomic groups. While the country is nearing to the replacement level of fertility, increase in longevity has been experienced across all age groups. Life expectancy at birth has increased from 59.4 years in 1991 to 66.1 years in 2011.21 Underfive mortality has reduced by more than half during the same period and is now estimated at 55 per 1000 live births.22 These positive developments are accompanied with a changing disease pattern (increase share of NCDs and injuries). NCDs have become the leading cause of mortality, disability and morbidity in India23 and are projected to increase in the coming years.24
Evidence suggests that household health spending in India accounts for 71% of total health spending25 and is catastrophic to a large number of households. Hospitalisation accounts for a large share of medical spending, and the pattern of hospitalisation varies across different ages. Besides, the growth rate of household health spending is faster than the growth rate of household economic well-being.26 Though some attempt has been made to address the morbidity and disease pattern in India, there has been no study on the age pattern of hospitalisation and associated costs in India. This paper aims to examine the trends in the age pattern of hospitalisation and associated costs by selected diseases in India.
Methods
Data
The unit data from Schedule 25.0 of the 52nd (1995–1996) and 71st rounds (2014) of the National Sample Survey (NSS) conducted by the National Sample Survey Organization (NSSO), Government of India, are used in the analyses. These rounds of surveys are the only databases that provide comprehensive and comparable information on the morbidity pattern and healthcare utilisation covering the entire population in India. A total of 120 942 households and 633 408 individuals (629 888 alive and 3520 death cases) were covered in 1995, and 65 932 households and 335 499 individuals (333 104 alive and 2395 death cases) were covered in 2014. The survey covered all states and union territories, and the households were selected using multistage stratified sampling procedure. Details of the sampling designs and the survey findings are available in the reports of the respective rounds.27 28 Schedule 25.0 of these two rounds has detailed information on types of ailment, duration of ailment, healthcare utilisation, hospitalisation, source of treatment (public/private) and expenditure incurred by each member of the sampled households on treatment of diseases/hospitalisation. Data on medical expenditure on medicines, surgery, diagnostic tests, doctor’s fees and lodging charges (direct expenditure) and expenditure on transport charges and other charges indirect/non-medical expenses are available in both rounds of the survey. Our estimates on the costs of hospitalisation include all direct and indirect expenditures incurred by household members on hospitalisation.
Data on hospitalisation (defined as an overnight stay in the hospital anytime) were collected in a reference period of 365 days and for out-patients (visit to a healthcare professional/health centre and not an overnight stay) in a reference period of fifteen days. We have used only those cases that were hospitalised because they have the advantage of having been medically diagnosed and provided treatment. The number of hospitalised cases were 26 526 in 1995 and 42 869 in 2014. To compare the cost of hospitalisation over time, expenditure is first adjusted to uniform base year (1987–1988) and then adjusted at constant prices (2014 prices).29 All the estimates are presented in US$ (average exchange rate US$1=INR60.745) and at 2014 prices. Costs that we referred to in the analysis is out-of-pocket expenditure that was incurred during hospitalisation.
Analytical approach
For analytical purposes, we have classified the diseases into four broad categories, namely, communicable diseases, NCDs, injuries and other diseases similar to the classification of Cause of Death Report, India 2001–2003.25 Communicable diseases include all types of fever, filariasis, tetanus, diarrhoea, jaundice, respiratory diseases, anaemia, tuberculosis, HIV/AIDS and other sexually transmitted diseases, while NCDs include cancer, diabetes, heart diseases, hypertension, asthma, musculoskeletal, genitourinary, psychiatric and neurological illnesses. Disease specific analyses have been carried out by considering the frequencies and importance of the diseases. The specific diseases covered are fever, diarrhoea, tuberculosis, cancer, heart diseases, hypertension, diabetes and injuries. A total of 11 broad age groups, namely, <1, 1–4, 5–9, 10–19, 20–29, 30–39, 40–49, 50–59, 60–69, 70–79 and 80+ years are used in the analysis. Analyses have been limited to the national level.
Hospitalisation rate, descriptive statistics, decomposition method and logistic regressions are used in the analyses. Hospitalisation rate is defined as the number of spells of hospitalisation anytime during the 1 year preceding the survey of the population exposed to risk.30

Hospitalisation rate is expressed per 100 000 population. Costs per hospitalisation by diseases and age groups are presented over time. Bivariate analyses were carried out to understand the differentials and variations in hospitalisation and associated cost over time.
We have used the decomposition method to understand the role of mean hospital costs and hospitalisation rates in affecting the change in unconditional costs per hospitalisation over time. A detailed description and review of the decomposition method and its underlying assumption can be found elsewhere.31–33 The advantage of using this method is that we can attribute the changes in unconditional costs per hospitalisation to the change in hospitalisation rates and change in mean hospital costs. The decomposition model is given as:
Unconditional costs [t+1] − unconditional costs [t]=(mean hospital costs[t+1] – mean hospital costs[t] * hospitalisation rates [t+1]) + (hospitalisation rates[t+1] − hospitalisation rates[t] * mean hospital costs [t])
where [t] is ‘Year 1995’.
[t+1] is ‘Year 2014’.
The first term in the above decomposition method is the changes in costs due to hospital costs, and the second term is change in costs due to hospitalisation rates. All the indicators used in this decomposition method are weighted. Additionally, all the results presented in the paper are based on analytical weights given by the NSSO.
A set of logistic regression analyses was carried out to understand the role of age pattern on hospitalisation. The dependent variables used are hospitalisation for specific diseases or group of morbidities and the independent variables used are age group, sex, place of residence (rural–urban), educational attainment and monthly per capita consumption expenditure (MPCE) quintile. The model specification is given below:
 (1)
(1)
where Y is the binary variable, that is, whether hospitalised or not for disease i (yes=1, no=0) at time t, Age is the age group, POR is the place of residence (rural or urban), Education is the level of educational attainment of the person and MPCE is the monthly per capita consumption expenditure of the household.
Results
Hospitalisation rates
Age pattern of mortality and hospitalisation in India has been presented in figures 1 and 2, respectively. While the age pattern of mortality is taken from the Cause of Death Report, India 2001–2003, the age pattern of hospitalisation for 2014 has been estimated from NSS data. In general, the age pattern of mortality and hospitalisation by disease are similar in India. For children below 15 years of age, communicable diseases are the leading cause of death and hospitalisation. Injury is the leading cause of death for those in the age group 25–34 years, while communicable diseases are the leading cause of hospitalisation. NCDs are the leading cause of death and hospitalisation in India for those who are aged 35+ years.

Age pattern of death in India by cause of death classification, 2001–2003. NCDs, non-communicable diseases.

Age pattern of hospitalisation in India by cause of death classification, 2014. NCDs, non-communicable diseases.
Table 1 presents the profile of the households and individuals surveyed in 1995–1996 and in 2014. Mean age of the population has increased by 4 years, while the average household size has declined by 0.7 persons over the last two decades. The proportion of children (0–14 years) has declined, while that of the elderly population has increased. Educational attainment has improved over time. MPCE, an indicator of household economic well-being, has increased by 37% (at 2014 constant price). However, rural–urban differences in MPCE have remained large over time.
Sample profile of individuals and households in India, 1995–2014
Figure 3 presents the hospitalisation rates in 1995 and 2014 across broad age groups in India. Age pattern of hospitalisation rate has shifted upwards over time. The overall hospitalisation rate (per 100 000 population) has increased more than twice, from 1661 in 1995 to 3699 in 2014. Hospitalisation rates of infants (<1 years age) have increased thrice during the period, lowest in the age group 5–9 years and lower until age 30 years. Beyond age 40 years, hospitalisation rates increased at a faster rate, and by age 80 years, the rates were about five times higher than that of the overall population.

Age pattern of hospitalisation rate in India, 1995–2014.
During 1995–2014, the hospitalisation rates for communicable diseases have increased by 47% (from 958 in 1995 to 1412 in 2014) and by 137% for NCDs (482–1142) (table 2). The age patterns of hospitalisation rates due to communicable diseases and NCDs have shown interesting trends (figure 4). In 1995, hospitalisation due to communicable diseases was higher than the NCDs in 8 of the 11 specified age groups (except 50–59, 70–79 and 80+ years). By 2014, hospitalisation due to NCDs was higher in 5 of the 11 specified age groups (higher for all ages beyond 40 years). This suggests that NCDs are now advancing and affecting the younger age group. Hospitalisation due to communicable diseases has shown a ‘U’-shaped curve in both the periods, and the curve has shifted over time suggesting increasing hospitalisation (figure 4). It had increased among the children and elderly and was highest among infants. Hospitalisation beyond age 40 years was primarily due to NCDs. Hospitalisation due to injuries had also increased across all age groups and showed an increasing pattern (figure 5). Furthermore, hospitalisation due to other diseases had also increased over time especially due to senility among the elderly.
Age pattern of hospitalisation rate (per 100 000 population) by communicable disease, non-communicable diseases, injuries and other diseases in India, 1995–2014

Age pattern of hospitalisation rate for communicable and non-communicable diseases in India: 1995–2014. NCDs, non-communicable diseases.

Age pattern of hospitalisation rate for injuries in India: 1995–2014.
Table 3 presents the hospitalisation rates (per 100 000 population) for fever, diarrhoea and tuberculosis in 1995 and 2014. Hospitalisation due to fever had increased for all age groups and showed no pattern with age in either time points. The increase in hospitalisation was similar for all age groups. In 2014, hospitalisation due to fever was highest for the 80+ years age group (1169) followed by children in the 1–4 years age group (1157). During 1995–2014, hospitalisation due to diarrhoea had decreased from 159 to 124. Hospitalisation for diarrhoea had declined for all the age groups except among children under 5 years. In 2014, hospitalisation due to diarrhoea was highest for infants followed by children in the 1–4 years age group. Similarly, there was a modest increase in hospitalisation due to tuberculosis (from 41 to 50), and this increase was minimal among all hospitalisation cases. Age pattern of tuberculosis suggests a decreasing trend across all ages beyond 30 years (except for 40-49 and 80+ years age-group), while it showed an increasing pattern for the age group below 30 years (except for <1 years age). Table 4 presents the hospitalisation rate due to four specific NCDs, namely, heart diseases, hypertension, diabetes and cancer. Hospitalisation due to cancer, heart diseases, hypertension and diabetes had increased more than threefold during the same period. Hospitalisation due to these four NCDs is positively associated with age. Hospitalisation due to each of these four diseases had increased for each specified age group. The increase was equally high among the working age group (30–69 years) suggesting that it was significantly affecting the working population. In 1995, the hospitalisation rates of cancer (187) and heart diseases (577) was highest in the age group 70–79 years, and in 2014 it was highest among the 80+ years (626 and 3402, respectively). Hospitalisation rates for hypertension (954) and diabetes (614) were highest among those in the 70–79 years age group.
Age pattern of hospitalisation rate (per 100 000 population) by fever, diarrhoea, tuberculosis and injuries in India, 1995–2014
Age pattern of hospitalisation rate (per 100 000 population) by heart diseases, hypertension, diabetes and cancer in India, 1995–2014
Costs per hospitalisation
Figure 6 shows the costs per hospitalisation for communicable diseases, NCDs, injuries and all diseases in 1995 and 2014. Costs per hospitalisation were US$177 in 1995, which increased to US$316 (by 79%) in 2014. Expectedly, NCDs had the highest costs per hospitalisation compared with all other specified categories during both the surveys. For example, costs per hospitalisation for NCDs (US$312 in 1995 and US$471 in 2014) was about three times higher than that of communicable diseases (US$102 in 1995 and US$175 in 2014) in both the points. Noticeably, expenditure on injuries was also very high (US$412 in 2014). During 1995–2014, costs per hospitalisation for communicable diseases had increased by 72%, while that of communicable diseases had increased by 51% at constant prices. Both communicable and NCDs did not show any pattern in the cost of hospitalisation with respect to age.

Costs per hospitalisation (in US$) for communicable diseases, non-communicable diseases (NCDs), injuries and all diseases in India, 1995–2014.
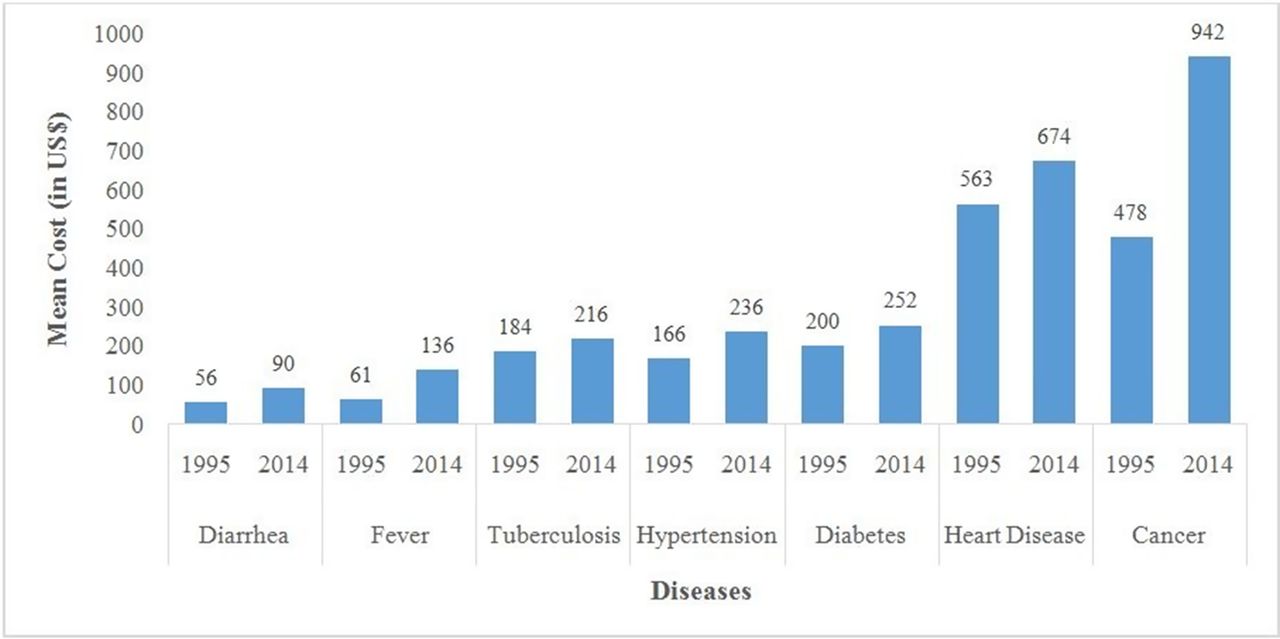
Table 5 presents costs per hospitalisation by public and private hospitals for each specified disease at 2014 prices. In 2014, costs per hospitalisation for cancer was most expensive (US$942) followed by heart disease (US$674) (figure 7). This pattern holds true for both public and private health centres. It was lowest for diarrhoea followed by fever. Notably, costs per hospitalisation for each of the diseases in private health centres was about two to three times higher than that in public health centres in both periods. Costs per hospitalisation for all the specified diseases had increased over time. Furthermore, costs per hospitalisation in public hospitals have declined for hypertension, diabetes, tuberculosis and injuries. Hospitalisation costs were not only expensive in private health centres but also recorded a  faster increase for each of the diseases. Increase in the costs per hospitalisation in private health centres had increased the gap between public-private expenditure over time. For example, in 1995, costs per hospitalisation for communicable diseases in private hospitals was twice higher than that in public hospitals (US$ 66 and US$ 143 respectively), whereas the difference increased to 3.5 times (US$ 73 and US$ 250 respectively) in 2014. Similarly, in 1995-96, per capita cost of hospitalisation for NCDs in private hospitals was twice higher than that in public hospitals (US$ 196 and US$ 403 respectively), whereas the difference increased by threefold (US$ 202 and US$ 607 respectively) in 2014.
Costs per hospitalisation in public and private health centres by disease in India, 1995–2014
Costs per hospitalisation (in US$) by type of disease in India, 1995–2014.
Multivariate analyses
Table 6 presents the odds of hospitalisation for communicable diseases, NCDs and injuries and their CI. Hospitalisation for a specific category of disease (for instance, communicable diseases) was taken as 1 and 0 for hospitalisation of all other diseases. The set of explanatory variables were age, sex, place of residence, educational attainment and MPCE quintile. Estimates were obtained for 1995 and 2014, and results were presented for 2014 as the patterns were similar over time. Age, sex and place of residence are significant predictors of communicable diseases. With respect to age, the age group 30–39 years is the reference group, because NCDs showed a steady increasing pattern beyond this age group. Hospitalisation for communicable diseases was significantly higher among younger ages compared with older age groups, and the odds of hospitalisation decrease with age. For example, the odds of hospitalisation among children in the age group 1–4 years were six times higher than those in the 30–39 years age group. Compared with males, females were significantly more likely to be hospitalised for communicable diseases. Age, sex, place of residence and educational attainment were significant predictors of NCDs. The odds of hospitalisation for NCDs were for all ages below 30 years and higher for all age groups above 40 years than that for the reference age group. Likelihood of hospitalisation increased with age, that is, beyond age 40 years: 1.45 for the age group 40–49 years, 1.71 for 50–59 years and 2.05 for 60–69 years. Urban residents were significantly more likely to be hospitalised for NCDs than their rural counterparts. Age pattern of hospitalisation of injuries was distinct; it affected those in the age group 30–39 years significantly and was lower for all other age groups. The odds of hospitalisation decreased with age beyond the reference age group. Females were significantly less likely to be hospitalised for injuries compared with males.
Results of logistic regression for hospitalisation due to communicable diseases, NCDs and injuries in India, 2014
Table 7 presents the OR and CI for three specific diseases, namely, fever, diarrhoea and tuberculosis. Odds of hospitalisation for fever and diarrhoea were significantly higher for the younger age group and lower for the older age group. Females were significantly more likely to be hospitalised for fever and diarrhoea. Chances of hospitalisation for fever increased with MPCE quintile and decreased for diarrhoea. In the case of tuberculosis, the odds of hospitalisation for the older age group were not statistically significant (except 70–79 years age group); those in the younger age groups were lesser likely to be hospitalised compared with those in the 30–39 years age group. Likelihood of hospitalisation for females and urban residents were significantly lower compared with males and rural residents, respectively.
Results of logistic regression for hospitalisation of fever, diarrhoea and tuberculosis in India 2014
Odds of hospitalisation for tuberculosis decrease with educational attainment and MPCE quintile. Table 8 presents the OR for hospitalisation of heart diseases, hypertension, diabetes and cancer. Likelihood of being hospitalised was significantly lower among those below 30 years for all the selected diseases. The chances of hospitalisation for heart diseases, hypertension and diabetes increased with age, while hospitalisation due to cancer was significantly lower among those aged 70+ years compared with the reference category. Females had lower odds of hospitalisation due to heart diseases while there were higher chances of them being hospitalised for hypertension, diabetes and cancer. Odds of hospitalisation due to diabetes (OR 1.55) and cancer (OR 1.92) were higher among the richest compared with those in the poorest MPCE quintile.
Results of logistic regression for hospitalisation of heart diseases, hypertension, diabetes and cancer in India 2014
Decomposition of change in unconditional costs per hospitalisation
Decomposition method has been used to understand the role of hospitalisation rates and mean hospital costs in changing unconditional costs per hospitalisation during 1995–2014. The unconditional costs per hospitalisation in India have increased from US$2.9 in 1995 to US$11.6 in 2014 (table 9). Decomposition results showed that about three-fifth of the increase in unconditional costs per hospitalisation was due to increase in mean hospital costs (58.8%) and the other two-fifth of the increase was due to hospitalisation rates (41.2%).
Indicators used for decomposing the change in unconditional costs per hospitalisation in India during 1995–2014
Discussion
Demographic transition during the last two decades has altered the age structure of India’s population significantly. Size and share of the working population and elderly are growing exponentially. This age structural transition is associated with demographic transition and linked to epidemiological transition, that is, the transition of disease pattern from communicable diseases to NCDs. The early onset of NCDs resulting from epidemiological transition is affecting working adults and the elderly equally and has become the leading cause of mortality and morbidity. Furthermore, epidemiological transition increases the burden of diseases in a country and imposes high financial hardship on its government and households. In this context, we examined the age pattern of hospitalisation and costs of treatment in India during last the two decades. We have used two rounds of NSS survey data (52nd and 71st round). The 71st round of NSS data is the most recent concluded survey on morbidity and healthcare in India. The salient findings from our analysis are as follows:
First, the age pattern of hospitalisation is similar to that of mortality, and NCDs are the leading cause of hospitalisation in India. With the exception of infants, hospitalisation is an increasing function of age and recorded exponential growth beyond age 40 years. Hospitalisation rates have increased more than twice between 1995 and 2014 across all the age groups, and it was more prominent for infants, children and those 60 years and above. This increased hospitalisation may be attributed to an array of factors: rising morbidity over time, awareness of health benefit of the population, increasing income of the population and availability and accessibility of health services, besides others. Second, hospitalisation due to communicable diseases, NCDs and injuries has increased over time confirming the triple burden of diseases in India.24 Hospitalisation among children was primarily because of communicable disease, whereas the NCDs were the leading cause of hospitalisation for those aged 40+ years. Hospitalisation due to heart diseases, hypertension, diabetes and cancer had more than tripled during the same period. Third, increasing hospitalisation is associated with increasing costs over time irrespective of the diseases. However, costs per hospitalisation were maximum among patients with cancer. Fourth, costs per hospitalisation for NCDs was three times that of communicable diseases. Besides, costs per hospitalisation in private healthcare facilities were significantly higher than in public hospitals. Other studies have documented that the share of NCDs in out-of-pocket health expenditure incurred by households has increased over time in India,6 and the costs of NCDs are projected to increase in the future.24 Many studies have shown that the high out-of-pocket health expenditure is catastrophic, and the impoverishment impact in general and for poor households, in particular, pushes many families into the medical poverty trap.12 17 19 34 35
During the last decade, there has been a systematic effort by the government of India to improve health services and protect households from financial catastrophe. In 2008, the government of India launched the Rashtriya Swasthya Bima Yojana (RSBY), a national health insurance scheme for poor. The main aim of RSBY was to provide health insurance coverage to the families (maximum up to five members) belonging to below poverty line and provide access to quality healthcare and protect them from catastrophic health expenditure. The scheme aimed to enhance poor people’s choice of healthcare provider by impanelling both public and private hospitals. It provides cashless insurance of up to US$494 per family per year for hospitalisation in any of the impanelled hospitals.36 Studies have documented that the RSBY has been successful in reducing out-of-pocket expenditure (OOPE) and catastrophic impact on the families.37 However, the coverage and insurance amount of the RSBY is very low and needs to be enhanced. The central government has introduced some other social health insurance schemes such as Aam Aadmi Bima Yojana (social security scheme for rural landless households) and Universal Health Insurance Scheme (for poor families). The Central Government Health Scheme provides healthcare facilities for central government employees and pensioners and their dependents.38 Besides, a number of schemes were launched by some states in India to provide health insurance primarily to poor families. For example, Rajiv Aarogyasri Scheme in Andhra Pradesh provides financial protection to the families living below poverty line up to US$3292 a year for the treatment of serious ailments requiring hospitalisation and surgery. About 938 treatments are covered under this scheme. Likewise, the Gujarat Government has launched Mukhyamantri Amrutam scheme, which provides quality medical and surgical care to below poverty line families for catastrophic illnesses involving hospitalisation, surgeries and therapies through an impanelled network of hospitals. The Chief Minister’s Comprehensive Health Insurance Scheme in Tamil Nadu provides free medical and surgical treatment (up to US$2469 per family per year) in government and private hospitals to the members of the family with an annual income less than US$1185.39 Although studies have documented that health insurance reduces the OOPE and catastrophic health spending, its coverage is still very low; less than 20% of the population is covered under any health insurance scheme in India.40 Furthermore, many health insurance schemes do not cover chronic illnesses41 and hence may not reduce the OOPE and catastrophic expenditure in certain households. Recently released National Health Policy 2017 aimed to increase the central government spending from the current level of 1.15%–2.5% of the gross domestic product by 2025. Policy envisages attaining the highest possible level of health and well-being for all ages and providing affordable and universal access to good quality healthcare services without anyone facing financial catastrophe. It specifically stated its aim to reduce the proportion of household incurring catastrophic health expenditure from the current level by 25% by 2025.42 However, the success of the policy depends on how well it is implemented across the country, for this has always been a big hurdle in the Indian context.
Conclusion
During the last two decades, the hospitalisation rate in India has increased across all age groups. Costs per hospitalisation had grown at least twice over time. Furthermore, costs per hospitalisation for NCDs were three times higher than that for communicable diseases in 2014 and thus imposing a high financial burden on the families. Though the catastrophic and impoverishment effect of out-of-pocket health expenditure was beyond the purview of this study, it has to be mentioned that many poor families are pushed towards utter poverty due to the high treatment cost. Increased public spending on health has a direct effect in reducing out-of-pocket health expenditure and could be helpful for many households to overcome the medical poverty trap. The Ministry of Health and Family Welfare, Government of India, launched the National Programme for Prevention and Control of Cancer, Diabetes, Cardiovascular Disease and Stroke (NPCDCS) in 2010. Initially, the programme was implemented in 100 districts covering 21 states, and there was a proposal to expand it to cover all the districts across the country with special focus on strengthening infrastructure, human resource development, health promotion, early diagnosis, treatment and referral for prevention and control of cancer, diabetes, cardiovascular diseases and stroke.43 Expansion of NPCDCS to all the districts may be helpful in averting many households from the medical poverty trap.
References
Footnotes
Contributors Both authors have contributed a considerable share of their knowledge and effort. Both the authors designed and conceptualised the study. AK analysed the data and drafted the manuscript. SKM finalised the manuscript and gave critical comments to the study.
Funding This research received no grant from any funding agency in the public, commercial or not-for-profit sectors.
Competing interests None declared.
Patient consent Not required.
Ethics approval This article does not contain any studies with human or animal subjects performed by the author.
Provenance and peer review Not commissioned; externally peer reviewed.
Data sharing statement No additional data are available.