Article Text

Abstract
Objectives Our study aimed to distinguish the ability of anthropometric indices to assess the risk of metabolic syndrome (MetS).
Design Prospective cohort study.
Setting Shenyang, China.
Participants A total of 379 residents aged between 40 and 65 were enrolled. 253 of them were free of MetS and had been followed up for 4.5 years.
Methods At baseline, all the participants underwent a thorough medical examination. A variety of anthropometric parameters were measured and calculated, including waist circumference (WC), body mass index (BMI), a body shape index (ABSI), abdominal volume index (AVI), body adiposity index, body roundness index, conicity index, waist-to-hip ratio and visceral adiposity index (VAI). After 4.5 year follow-up, we re-examined whether participants were suffering from MetS. A receiver operating characteristic (ROC) curve was applied to examine the potential of the above indices to identify the status and risk of MetS.
Outcomes Occurrence of MetS.
Results At baseline, 33.2% participants suffered from MetS. All of the anthropometric indices showed clinical significance, and VAI was superior to the other indices as it was found to have the largest area under the ROC curve. After a 4.5 year follow-up, 37.8% of men and 23.9% of women developed MetS. ROC curve analysis suggested that baseline BMI was the strongest predictor of MetS for men (0.77 (0.68–0.85)), and AVI was the strongest for women (0.72 (0.64–0.79)). However, no significant difference was observed between WC and both indices. In contrast, the baseline ABSI did not predict MetS in both genders.
Conclusions The present study indicated that these different indices derived from anthropometric parameters have different discriminatory abilities for MetS. Although WC did not have the largest area under the ROC curve for diagnosing and predicting MetS, it may remain a better index of MetS status and risk because of its simplicity and wide use.
- Metabolic syndrome
- Waist circumference
- Abdominal volume index
- Visceral adiposity index
- Anthropometric index
- Body mass index
This is an Open Access article distributed in accordance with the Creative Commons Attribution Non Commercial (CC BY-NC 4.0) license, which permits others to distribute, remix, adapt, build upon this work non-commercially, and license their derivative works on different terms, provided the original work is properly cited and the use is non-commercial. See: http://creativecommons.org/licenses/by-nc/4.0/
Statistics from Altmetric.com
- Metabolic syndrome
- Waist circumference
- Abdominal volume index
- Visceral adiposity index
- Anthropometric index
- Body mass index
Strengths and limitations of this study
This is the first study to systematically report different abilities of anthropometric indices in diagnosing and predicting metabolic syndrome.
The prospective design is a strength of this study. Some previous reports have been limited by their design (cross-sectional).
The participants in the present study were middle aged and elderly in Northeast China, which limits the applicability of the conclusions to other populations.
This study defined metabolic syndrome using IDF 2009 criteria. Therefore, further studies are needed to determine whether the results are consistent under different criteria.
Background
Metabolic syndrome (MetS), as a cluster of risk factors for cardiovascular morbidity and mortality,1 has become a major health concern in both developing and developed countries. It has been reported that more than a third of adults suffer from MetS by the National Health and Nutrition Examination Survey.2 A growing body of evidence supports the hypothesis that abdominal visceral fat plays a role in the development of MetS.3–6 Hence, it is reasonable that central obesity is defined as a predictor of MetS.
Body mass index (BMI) is widely used in assessing the obesity status,7 but it cannot describe the distribution of abdominal adipose tissue. Therefore, additional anthropometric indices are required to assess abdominal adipose accumulation. Elevated waist circumference (WC) and waist-to-hip ratio (WHR) were reported to be strongly associated with central obesity and MetS.8 Moreover, Krakauer’s and Tomas’ groups proposed a body shape index (ABSI) and body roundness index (BRI), respectively, to estimate body fat distributions. However, neither ABSI nor BRI have been shown to be more closely correlated with cardiovascular disease than BMI or WC.9 Recently, Amato et al reported an alternative anthropometric index, that is, visceral adiposity index (VAI), that could be considered as an indicator for cardiometabolic risk.10 However, its advantages in predicting metabolic diseases over other indices are still unclear. The abdominal volume index (AVI) is another anthropometric tool for estimating overall volume. It is thought to have an extremely close relationship with the dysfunction of glucose metabolism.11 Additionally, other indices have often been used in epidemiological research, such as the conicity index (CI) and body adiposity index (BAI).12 13 However, a comprehensive consensus has not been reached about the best indices for evaluating the status and risk of MetS.
Accumulating evidence has suggested that different anthropometric indices differ in determining MetS, but they are all cross-sectional. Thus, our study compared the ability to predict MetS of WC with other anthropometric indices including BMI, ABSI, AVI, BAI, BRI, CI, WHR and VAI to explicate the prospective differences in various anthropometric indices.
Methods
Study population
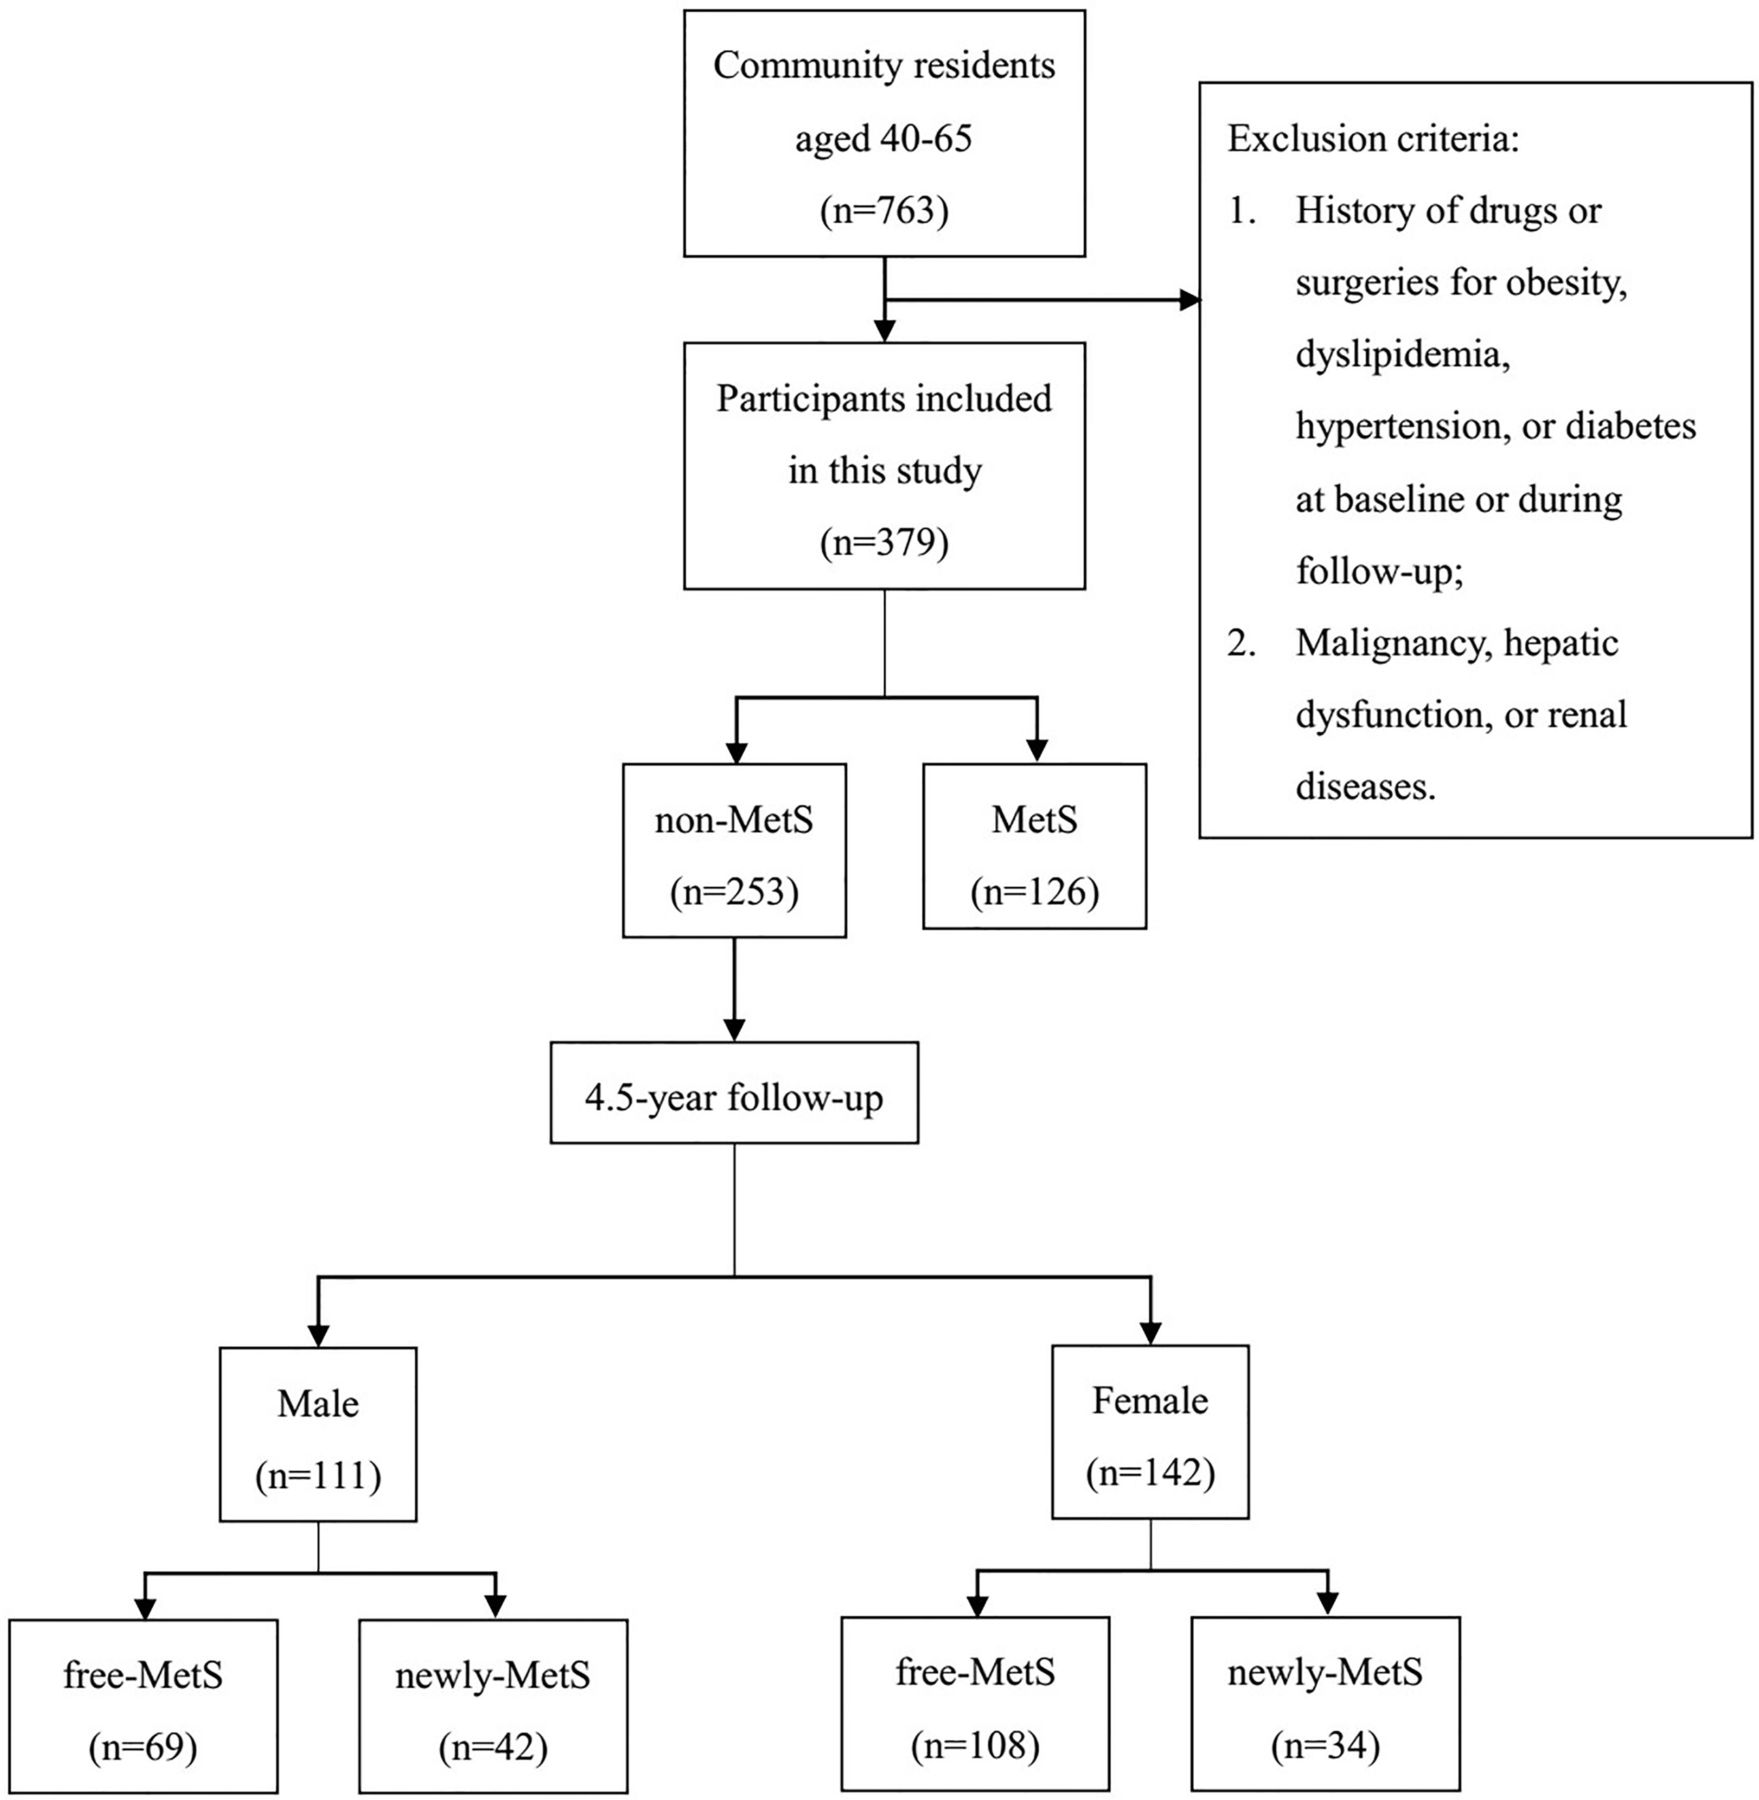
To evaluate the effectiveness of anthropometric indices in predicting MetS, a community-based prospective cohort was established in 2010 in urban Shenyang, Liaoning Province, China. All 763 residents of the community aged between 40 and 65 were recruited. Exclusion criteria were as follows: (1) participants with a history of drugs or surgeries for obesity, dyslipidaemia, hypertension or diabetes at baseline or during follow-up; (2) participants with malignancy, hepatic dysfunction or renal diseases. According to the above criteria, 379 participants were ultimately selected for this study. At baseline, 253 of them (111 men and 142 women) did not suffer from MetS and underwent a 4.5 year follow-up (figure 1).
Flow graph of individual recruitment. MetS, metabolic syndrome.
This study was approved by the Ethics Committee of the First Affiliated Hospital of China Medical University, and all participants provided signed informed consent before enrolment in this study.
Data measurement and collection
At baseline and at the endpoint, all participants underwent comprehensive interviews and health examinations by trained staff. A questionnaire, including demographic characteristics, personal medical history and information related to the diagnosis and treatment of MetS, was completed for each participant. Based on the previous standardised protocol,14 body weight, height, waist circumference, hip circumference (HC), systolic blood pressure (SBP) and diastolic blood pressure (DBP) were measured. Participants were given a standard 75 g oral glucose tolerance test (OGTT). Venous blood samples were drawn to determine fasting plasma glucose (FPG), plasma glucose for 2 hours after a glucose load (2hPG), fasting plasma insulin (FINS), total cholesterol, triglycerides (TG), high-density lipoprotein cholesterol (HDL) and low-density lipoprotein cholesterol (LDL) according to standard methods.14 15
At baseline, all participants had MRI scans performed at the abdominal level between the fourth and fifth lumbar vertebrae in the prone position (Fieldangle (FOV) 42 cm ×42 cm, thickness 1 cm, six layers, GE, USA). The subcutaneous fat area (SFA) and visceral fat area (VFA) were calculated using SLICE-O-MATIC V.4.2 software (Tomovision) by two separate technicians.
Metabolic syndrome definition
The diagnosis of MetS was based on the International Diabetes Federation criteria16 in 2009 and Chinese-specific abdominal obesity standard,8 which means that the individual with any three or more of the five following components were considered to have MetS: (1) abdominal obesity (WC ≥90 cm for men, 85 cm for women); (2) elevated TG (TG ≥1.70 mmol/L); (3) low HDL (HDL <1.0 mmol/L for males,<1.3 for women); (4) high blood pressure (SBP ≥130 mm Hg, DBP ≥85 mm Hg or a history of hypertension) and (5) elevated plasma glucose (FPG ≥5.6 mmol/L or a diagnosis of type 2 diabetes mellitus).
Calculations
The homeostatic model assessment index for insulin resistance (HOMA-IR) was evaluated using the following formula:
HOMA-IR=FPG (mmol/L)×FINS (mIU/L)/22.5
The anthropometric indices, such as BMI, WHR, ABSI, AVI, BAI, BRI, CI and VAI were calculated using the following formulas10 17–20:

Statistical analyses
Based on the diagnosis of MetS, the participants were assigned to the MetS or non-MetS group at baseline. During follow-up, participants in the non-MetS group were further divided into the newly MetS group and free-MetS group according to whether they developed MetS.
The data distribution was assessed using the Kolmogorov-Smirnov test. The variables were displayed as the mean±SD deviation, median (IQR) or count (percentage) according to their types. Univariate analyses were conducted to estimate the relative factors of MetS and its components using a t-test, Mann-Whitney rank sum test, Pearson’s χ2 test or Fisher’s exact test depending on the characteristics of the data. The area under receiver operating characteristic (ROC) curves was calculated to evaluate the abilities of the anthropometric indices to identify MetS. New cut-off points were suggested by Youden’s Index (sensitivity+specificity-1). The ability of each anthropometric index to predict MetS was shown as areas under the ROC curves and the CIs. DeLong et al’s non-parametric approach was used to compare the areas under the ROC curves.21 Statistical analyses were performed using SPSS V.23.0 (IBM). MedCalc V.16.2, (MedCalc Software, Belgium) was used to analyse the ROC curves. Statistical significance was defined as p<0.05 for all analyses.
Results
Baseline characteristics of the participants
According to the criteria mentioned above, 379 residents (198 men and 181 women) were included in the present study. Two hundred fifty-three of them were free of MetS and received follow-up. According to the criteria mentioned above, 198 men and 181 women were included in the present study. At baseline, 87 (43.9%) men and 39 (21.5%) women were diagnosed as having MetS. The median age of study participants was 49.5 (45.0–55.0) years for men and 47.0 (44.0–54.0) years for women. Compared with the non-MetS group, participants with MetS had significantly higher levels of SBP, DBP, FPG, 2hPG, FINS, HbA1c, TG, LDL, HOMA-IR, SFA and VFA but lower levels of HDL. TC was significantly increased in men with MetS, while no significant difference was observed in women between MetS and non-MetS. Furthermore, all of the nine anthropometric indices, including WC, BMI, WHR, ABSI, AVI, BAI, BRI, CI and VAI of the MetS group were elevated significantly in both men and women (table 1).
Baseline characteristics of study subjects according to the MetS status at baseline
In the non-MetS group, 42 (37.8%) men and 34 (23.9%) women developed MetS after the 4.5 year follow-up. Compared with the healthy controls, TG, SFA and VFA were significantly elevated in the newly-MetS group. Furthermore, women in the new MetS group had higher levels of SBP, DBP, 2hPG and LDL but lower levels of HDL at baseline. For anthropometric indices, WC, BMI, WHR, AVI, BRI, CI and VAI of the newly MetS group were higher in both men and women. Baseline BAI was increased in the newly MetS group for women, while no significant difference was observed between the free-MetS group and newly MetS group in men. Additionally, ABSI did not show a significant difference between the free-MetS and newly MetS groups in both men and women (table 2).
Baseline characteristics of healthy subjects who developed MetS or not at follow-up
Comparison of the anthropometric indices for diagnosing MetS at baseline
At baseline, the AUCs of all the anthropometric indices were larger than 0.5 (p<0.05), suggesting their diagnostic significance for MetS (table 3). Our results showed that the VAI had the largest AUC for both genders (0.85 (0.79–0.92) for men and 0.90 (0.84–0.96) for women). The BAI (0.67 (0.59–0.75)) and ABSI (0.62 (0.52–0.72)) showed the lowest AUCs for men and women, respectively. In men, AVI, BRI, CI and VAI had approximately the same AUCs as WC for diagnosing MetS (all p>0.05 vs WC). However, the AUCs of BMI, WHR, ABSI and BAI were significantly lower compared with WC for men (all p<0.05 vs WC). In women, the AUC of VAI was significantly larger than WC, while the AUCs of ABSI, BAI and CI were significantly lower (all p<0.05 vs WC). The other four anthropometric indices showed no significant differences with WC in diagnosing MetS for women (all p>0.05 vs WC).
AUCs of anthropometric indices in diagnosing of MetS at baseline
Comparison of the anthropometric indices for predicting MetS during follow-up
In general, the AUCs varied from 0.58 (0.49–0.68) for ABSI to 0.77 (0.68–0.85) for BMI in men and from 0.55 (0.47–0.64) for ABSI to 0.72 (0.64–0.79) for AVI in women. The AUC of ABSI was the lowest and did not differ from 0.5 in both men and women (p>0.05). Moreover, the AUC of BAI was significantly larger than 0.5 in men, while no difference from 0.5 was observed in women. All the AUCs of the other indices were greater than 0.5 (p<0.05), suggesting their clinical predictive significance for MetS. In men, BMI had the largest AUC but did not differ significantly from WC. WHR, AVI and BRI showed no significant difference with WC. Furthermore, ABSI, BAI, CI and VAI had significantly lower AUCs than WC. In women, no significant difference was observed between WC and BMI, WHR, AVI, BAI, BRI, CI or VAI. Moreover, ABSI had a significantly lower AUC than WC.
Other details of all the anthropometric indices such as cut-off, sensitivity, specificity, Youden index, positive predictive value (PPV) and negative predictive value (NPV) were also reported in this study (table 4).
AUCs, optimal cut-off, sensitivity, specificity, PPV and NPV for the anthropometric indices in ROC analysis for predicting MetS
AUCs of the anthropometric indices for predicting MetS components during follow-up
Compared with women, the morbidities of MetS, high TG and high blood glucose (BG) in men were elevated (37.8% vs 23.9%, 19.2% vs 8.5% and 24.8% vs 14.3%, respectively) after a 4.5 year follow-up. Morbidities of the other two MetS components showed no differences between men and women (see supplementary table 1). Furthermore, we made comparisons of all indices in predicting MetS components (table 5 and table 6). First, the AUCs of BMI, WHR, AVI and BRI had predictive significances for central obesity in men, while ABSI, BAI, CI and VAI did not. However, in women, the AUCs of ABSI, CI and VAI were not significantly larger than 0.5. In both genders, AVI had the largest AUC for incident central obesity, but did not differ significantly from WC. Second, BMI and VAI showed significances for predicting high TG in men. However, no significantly predictive value was observed in the remaining indicators for men or women. Moreover, the AUCs of all the indices were small for predicting low HDL and high BG, and none were significantly over 0.5. Therefore, none of the indices could discriminate among both men and women with low HDL or high BG. Lastly, either BAI or VAI had an AUC less than 0.5 for high blood pressure (BP) in men, and the AUCs of WHR, ABSI and VAI were significantly less than 0.5 in women. Furthermore, WC and AVI had the largest AUCs for high BP in men, and no difference was observed between these two indices. In women, the AUC of AVI was the largest for high BP but did not differ significantly from WC.
Comparison of AUCs for anthropometric indices in predicting MetS components in men
Comparison of AUCs for anthropometric indices in predicting MetS components in women
Discussion
There is abundant evidence that abdominal obesity is one of the most important risk factors of metabolic diseases such as diabetes mellitus and dyslipidaemia.8 22 The abdominal visceral fat area measured by MRI is still considered the best index to evaluate the extent of abdominal obesity.23 Our results showed that incident MetS patients had a higher baseline visceral fat area compared with non-MetS patients, confirming that abdominal visceral fat can be an excellent indicator for MetS. However, considering the cost, safety and many other factors, it is not realistic to carry out abdominal fat screening with MRI in the clinic. Therefore, accumulating studies have been conducted to find a more simple and non-invasive approach to describe abdominal obesity. For a long time, a variety of investigations have evaluated the ability of indices derived from several anthropometric parameters in determining MetS. Most of these studies were cross-sectional. In this study, we compared nine obesity indices, including WC, BMI, WHR, ABSI, AVI, BAI, BRI, CI and VAI, in assessing the incident risk of MetS using a 4.5 year prospective analysis. Our study indicated that some novel anthropometric indices may be insufficient for evaluating the incident risk of MetS.
At baseline, all the indices showed significant roles in diagnosing MetS, and VAI had the highest AUC value in both men and women. For calculation of the VAI value involving WC, BMI, TG and HDL, it is suggested that VAI might provide a broader evaluation of metabolic risk related to visceral fat dysfunction. Previous studies have reported that VAI has significant advantages over WC for determining cardiometabolic risk,10 24 25 even though a study in young adults indicated that VAI did not provide better efficiency of visceral adiposity assessment than WC and BMI.26 In our study, VAI was the best surrogate marker of MetS, especially considering the significant, excessive AUC in women.
Furthermore, we compared the AUCs of all the anthropometric indices for predicting MetS and its components. In general, ABSI did not show a predictive value for MetS in both genders. Previously, ABSI was reported to be a weak indicator for MetS in a few cross-sectional studies.27 28 This finding was confirmed by our prospective evidence. Furthermore, what was different from the cross-sectional results is that the AUC of VAI was less than WC and even had a significant difference in men. In 2014, Chen et al reported that the predictive performance of VAI is similar to WC for all-cause mortality,25 suggesting that VAI as a predictor of MetS is not superior to WC. Additionally, BMI and AVI showed the strongest ability in the prediction of MetS for men and women, respectively. However, neither BMI nor AVI had any significant difference from WC. In particular, considering the simplicity and widespread use of WC, it appeared to be a more useful predictor of MetS in clinical practice.
Our study also proposed optimal cut-off points for these anthropometric indices. An obvious difference between two genders was observed in WC, WHR, ABSI, BAI and VAI, suggesting that gender-specific reference values should be used in clinical practice. Notably, the present results showed that the optimal cut-off point for WC are considerably different from the cut-off point according to the guidelines on the prevention and treatment of metabolic dysfunction in Chinese adults.29 Therefore, it may be optimal that the decreased WC cut-off is used in the clinical setting to select Chinese adults at high risk of incident MetS. Additionally, all the PPVs of indices were less than NPVs, suggesting that the indices covered in this article were suitable for excluding the individuals with high risk for MetS from a non-MetS population.
Our study further found that the indices show different discriminatory power for different MetS components. AVI had the largest AUC for central obesity in both men and women. On the other hand, the VAI of men had the highest AUC value for high TG and high BP. In women, the AUC of AVI for high BP was larger than the other indices, while no indicator showed significance in predicting high TG. Interestingly, the CI played only a predictive role for new-onset high BP in both genders, suggesting its worse predictive ability for MetS components. Some scholars have suggested that this is probably because weight dilutes the influence of height according to its formula.30 Additionally, all the indices failed in forecasting incident low HDL and high BG, in contrast to other studies.9 10 24 31 One possible explanation is that only a few individuals developed low HDL and high BG, and the small sample size may impact on the reliability of results. In summary, the results above suggest that the current indicators of anthropometric indices cannot provide a comprehensive prediction of metabolic risk factors. Accordingly, further study to clarify the association of anthropometric parameters with MetS components is necessary.
Several limitations of the present study should be considered. First, this study was limited to middle-aged and elderly participants in Northeast China. Hence, the applicability of these results may be limited for other populations. Second, only the baseline anthropometric parameters were analysed in the study. For our study aims to assess the predictive abilities of anthropometric indices at baseline in a prospective cohort, it is likely that the anthropometric changes during the follow-up period had little effect on the current results. Finally,16 criteria were used in the present study to define metabolic syndrome. Therefore, further studies are needed to determine whether the results are consistent under different criteria.
Conclusions
In conclusion, VAI is the best index for the diagnosis of MetS. Moreover, BMI and AVI are superior to the other anthropometric indices for predicting MetS in men and women, respectively, but no obvious differences were observed between them and WC. Hence, considering the simplicity and wide use, WC remains the more practical discriminator for MetS.
Acknowledgments
We thank the participants and staff at the Institute of Endocrinology ofthe First Affiliated Hospital of China Medical University for their involvementin this study.
References
Footnotes
Contributors HW was the primary investigator and was involved in all steps. All authors contributed to the study design, were involved at all stages of manuscript development. ZS and YL reviewed and edited the manuscript. All authors read and approved the final manuscript.
Funding This work was supported by the Chinese National Natural Science Foundation (Grant: 81300645) and the National Science and Technology Support Program (Grant: 2009BAI80B00). The funders had no roles in the study design, data collection or analysis, or the presentation or publication of the results.
Competing interests None declared.
Ethics approval This study was approved by the Ethics Committee of the First Affiliated Hospital of China Medical University. Informed consent was obtained from all individual participants included in the study.
Provenance and peer review Not commissioned; externally peer reviewed.
Data sharing statement No additional data are available.