Article Text

Abstract
Objectives The American Orthopaedic Foot and Ankle Society (AOFAS) Ankle-Hindfoot Scale is among the most commonly used instruments for measuring outcome of treatment in patients who sustained a complex ankle or hindfoot injury. It consists of a patient-reported and a physician-reported part. A validated, Dutch version of this instrument is currently not available. The aim of this study was to translate the instrument into Dutch and to determine the measurement properties of the AOFAS Ankle-Hindfoot Scale Dutch language version (DLV) in patients with a unilateral ankle fracture.
Setting Multicentre (two Dutch hospitals), prospective observational study.
Participants In total, 142 patients with a unilateral ankle fracture were included. Ten patients were lost to follow-up.
Primary and secondary outcome measures Patients completed the subjective (patient-reported) part of the AOFAS Ankle-Hindfoot Scale-DLV. A physician or trained physician-assistant completed the physician-reported part. For comparison and evaluation of the measuring characteristics, the Foot Function Index and the Short Form-36 were completed by the patient. Descriptive statistics (including floor and ceiling effects), reliability (ie, internal consistency), construct validity, reproducibility (ie, test–retest reliability, agreement and smallest detectable change) and responsiveness were determined.
Results The AOFAS-DLV and its subscales showed good internal consistency (Cronbach’s α >0.90). Construct validity and longitudinal validity were proven to be adequate (76.5% of predefined hypotheses were confirmed). Floor effects were not present. Ceiling effects were present from 6 months onwards, as expected. Responsiveness was adequate, with a smallest detectable change of 12.0 points.
Conclusions The AOFAS-DLV is a reliable, valid and responsive measurement instrument for evaluating functional outcome in patients with a unilateral ankle fracture. This implies that the questionnaire is suitable to compare different treatment modalities within this population or to compare outcome across hospitals.
Trial registration The Netherlands Trial Register (NTR5613; 05-jan-2016).
- ankle
- fracture
- reliability
- responsiveness
- validity
This is an Open Access article distributed in accordance with the Creative Commons Attribution Non Commercial (CC BY-NC 4.0) license, which permits others to distribute, remix, adapt, build upon this work non-commercially, and license their derivative works on different terms, provided the original work is properly cited and the use is non-commercial. See: http://creativecommons.org/licenses/by-nc/4.0/
Statistics from Altmetric.com
Strengths and limitations of this study
This prospective, multicentre, observational study shows substantial, previously unknown information about the performance of the American Orthopaedic Foot and Ankle Society (AOFAS) Ankle-Hindfoot Scale.
The topic of the clinical study is relevant for orthopaedic trauma surgeons, since there is growing need for translated and validated patient-reported outcome measures that can be used for determining functional outcome over time.
The methodological design of the study is strong, and statistical analyses complied with the COnsensus-based Standards for the selection of health Measurement INstruments guidelines.
Although the study is mostly relevant for the Dutch-speaking regions, it is also informative for other regions.
Implementation of the (AOFAS) Ankle-Hindfoot Scale is limited by the fact that a clinician is required to complete the physician-reported part of the questionnaire. This hampers its use in, for example, large-scale registers.
Background
Ankle fractures are common injuries with a reported incidence rate of 187 fractures per 1 00 000 people each year.1 Due to an increasing number of people involved in sports and the growing elderly population, this rate is rising significantly in many industrialised countries.1 Ankle fractures can cause a temporary loss of function and quality of life. In order to monitor recovery after treatment, questionnaires regarding functional outcome are increasingly used in clinical practice and clinical research. They enable detailed evaluation of functional outcome and quality of life after (non-)operative treatment of musculoskeletal injuries from a patient’s perspective.
Although questionnaires completed by patients alone (so-called patient-reported outcome measures (PROMs)) may be preferred, many scores combine a patient-reported and a physician-reported part. Examples of PROMs used in foot and ankle research are the Maryland Foot Score (MFS),2 Foot and Ankle Ability Measure,3 the Foot Function Index (FFI),4 the Manchester-Oxford Foot Questionnaire (MOXFQ)5 6 and the Self-Reported Foot and Ankle Score (SEFAS).7
The clinical rating system published by the American Orthopaedic Foot and Ankle Society (AOFAS), the AOFAS Ankle-Hindfoot Scale, is one of the mostly used assessment tool in foot surgery.8 This clinical rating system, developed by Kitaoka et al, combines subjective scores of pain and function provided by the patient and objective scores based on the physician’s physical examination (ie, gait, sagittal motion, hindfoot motion, ankle-hindfoot stability and alignment of the ankle-hindfoot).9 The questionnaire includes nine items that can be divided into three subscales (pain, function and alignment). Each of the nine items is scored, accumulating to a total score ranging from 0 points (indicating severe pain and impairment) to 100 points (no symptoms or impairment).
Limitations on the use of the AOFAS Ankle-Hindfoot Scale are the fact that questions have a limited number of answers, some of which can be interpreted differently.10 11 An advantage is that the physician-reported questions on gait and range of motion provide relevant information that the PROMs do not provide.
The AOFAS Ankle-Hindfoot Scale as a complete scale has been shown to be responsive and valid in its original language version.9 12–14 The patient-reported part of the scale has been shown to be valid and reliable.15 Reliability of the objective (physician-reported) portion of the scale has not been published. Previous studies involved a wide spectrum of diagnoses, such as general ankle-hindfoot complaints,13 pending ankle or foot surgery,15 surgically treated calcaneal fractures14 and end-stage ankle osteoarthritis.12
A validated Dutch version of the AOFAS Ankle-Hindfoot Scale is not available. The aim of this study was to translate the questionnaire into Dutch and to culturally adapt it to the Dutch population. The next aim was to determine the measurement properties of the AOFAS Ankle-Hindfoot Scale Dutch language version (AOFAS-DLV) in patients who sustained an ankle fracture.
Methods
Study design and ethics statement
This study followed a multicentre, prospective, observational study design (ie, case series) and was performed at two Dutch hospitals. The study is registered at the Netherlands Trial Register (NTR5613). A detailed study protocol is published elsewhere.16 The study was approved by the Medical Research Ethics Committees or Local Ethics Boards of all participating centres. All patients provided informed consent.
Translation
First, the American (original) version of the AOFAS Hindfoot-Ankle Scale was translated and cultural adapted into Dutch according to the guideline for Cross Cultural Adaptation of Self-Report Measures by Beaton et al,17 as described in detail in the published study protocol.16 In the last stage of this guideline, the prefinal Dutch version was tested in a group of 20 patients, presenting themselves with various foot/ankle problems in one of the participating hospitals. Since there were no ambiguities or misunderstandings of the questions in this group, the translated questionnaire was considered the final AOFAS Ankle-Hindfoot Scale-DLV (see online supplementary table 1).
Supplementary file 1
Validation
Patient recruitment
Patients were recruited from 1 May 2014 to 29 March 2016. Patients were identified from hospital records, based on their International Coding of Diseases, 10th revision (ICD-10) code or Diagnosis Related Group (DRG; in Dutch, DBC) code. Inclusion criteria were: 1) unilateral ankle fracture; 2) age 18 years or older and 3) provision of informed consent by the patient. Treatment should have been started between 6 weeks and 3 months and/or between 7 and 9 months prior to the start of the study. Exclusion criteria were: 1) multiple trauma (only if functional recovery of additional injuries was not achieved at time of enrolment, as that likely affects the outcome scores); 2) pathological fracture; 3) severe physical comorbidity (ie, American Society of Anaesthesiologists ≥3); 4) patient was non-ambulatory prior to the injury; 5) insufficient comprehension of the Dutch language to understand and complete the questionnaires and 6) expected problems of maintaining follow-up.
In total, 142 individual participants were included, 70 completed t=1 and t=2, 132 completed t=2 and t=3 (figure 1). During the course of the study, 10 patients were lost to follow-up. One patient, who participated in the test–retest part, had to be removed from the analysis; due to removal of osteosynthesis material, the patient reported a change in function between both recordings.

Flowchart. aPatients who participated in both groups. ASA, American Society of Anesthesiologists.
The median age was 46 years (P25 -P75 35–60), see table 1. The majority of patients (n=75; 52.8%) were male. Most ankle fractures were unimalleolar (n=100; 70.4%), and the majority (n=84; 59.2%) were treated operatively.
Demographic data for the study population
The AOFAS Ankle-Hindfoot Scale-DLV, the Foot Function Index (FFI-DLV) and the Short Form Health Survey (SF-36-DLV) questionnaires could be completed in total on three occasions: at 2 months (t=1), 7 months (t=2) and 7.5 months (t=3) after trauma. Two months was chosen as first moment after start of weight bearing where both the questions of the patient-reported and physician-reported part could be answered; a low score was expected. At 7 months, the majority of patients were expected to have reached their maximum recovery, giving the highest possible AOFAS score. That score was also expected at t=3. The time between the recordings was 5–6 months (responsiveness, t=1 and t=2) and/or 2–3 weeks (test–retest, t=2 and t=3) in between. Patients were allowed to participate in both the responsiveness and test–retest part, and if so, the questionnaires at t=2 were also used as first questionnaire for test–retest reliability.
Questionnaires and data collection
The FFI is a scoring system developed to measure the impact of foot pathology. It consists of 23 items, which are grouped into the subscales pain, disability and activity limitation. Scores for all (sub)scales range from 0 (no disability) to 100 (highest level of disability).4
The SF-36 Health Survey is a generic measure of health status.18–25 It consists of 36 items, representing eight domains that are grouped into a physical component summary (PCS) and a mental component summary (MCS).
One research physician and one research assistant performed the physical examination that is part of the physician-reported part of the AOFAS Ankle-Hindfoot Scale-DLV using a standardised protocol. Both assessors received elaborate training by an experienced trauma surgeon. Data for each patient was completed by the same assessor. Patients completed the patient-reported part, as well as the FFI and SF-36. Demographic, injury and treatment data were collected from the patient’s medical files.
Statistical analysis
Statistical analyses were performed using the Statistical Package for Social Sciences (SPSS, V.21). Data are reported following the STrengthening the Reporting of OBservational studies in Epidemiology.26 Since raw data for individual items were analysed, missing data were not imputed. Descriptive statistics was used in order to describe the main characteristics of the study participants and the questionnaire scores at the different time points. Measurement properties of the AOFAS-DLV (sub)scales were determined by comparing these (sub)scales with the FFI and SF-36 (sub)scales. They were determined in compliance with the COnsensus-based Standards for the selection of health Measurement Instruments guidelines.27 A detailed description of the measurement properties and statistical analysis is shown in the published study protocol.16 A summary is given below.
Floor and ceiling effects are present if more than 15% of the study population rates the lowest or highest possible score.16 28 29 Data for each time point were evaluated separately.
Internal consistency (measure of reliability) was considered adequate if the Cronbach’s α value is between 0.70 and 0.95, provided that the scale is unidimensional.28 For reasons of heterogeneity in scores, data for t=1 were used.
Construct validity was assessed by determining the correlation of the AOFAS-DLV (sub)scales with (sub)scales of the FFI and SF-36. Spearman’s rho (rank correlation) coefficients (r) were calculated since data were non-parametric. Data of t=1 were used. Strength of correlation was categorised as high (r>0.6), moderate (0.3 < r<0.6) or low (r<0.3).30 Construct validity was considered adequate if at least 75% of the results were in line with the predefined hypotheses in a (sub)sample of at least 50 patients.28 Expected correlations are given in online supplementary table 2A.
Evaluation of the test–retest reliability was performed by calculating the intraclass correlation coefficient (ICCagreement) of (sub)scales administered at t=2 and t=3. ICC is reported with 95% CI. Reliability was given a positive rating when the ICC is at least 0.70 in a sample size with a minimum of 50 patients.28
The degree of absolute agreement was expressed as the SE of measurement (SEMagreement). For individual patients, the smallest detectable change (SDC) was calculated as 1.96 x √2 x SEM.28 The SDC measurable in a group of people (SDCgroup) was calculated by dividing the SDC in individuals (SDCind) by √n.31 32 Finally, the reliable change index (RCI) was calculated, representing the SDC as a percentage of the maximum obtainable score.
The degree of absolute agreement was also determined with a Bland and Altman analysis.33 The limits of agreement equal the mean change in scores of repeated measurements (meanchange) ±1.96 x SD of these changes (SDchange).28 Zero falling outside this interval indicates bias in the measurements.
Analogous to construct validity, longitudinal validity (a measure of responsiveness) was assessed by testing predefined hypotheses (online supplementary table 2B) about expected correlations between changes in AOFAS Ankle-Hindfoot scale-DLV (sub)scales versus changes in FFI and SF-36 (sub)scales.28 Change scores were calculated from t=1 to t=2. Since data were non-parametric, Spearman’s rank correlation coefficients were calculated. Longitudinal validity was considered adequate if at least 75% of the results were in line with the predefined hypotheses in a (sub)sample of at least 50 patients.28
The effect size (ES) and standardised response mean (SRM) were determined as measures of the magnitude of change over time, using the data of t=1 and t=2. ES was calculated as change in score (t=2−t=1)/SDT1 (28). SRM was calculated as change in score (t=2–t=1)/SDchange.28 Values of 0.2–0.4 were considered a small effect, 0.5–0.7 a moderate and 0.8 or higher a large effect.34 Large effect sizes were expected a priori, since at t=1 patients were expected to have functional limitations, whereas at t=2 full recovery was expected for most patients.
Results
The changes over time in AOFAS-total, FFI-total, SF-36 PCS, SF-36 MCS, SF-36 PF and SF-36 BP are shown in figure 2. The AOFAS and SF-36 (all subscales) show an increase in scores in the period from t=1 to t=2. The FFI, focusing on disabilities rather than function, shows a decrease in score. Scores at t=2 and t=3 were similar for all instruments.

OFAS Ankle-Hindfoot (A), Foot Function Index (B), Short Form-36 PCS (C), SF-36 MCS (D), SF-36 PF (E), and SF-36 BP (F) scores at each follow-up visit in patients with an ankle fracture. AOFAS, American Orthopaedic Foot and Ankle Society; BP, bodily pain; FFI, Foot Function Index; MCS, mental component summary; PCS, physical component summary; PF, physical functioning; SF-36, Short Form-36.
Floor and ceiling effects
A floor effect was only present in two SF-36 subscales; namely SF-36 RP subscale at t=1; 58.6% of the patients reported the minimum score, at t=2 (19.7%) and t=3 (17.6%), and the SF-36 RE subscale at t=1 (28.6%); figure 3A).

Floor effects (A) and ceiling effects (B) of the instruments used in patients with an ankle fracture. Out of a maximum of 70 at t=1, N=65 for AOFAS function and total, N=69 for AOFAS alignment, and N=70 for AOFAS pain and all (sub)scales of FFI and SF-36. Out of a maximum of 138 at t=2, N=131 for SF-36 PCS and MCS, N=133 for SF-36 PF, N=136 for SF-36 VT, N=137 for AOFAS function, AOFAS total, and SF-36 RP, BP, SF, and RE, N=138 for AOFAS pain and alignment, all FFI (sub)scales, and SF-36 GH and MH N=138 for AOFAS pain and alignment, 137 for AOFAS function and AOFAS total. Out of a maximum of 125 at t=3, N=123 for SF-36 PF, PCS, and MCS, N=124 for AOFAS alignment and total, and SF-36 VT, and N=125 for AOFAS pain and function, all FFI (sub)scales, and SF-36 RP, BP, GH, SF, RE, and MH. The dotted line represents the acceptable 15% of patients with the maximum score. The SF-36 PCS and MCS did not demonstrate a floor or a ceiling effect and are not displayed. AOFAS, American Orthopaedic Foot and Ankle Society; FFI, Foot Function Index; SF-36, Short Form-36.
A ceiling effect was present in several (sub)scales, and became more evident at longer follow-up (figure 3B). The AOFAS pain subscale had a ceiling effect from the t=1 onwards, where 22.9% of patients reported the maximum score. From t=2 onwards, ceiling effects were also noted for AOFAS function (27.0%) and alignment (65.9%) subscales, FFI pain (16.7%) and disability (21.0%) subscales, and SF-36 BP (21.9%) and PF (19.5%) subscales. The AOFAS as a total scale only showed a ceiling effect at t=3; 17.7% of patients reported the maximum score.
Reliability
Internal consistency
The Cronbach’s α for the AOFAS total scale and function subscale were 0.947 and 0.927, respectively, representing adequate internal consistency (table 2). The value for the total scale should be interpreted carefully as it contains three subscales. Cronbach’s α could not be calculated for AOFAS pain and alignment subscales, since these have one item only.
Internal consistency of the instruments used in patients with an ankle fracture
The FFI total scale (α=0.649) and pain subscale (α=0.687) did not show adequate internal consistency. For the total scale, this may be explained by the fact that it is not unidimensional. All SF-36 (sub)scales showed adequate internal consistency, with the exception of the subscales general health (α=0.621) and vitality (α=0.648).
Construct validity
Spearman’s rank correlations regarding construct validity are shown in table 3. Construct validity was adequate for all AOFAS (sub)scales; out of 17 correlations, 14 (82.4%) were in line with predefined hypotheses for the total scale, 13 (76.5%) for the pain subscale, 15 (88.2%) for the function subscale and 16 (94.1%) for the alignment subscale.
Construct validity of the instruments in patients with an ankle fracture
Reproducibility
Test–retest reliability
The ICC indicates the reliability of each (sub)scale (table 4). The calculated ICC for the total AOFAS (sub)scales ranged from 0.85 to 0.93, indicating adequate test–retest reliability. The ICC was also proven to be adequate (>0.70) for all FFI and SF-36 (sub)scales, with the exception of SF-36 subscale General Health perceptions (ICC=0.64).
Intraclass correlation coefficient (ICC) and Bland-Altman analysis of the instruments in ankle fracture patients
Agreement and smallest detectable change
The level of agreement is indicated by the SDC and the corresponding RCI, as listed in table 4. The SDC was 12.0 (RCI: 12.0%) for the AOFAS total scale, 16.4 (RCI: 16.4%) for the FFI total scale, 10.7 (RCI: 15.3%) for the SF-36 PCS subscale and 11.36 (RCI: 14.6%) for the SF-36 MCS subscale.
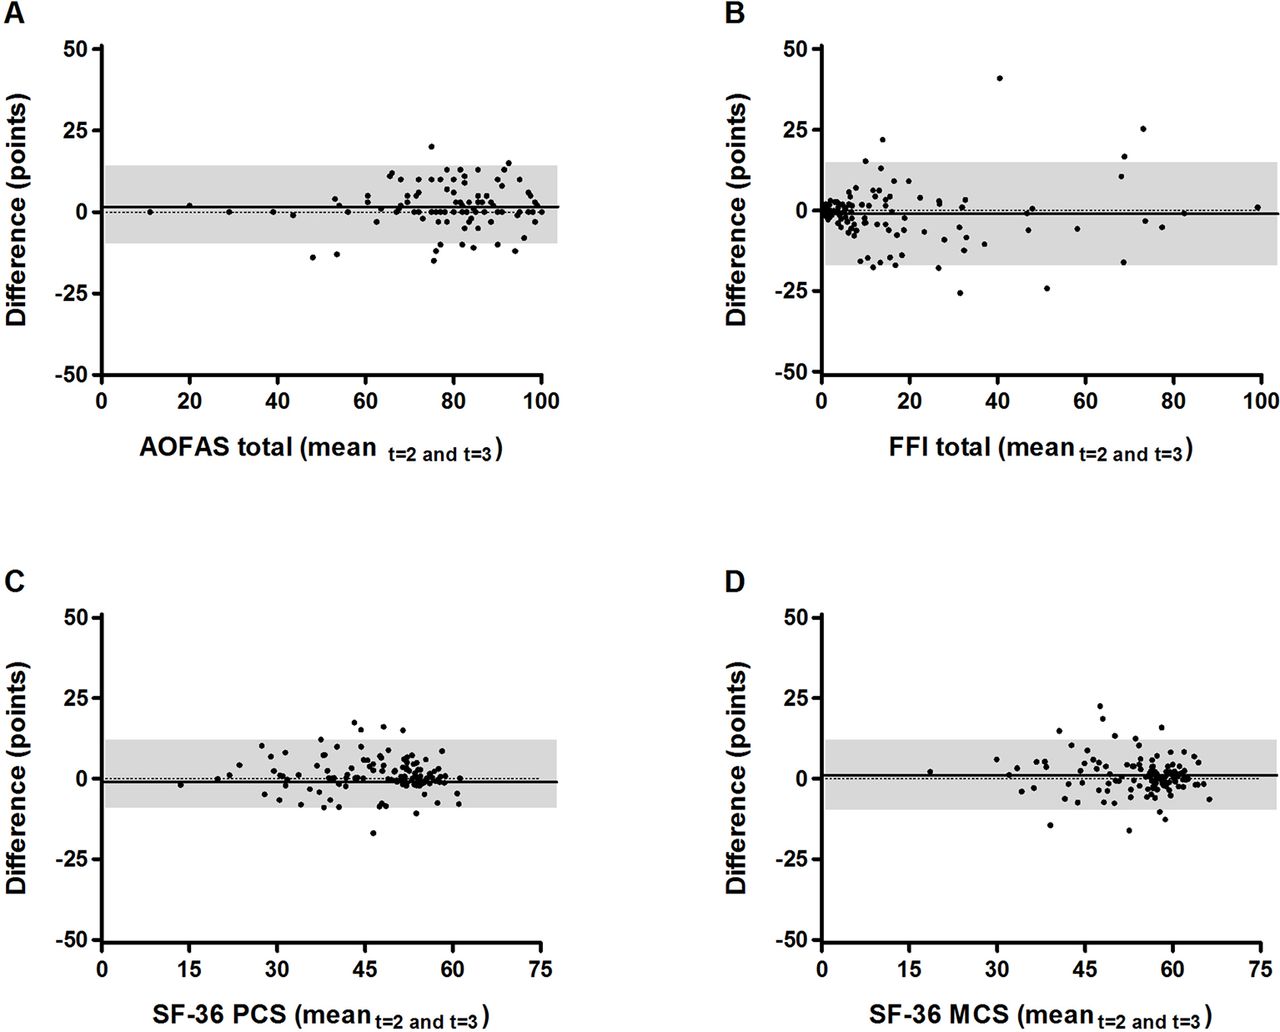
For the Bland-Altman analysis (figure 4 and table 4), there is no bias in measurements, as the 95% limits of agreement for the mean change in scores contains zero for every single (sub)scale.

Bland-Altman plots for AOFAS Ankle-Hindfoot (A), Foot Function Index (B), Short Form-36 PCS (C), and SF-36 MCS (D) scores in patients with an ankle fracture. Change scores were calculated from t=2 to t=3. Each dot represents a single patient. The black line indicates the mean difference. The upper and lower edges of the grey box are the 95% limits ofagreement. AOFAS, American Orthopaedic Foot and Ankle Society; FFI, Foot Function Index; MCS, mental component summary; PCS, physical component summary; SF-36, Short Form-36.
Responsiveness
Spearman’s rank correlation coefficients for longitudinal validity are shown in table 5. Longitudinal validity was adequate for all AOFAS (sub)scales; out of 17 correlations, 15 (88.2%) were in line with predefined hypotheses for the total scale, 14 (82.5%) for the AOFAS pain subscale, 13 (76.5%) for function subscale and 17 (100%) for alignment subscale.
Longitudinal validity of the instruments in patients with an ankle fracture
The SRM and the ES of the instruments are presented in table 6. The AOFAS total scale (SRM 1.07, ES 0.89) and function subscale (SRM 1.29, ES 1.06) had a large magnitude of change. The one-item subscale showed a moderate ES for pain (SRM 0.27) and a small ES for alignment (SRM <0.2).
Responsiveness: standardised response mean (SRM) and effect size (ES) of the instruments in patients with an ankle fracture
Discussion
The results of this study showed that the AOFAS-DLV is a valid, reliable and responsive instrument for measuring symptoms and disability in patients who suffered an ankle fracture.
effects were not present for the AOFAS-DLV in this study. Ceiling effects, on the other hand, did occur. The AOFAS total scale showed a ceiling effect at t=3. Ceiling effects were expected to occur at follow-up moments t=2 and t=3, as most patients were expected to have achieved full recovery (and thus the maximum score) at those follow-up moments. Ceiling effects have been reported in another study for the same reason.20 Another study found no ceiling effects for the AOFAS Ankle-Hindfoot Scale at 6 months after elective surgery for a variety of chronic ankle and hindfoot disorders.7
Evaluating the predictions about Spearman’s rank correlations between all (sub)scales, the AOFAS scale as a total showed adequate construct validity. This is in correspondence with previous research, conducted by Ibrahim et al.15 Construct validity also showed to be adequate for all AOFAS subscales separately. The correlations between the AOFAS total score and the SF-36 did show to be higher than the correlations found by SooHoo et al.35 Instead of a high correlation, they found the SF-36 subscales bodily pain, and physical functioning to have a moderate correlation with the AOFAS total scale. The difference in correlation was even bigger for the SF-36 PCS, which SooHoo et al found to have a low, instead of a high correlation with the AOFAS total scale in this study.35 A possible explanation for these differences is the difference in study population, as this study only focused on ankle fractures and SooHoo et al included all injuries of the ankle and hindfoot.35
As far as conclusions can be drawn, the AOFAS Ankle-Hindfoot scale DLV appears to have adequate internal consistency. Cronbach’s α for the AOFAS scale as a total is 0.947. This value however, should be interpreted carefully as this scale is not unidimensional. Pinsker et al also did find Cronbach’s α to be adequate (α=0.84) for the five patient-reported items of the AOFAS Ankle-Hindfoot scale in the original language.10
The reliability of the AOFAS DLV is proven to be sufficient, as the ICC for the total AOFAS scale was 0.93. Sufficient reliability has been shown before.7 15 This reflects the instrument as a whole. Being interested in the performance of the AOFAS DLV as a whole, the intraobserver or interobserver reliability of the physician-reported part alone was not analysed. The separate subscales also showed to be reliable on an independent level, with ICC of >0.70 for all AOFAS subscales. Validation studies for the Portuguese and Turkish version of the AOFAS Ankle-Hindfoot scale in patients with variable chronic pathologies and joint injuries, respectively, found similar ICC values of 0.92 (p<0.001) and 0.89 (p=0.001), respectively.36 37
Responsiveness of the AOFAS-DLV, considered being a product of longitudinal validity and magnitude of change, was adequate in this study. Concerning longitudinal validity, >75% of all hypothesised correlations for Spearman’s rho were confirmed, indicating adequate longitudinal validity. This confirms previous studies.9 12–14 Magnitude of change for the outcome measures was high for the AOFAS Ankle-Hindfoot scale DLV as a whole, with an SRM of 1.07 and ES of 0.89. This is comparable to the magnitude of change for the total FFI (SRM −0.93, ES −0.74) and the SF-36 subscales with the highest magnitude of change (PCS, PF, RP and SF) in our study. Values for SRM and ES of the AOFAS-DLV found in this study are in correspondence with the values found in previous research by SooHoo et al,13 regarding the original AOFAS Ankle-Hindfoot scale (SRM 1.10, ES 1.12). They are also in line with other studies evaluating the AOFAS and the SEFAS.7
The level of agreement of the AOFAS total scale compared well with the FFI and SF-36 in this study. The SEM for the AOFAS-DLV was 4.3 points. The SDC was 12.0 points. Similar values for SEM and SDC were found in the validation study of the AOFAS Ankle-Hindfoot Scale in Turkish (SEM, 4.8 points and SDC 13.3 points).36
The Bland-Altman analysis showed there is no bias in measurements, as the 95% limits of agreement for the mean change in scores contained zero for every single (sub)scale. As the AOFAS-DLV shows sufficient reliability and the level of agreement is equivalent to the level of agreement of the SF-36 and FFI (which are both validated patient-reported outcome measures), the reproducibility of the questionnaire is proven to be acceptable.
A limitation could be the arbitrary choice of t=1 and t=2 for calculating longitudinal validity, ES and SRM. These measurement properties require the largest change scores. Completing the questionnaires early after trauma (ie, at 2 months, low scores expected) and at 7 months (ie, maximum recovery expected) was aimed to achieve the largest change score. Despite good measurement properties of the AOFAS-DLV, a limitation of its use is the fact that a physician has to complete a part of the questionnaire. That makes it unsuitable for, foe example, use in large-scale registers. For that purpose, PROMs like the FFI, MOXFQ and SEFAS may be interesting. The last two have sufficient response rates, internal consistency, test–retest reliability and responsiveness in patients with surgically treated chronic ankle and hindfoot disorders.6 7 Data for ankle fractures are not yet available. Current data are in support of using the FFI as PROM.
Conclusion
This study evaluated the measurement properties of the AOFAS Ankle-Hindfoot scale DLV and confirmed it is a reliable, valid and responsive measurement instrument for evaluating functional outcome in Dutch patients with a unilateral ankle fracture. This makes the questionnaire suitable for comparing outcome in future studies and after different treatment modalities within this study population or for comparing outcome across hospitals or between patient groups.
References
Footnotes
Contributors EMMVL, ASDB, DEM, CHVDV, PTDH, WET and MJHV developed the study. ASDB and EMMVL drafted the manuscript. EMMVL acted as trial principal investigator. ASDB, RJCT, FVDS, CHVDV, PTDH, DEM and MHJV participated in patient inclusion and outcome assessment. ASDB, WET and EMMVL performed statistical analysis of the study data. All authors have read and approved the final manuscript.
Funding This research received no specific grant from any funding agency in the public, commercial or not-for-profit sectors. There are no statements to declare relating contributorship, datasharing or ethics approval.
Competing interests None declared.
Ethics approval Medical Research Ethics Committees or Local Ethics Boards of all participating centres.
Provenance and peer review Not commissioned; externally peer reviewed.
Data sharing statement All data are processed in this manuscript. There are no further unpublished data from the study available.
Collaborators AOFAS study Group: D A Newhall, E N Van derVelden-Macauley, L Vellekoop, J Romeo
Correction notice This article has been corrected since it first published. The Research group and Collaborators have been added.