Article Text

Abstract
Objectives While maintenance of both phosphorus concentration and nutritional status is a major concern in managing haemodialysis patients, the interaction between these parameters is not well understood. The aim of this study was to assess whether or not nutritional index influences the association between phosphorus concentration and all-cause mortality.
Design A cohort study.
Setting The Dialysis Outcomes and Practice Pattern Study, which included 99 representative dialysis facilities in Japan between 1997 and 2010.
Participants A total of 6230 adult haemodialysis patients who had spent at least 6 months on haemodialysis.
Main predictors Six categories based on time-averaged factors of the geriatric nutritional risk index (GNRI; the lowest two and highest tertiles) and phosphorus concentration (<3.5, 3.5 to <6 and ≥6 mg/dL).
Primary outcome measure All-cause mortality rate.
Analysis Time-dependent Cox regression adjusting for potential confounders.
Results During the follow-up period (12 294 person-years), we noted 561 deaths (4.6 per 100 person-years), and both high phosphorus concentrations and low-middle GNRI were separately associated with all-cause mortality. The harmful effect of high phosphorus concentrations on all-cause mortality was stronger in patients with high GNRI than in those with low-middle GNRI. On the other hand, the harmful effect of low phosphorus concentrations was stronger in those with low-middle GNRI than in those with high GNRI. Relative excess risk due to interaction (RERI) between high phosphorus concentrations and low-middle GNRI was −0.57, indicating an antagonistic interaction. We also observed a significant statistical multiplicative interaction between phosphorus concentrations and GNRI (p=0.05 by likelihood ratio test).
Conclusions The association between time-averaged serum phosphorus concentration and all-cause mortality differs across the nutritional index. Accordingly, nutritional index should be considered when the impact of phosphorus concentration on mortality in haemodialysis patients is evaluated.
- nephrology
- epidemiology
- dialysis
This is an Open Access article distributed in accordance with the Creative Commons Attribution Non Commercial (CC BY-NC 4.0) license, which permits others to distribute, remix, adapt, build upon this work non-commercially, and license their derivative works on different terms, provided the original work is properly cited and the use is non-commercial. See: http://creativecommons.org/licenses/by-nc/4.0/
Statistics from Altmetric.com
Strengths and limitations of this study
While a number of previous studies have examined the association between phosphorus concentration and mortality after adjusting for nutritional indices, these studies failed to account for the interaction between nutritional index and phosphorus concentration.
We analysed a large (>6000) representative dialysis population in Japan.
We defined exposure categories based on two categorical factors (phosphorus concentration and nutritional index), which allowed us to examine the separate and combined effects of these components and to examine their additive interaction by calculating the relative excess risk due to interaction.
We specifically examined time-averaged phosphorus concentration and nutritional index because subsequent phosphorus and nutritional index values changed dramatically from those at baseline.
A limitation of this study is that it is an observational study and residual confounding due to unmeasured factors may affect the association between exposure categories and mortality.
Introduction
Both phosphorus concentration and nutritional status have attracted attention in the management of haemodialysis patients due to their association with mortality.1–5 However, while preventing hyperphosphatemia6–8 and improving nutritional status4 9 10 are understandably major concerns, accomplishing both tasks simultaneously has largely proven difficult.11 Reducing phosphorus concentration is primarily accomplished using phosphate binders and phosphate restriction,11 the latter of which often involves protein restriction and may thereby worsen nutritional status.12 In light of the difficulties associated with managing these side effects, physicians have concerns as to whether or not reducing phosphorus concentration actually improves survival inpatients at risk of nutrition-related morbidity and mortality.12 13 However, at present, it is unclear whether or not the association between phosphorus concentration and mortality differs across the nutritional index.
As nutritional index and phosphorus concentration are linked and may change dramatically overtime, the interaction between time-dependent nutritional index and phosphorus concentration must be carefully considered when evaluating their separate and combined effects on mortality.14 Although the Geriatric Nutritional Risk Index (GNRI)15 was originally intended for use as a screening tool for predicting risk of morbidity and mortality in elderly patients, it has since been validated for use in whole haemodialysis patients.16 17 Low GNRI is indicative of nutrition-related risk for mortality and morbidity. As such, clarifying its effect on the association between phosphorus concentration and mortality will aid in determining the effectiveness of outcome-oriented phosphorus management in haemodialysis patients.
Here, to clarify whether time-averaged GNRI modifies the association between time-averaged phosphorus concentration and mortality, we conducted a cohort study using data from the Dialysis Outcomes and Practice Pattern Study (DOPPS) in Japan (1997–2010).
Methods
Study population and data sources
Our cohort study used Japan-derived data from DOPPS, an international longitudinal study of haemodialysis patients which aims to identify practice patterns associated with improved patient outcomes. Participants in DOPPS were randomly selected from representative dialysis facilities within participating countries. Details regarding the design of DOPPS have been described in full elsewhere.18
The study included 6230 haemodialysis patients aged ≥18 years from 99 representative dialysis facilities in Japan who had spent at least 6 months on haemodialysis (figure 1). All eligible patients were selected from DOPPS I (1997–2001), II (2002–2004), III (2005–2007) and IV (2008–2010). Baseline data regarding demographic information, comorbid conditions, medication for mineral bone disorder and laboratory values were obtained at enrolment. Time-dependent data (GNRI and phosphorus concentration) and mortality data (time and cause) were obtained from the database during the follow-up period. GNRI was calculated as follows:

Selection process for study population. DOPPS, the Dialysis Outcomes and Practice Pattern Study; GNRI, Geriatric Nutritional Risk Index.
GNRI=(14.89×albumin [g/dL])+[41.7×(body weight/ideal body weight)] where ‘ideal body weight’ was calculated using the Lorentz formula as follows:
Ideal body weight for men=height−100− [(height−150)/4]
Ideal body weight for women=height−100−[(height−150)/2.5]
We set (body weight/ideal body weight) as ‘1’ when ‘body weight’ exceeded ‘ideal body weight’.15 In this cohort, ‘body weight’ exceeded ‘ideal body weight’ in 26% of patients.
Definition of exposure
Exposure categories were defined based on the categorical factors of GNRI (low-middle, lower two tertiles; high, the highest tertile) and serum phosphorus concentrations (low, <3.5 mg/dL; middle, 3.5 to <6. mg/dL; high, ≥6 mg/dL). We evaluated GNRI and serum phosphorus concentrations by first using time-averaged variables, which were updated every 4 months to obtain the most recent mean values after study entry, and then using fixed baseline variables measured at study entry. The reference category for GNRI was the highest tertile, and the lower two tertiles were regarded as the high-risk category. The reference category for phosphorus concentration was the middle category (3.5 to <6 mg/dL) and the low (<3.5 mg/dL) and high (≥6 mg/dL) categories were regarded as high-risk categories. Based on these two risk categories, we defined six exposure categories: ‘low-middle GNRI and low phosphorus’, ‘low-middle GNRI and middle phosphorus’, ‘low-middle GNRI and high phosphorus’, ‘high GNRI and low phosphorus’, ‘high GNRI and middle phosphorus’ and ‘high GNRI and high phosphorus’. The cut-off values for phosphorus concentration were defined according to the Japanese clinical guidelines.19 The cut-off values for GNRI were defined based on the highest tertile established in this study, with ‘high GNRI and middle phosphorus’ defined as the reference category, as previous studies have suggested that this category has the lowest mortality risk.2 16 18 20–22
Outcomes
The primary outcome measure was HR for all-cause mortality. Patients were followed from study entry until death, transplantation, transfer to another facility, modality change, withdrawal or study end, whichever came first. The secondary outcome measure was HR for cardiovascular mortality, which included sudden deaths, deaths from heart failure, acute myocardial infarction, cerebrovascular disease and other vascular diseases.
Statistical analysis
We conducted baseline and time-dependent Cox regression to estimate HRs and their 95% CIs for the association between exposure categories and all-cause mortality. The baseline Cox regression used baseline fixed exposure categories, and the time-dependent Cox regression used time-averaged exposure categories. In our analyses using the combined phosphorus concentration and GNRI categories, the HR for ‘high phosphorus concentration and high GNRI’ to ‘middle phosphorus concentration and high GNRI’ (the reference category) indicates the effect of high phosphorus concentration on outcomes. The HR for ‘low-middle GNRI and middle phosphorus concentration’ to the reference category indicates the effect of low-middle GNRI on outcomes. Our Cox model included adjustments for age, gender, time on dialysis, 11 comorbid conditions, single-pool Kt/V (quintiles), phosphate binder use, oral or intravenous vitamin D receptor activator (VDRA) use and DOPPS phase, all of which were indicated as potential confounding factors in previous studies.2 3 22–27 Given their potential to function as intermediate factors between phosphorus concentration and mortality, we used fixed baseline variables of these covariates in the model. For Cox models, we used robust variance estimates to consider cluster effects at the facility level (correlation between patients).
We examined interactions between GNRI and phosphorus concentration in two ways. First, we assessed a statistical multiplicative interaction using the likelihood ratio test, which compares models with and without interaction terms. Second, to assess an additive interaction between high phosphorus concentration and low-middle GNRI, we estimated the relative excess risk due to interaction (RERI) using the method described by Rothman.28 29 RERI between two factors (A and B) is defined as ‘departure from additive effects’ and is calculated as follows using adjusted HRs30:
RERI=HR(A&B)−HR(A)−HR(B)+1
RERI<0, RERI=0, and RERI>0 indicate an antagonistic interaction, absence of interaction and synergistic interaction respectively.
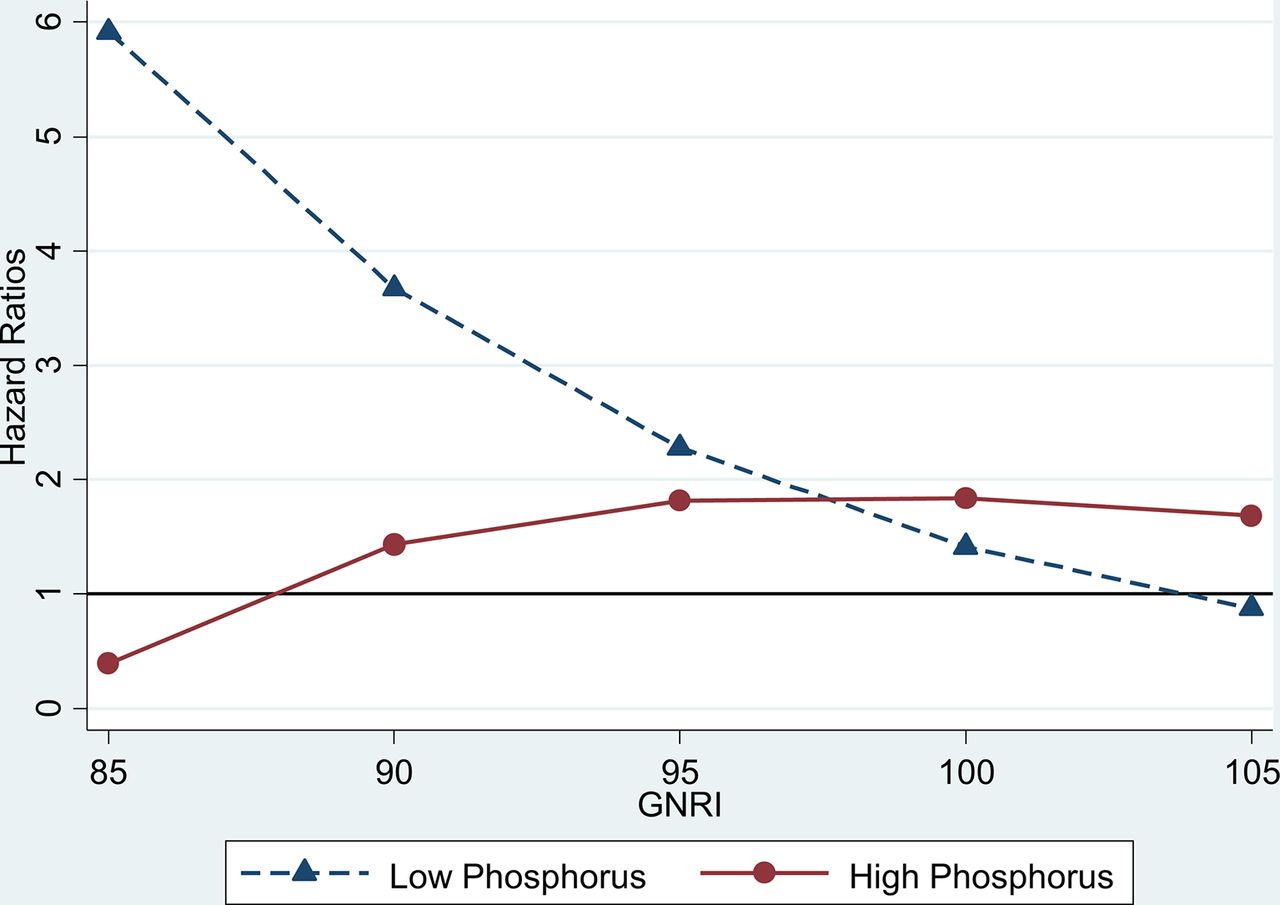
To examine how the effects of phosphorus concentration changes according to GNRI levels, we estimated the effect of a discrete change in phosphorus category across GNRI levels. HRs of ‘low phosphorus’ and ‘high phosphorus’ were estimated by comparing with the reference category of ‘middle phosphorus’. Therefore, we reported HRs for ‘low phosphorus’ and ‘high phosphorus’ from two phosphorus categories. After conducting time-dependent Cox regression with the interaction term for continuous GNRI and categorical phosphorus concentration, we estimated the average marginal effect of phosphorus categories (high and low phosphorus concentration) on all-cause mortality at each GNRI level (GNRI levels: 85, 90, 95, 100 and 105). The reference GNRI level was set at 100 based on the highest tertile. We used ‘MARGINS’ and ‘MARGINSPLOT’ commands in Stata for figure 2.

Effect of nutritional index on HRs for the association between phosphorus concentration and mortality. HRs of high (≥6 mg/dL) and low (<3.5 mg/dL) phosphorus concentrations on all-cause mortality by Geriatric Nutritional Risk Index (GNRI) level (GNRI levels: 85, 90, 95, 100 and 105). The reference GNRI level was set at 100 based on the highest tertile.
All analyses were performed using Stata V.14.2 software.
Results
Baseline patient characteristics
Figure 1 shows the participant selection process. A total of 6230 haemodialysis patients were included in this study. The mean (±SD) age was 61.1 (±12.5) years, 60.8% of patients were men, median (IQR) dialysis duration was 5.8 (2.6 to 11.3) years and 29.7% of patients had diabetes. The median GNRI value was 94.9 (low GNRI, 53.4 to 91.8; middle GNRI, 91.8 to 97.5; high GNRI, 97.5 to 125.9) and the range of the lower two tertiles was <97.5, indicating patients with nutrition-related mortality risk, according to the original study.15 A total of 6% of patients had low phosphorus concentrations while 35.6% had high phosphorus concentrations. Baseline characteristics by combined GNRI and phosphorus concentration categories are shown in table 1. Associations between GNRI values and phosphorus concentration and nPNA are summarised in (online supplementary table 1).
Baseline characteristics by combined GNRI and phosphorus concentration categories
Association between GNRI, phosphorus concentration and all-cause mortality
Table 2 shows incidence rates and HRs for all-cause mortality according to baseline and time-averaged exposure categories. Median follow-up time was 2.1 years. During the follow-up period (total: 12 294 person-years), we recorded 561 all-cause deaths (4.6 per 100 person-years).
HRs for all-cause and cardiovascular mortality by baseline and time-averaged exposure categories
In the time-dependent Cox model, both time-averaged factors of high phosphorus concentration and low-middle GNRI were associated with all-cause mortality after adjusting for potential confounders. The HR for ‘high GNRI and high phosphorus’ indicated that there was an effect of high phosphorus concentration on all-cause mortality (HR 1.66, 95% CI 1.01 to 2.73) compared with ‘high GNRI and middle phosphorus’ (the reference category). The HR for ‘low-middle GNRI and middle phosphorus’ indicated that there was an effect of low-middle GNRI on all-cause mortality (HR 2.12, 95% CI 1.51 to 2.96) compared with the reference category. We found the highest mortality rate in patients with both ‘low-middle GNRI and low phosphorus’ (HR 4.28, 95% CI 2.66 to 6.88), highlighting the combined effect of low-middle GNRI and low phosphorus concentration.
In the baseline Cox model, both baseline fixed factors of high phosphorus concentration and low-middle GNRI level were associated with all-cause mortality after adjusting for potential confounders. We found the highest mortality rate in patients with both ‘low-middle GNRI and low phosphorus’.
Interaction between GNRI and phosphorus concentration on all-cause mortality
In the time-dependent Cox model, the RERI was −0.57 between time-averaged high phosphorus concentration and low-middle GNRI with respect to all-cause mortality, indicating an antagonistic interaction. We also observed a significant statistical multiplicative interaction between these factors and all-cause mortality (p=0.05 by a likelihood ratio test).
Figure 2 shows the HRs for high and low phosphorus concentrations across the GNRI. The harmful effect of high phosphorus concentration increases with increasing GNRI. On the other hand, the harmful effect of low phosphorus concentration decreases with increasing GNRI.
Association between GNRI, phosphorus concentration and cardiovascular mortality
Table 2 shows the incidence rates and HRs for cardiovascular mortality according to baseline and time-averaged exposure categories. We observed 286 cardiovascular deaths (2.3 per 100 person-years) during the follow-up period.
In the time-dependent Cox model, high phosphorus concentration and low GNRI was associated with cardiovascular mortality. The HR for ‘high GNRI and high phosphorus’ indicates that there was an effect of high phosphorus concentration on cardiovascular mortality (HR 2.02, 95% CI 1.18 to 3.45) compared with ‘high GNRI and middle phosphorus’ (the reference category). The HR for ‘low-middle GNRI and middle phosphorus’ indicates that there was an effect of low-middle GNRI on cardiovascular mortality (HR 1.80, 95% CI 1.20 to 2.70). We found the highest cardiovascular mortality rate in patients with ‘low-middle GNRI and low phosphorus’ (HR 3.04, 95% CI 1.62 to 5.67).
In the baseline Cox model, baseline fixed factors of high phosphorus (‘high GNRI and high phosphorus’ versus ‘high GNRI and middle phosphorus’) and low GNRI (‘low-middle GNRI and middle phosphorus’ versus ‘high GNRI and middle phosphorus’) were not significantly associated with cardiovascular mortality. We found the highest cardiovascular mortality rate in patients with ‘low-middle GNRI and low phosphorus’ (HR2.39, 95% CI 1.33 to 4.30).
Interaction between GNRI and phosphorus concentration on cardiovascular mortality
In the time-dependent Cox model, the RERI was −0.47 between time-averaged high phosphorus concentrations and low-middle GNRI with respect to cardiovascular mortality, indicating an antagonistic interaction. However, we did not find a significant statistical multiplicative interaction between these factors and cardiovascular mortality (p=0.22 by a likelihood ratio test).
Discussion
In this cohort study, we found that both phosphorus concentration and nutritional index were separately associated with all-cause mortality and, more importantly, that there were interactions between these two factors. The association between high phosphorus concentrations and mortality was stronger inpatients with a high nutritional index than in those with a low-middle nutritional index, with opposite findings for low phosphorus concentrations and mortality (figure 2). These results suggest that the association between phosphorus concentration and mortality is indeed modified by nutritional index, suggesting that nutritional index should be considered in the management of phosphorus concentration in haemodialysis patients.
Two-thirds of haemodialysis patients here were at risk of nutrition-related mortality (low-medium GNRI (<97.5) was associated with increased mortality rate).15 We also found that abnormalities in phosphorus concentration, which have been shown to be associated with mortality,22 31 32 were highly prevalent regardless of GNRI category (table 1). Taken together, these results indicate the clinical importance of both the separate and combined association of these time-averaged factors with clinical outcomes.
While a number of previous studies have examined the associations between phosphorus concentration and mortality after adjusting for nutritional indices such as serum albumin concentration,1 2 31 32 these studies failed to account for the interaction between nutritional index and phosphorus concentration. A recent study in Austria noted statistical multiplicative interactions between time-varying phosphorus and albumin, in which time-varying factors were updated to the most recent values every 3 months.14 Here, we confirmed a statistical multiplicative interaction between time-averaged phosphorus concentration and GNRI on all-cause mortality.
Two different types of interaction have been posited: statistical interaction and additive interaction, with the two concepts often confounding one another. Statistical interaction refers to any departure of the value of the combined effect from that of additive or multiplicative effects of the two risk factors, depending on the statistical model used. In contrast, additive interaction always refers to departure from additive effects, regardless of the statistical model used. Further, the degree of additive interaction may be estimated by calculating measures of additive interaction, such as the RERI.28 29 In the present study, RERI calculations30 showed antagonistic interactions between high phosphorus concentrations and low GNRI.
Two plausible reasons have been proposed to explain the interaction between phosphorus concentration and GNRI. First, the influence of low-middle GNRI may outweigh the association between high phosphorus concentration and mortality if the association between low-middle GNRI and mortality is stronger than that of high phosphorus concentration and mortality. Second, the mechanism of the association between phosphorus concentration and mortality may differ by GNRI category. Inpatients in high GNRI categories, high phosphorus concentration could be a risk factor as a promoter of vascular calcification. However, in those with low-middle GNRI, high phosphorus concentration may denote sufficient dietary intake and improving nutrition.
Clinical guidelines and previous studies recommend regular assessment of nutritional status for all haemodialysis patients, which can be conducted using GNRI, among other methods.6–8 15–17 We used GNRI as a nutritional index to classify patients according to nutrition-related mortality risk for a number of reasons. First, GNRI can be calculated relatively simply using available objective data and does not require subjective assessment or judgement—an aspect that makes it a particularly useful index in clinical practice. Second, clinical guidelines recommend nutritional assessment by multiple measurements, a criterion which GNRI satisfies as it is calculated using multiple factors, including gender, body weight, height and serum albumin concentration. Finally, a number of previous studies have found GNRI to be an accurate index for identifying haemodialysis patients at risk of malnutrition17 and mortality.16 However, it should be noted that low-middle GNRI is not necessarily indicative of malnutrition, as the GNRI formula includes serum albumin concentration, which is affected by chronic inflammation and fluid volume expansion.33–35 Further, some investigators have suggested that malnutrition may be a consequence of chronic inflammation,36–38 making it difficult to separate inflammation from malnutrition and to examine their independent effects on mortality.
Several strengths of the present study warrant mention. The major strength is the analysis of a large (>6000) representative dialysis population in Japan from DOPPS. Participants in DOPPS are representative dialysis patients of a particular country selected via a stratified random sampling method.39 Second, we defined exposure categories based on two categorical factors (phosphorus concentration and GNRI), which allowed us to examine the separate and combined effects of these components and to examine their additive interaction by calculating the RERI. Third, we specifically used time-averaged phosphorus concentration and GNRI, as subsequent values of phosphorus and GNRI changed dramatically from baseline values. Fourth, we confirmed the interaction between GNRI and phosphorus concentration via several methods, thereby underscoring the validity of our results.
Several limitations of our study also warrant mention. First, residual confounding due to unmeasured factors may affect the association between exposure categories and mortality. To minimise the effects of this potential confounding, we included available baseline data in our multivariable model. Given that we found consistent associations even after the addition of other covariates to the model (online supplementary table 2), we believe that our findings are sound. Second, we lacked data from other nutritional scoring tools, such as subjective global assessment (SGA)40 and malnutrition-inflammation score (MIS).41 However, GNRI can be calculated more simply than SGA and MIS, using available data which are often measured in daily practice. Third, we lacked data on the type and dose of phosphate binders, which might confound the association between phosphorus concentration and mortality. Fourth, results of time-dependent analysis are heavily affected by clinical conditions before death. For example, patients who experience acute drops in phosphorus concentration or GNRI are known to be likely to die more quickly. We believe that using time-averaged categories of phosphorus concentration and GNRI allowed us to detect accumulated effects on mortality in time-dependent analysis after changes in these factors during the follow-up period. We also found similar associations between baseline fixed exposure categories and outcomes. It should be noted that we used fixed baseline covariates for laboratory values and medications, as these can represent intermediate factors between phosphorus concentration and mortality. Finally, this study included only Japanese haemodialysis patients and our findings may therefore not be representative of those from other countries. As such, interpreting and generalising these results should be conducted with care.
Conclusion
We found that GNRI modified the association between phosphorus concentration and mortality, with both high phosphorus concentration and low-medium GNRI associated with mortality. We noted a significant statistical multiplicative interaction between phosphorus concentration and GNRI on all-cause mortality. We also noted an antagonistic interaction between high phosphorus concentration and low-medium GNRI. Taken together, these findings suggest that the impact of phosphorus concentration on mortality is not consistent across nutritional status. Therefore, nutritional index should be considered when evaluating the impact of phosphorus concentration on mortality, and when making decisions regarding treatment with phosphorus management in haemodialysis patients.
Acknowledgments
None
Acknowledgments
The DOPPS is supported by research grants from Amgen and Kyowa Hakko Kirin, without restriction on publication. Kyowa Hakko Kirin received permission from Arbour Research Collaborative for Health to use DOPPS data in Japan and entered in to a non-exclusive licence agreement for use of data with Arbour Research Collaborative for Health and Institute for Health Outcomes and Process Evaluation Research (iHope) effective 1 November 2016.
References
Footnotes
Contributors SF designed research; SF and TI conducted research; SF and TI analysed data; SF wrote the paper; SF and TA provided critical review of the manuscript; SF had primary responsibility for final content.
Funding This study was funded by Kyowa Hakko Kirin.
Competing interests SF is an advisor on epidemiology studies for Kyowa Hakko Kirin and receives consulting fees from Kyowa Hakko Kirin. TA receives consulting fees from Chugai, Kirin and Abbott and grants/funds from Chugai and Kirin.
Patient consent Obtained.
Ethics approval Kyoto Univeristy.
Provenance and peer review Not commissioned; externally peer reviewed.
Data sharing statement No additional data are available.