Article Text

Abstract
Objectives Elevated blood cholesterol is a modifiable risk factor for cardiovascular disease. Cholesterol level surveillance is necessary to study population disease burden, consider priorities for prevention and intervention and understand the effect of diet, lifestyle and treatment. Previous studies show a cholesterol decline in recent decades but lack data to follow individuals born in different decades throughout life.
Methods We investigated changes in age-specific and birth cohort-specific total cholesterol (TC) levels in 43 710 women and men born in 1905–1977 (aged 20–95 years at screening) in the population-based Tromsø Study. Fifty-nine per cent of the participants had more than one and up to six repeated TC measurements during 1979–2016. Linear mixed models were used to test for time trends.
Results Mean TC decreased during 1979–2016 in both women and men and in all age groups. The decrease in TC in age group 40–49 years was 1.2 mmol/L in women and 1.0 mmol/L in men. Both the 80th and the 20th percentile of the population TC distribution decreased in both sexes and all age groups. Longitudinal analysis showed that TC increased with age to a peak around middle age followed by a decrease. At any given age, TC significantly decreased with increase in year born. Lipid-lowering drug use was rare in 1994, increased thereafter, but was low (<3% in women and <5% in men) among those younger than 50 years in all surveys. Between 1994 and 2016, lipid-lowering drug treatment in individuals 50 years and older explained 21% and 28% of the decrease in TC levels in women and men, respectively.
Conclusions We found a substantial decrease in mean TC levels in the general population between 1979 and 2016 in all age groups. In birth cohorts, TC increased with age to a peak around middle age followed by a decrease.
- anticholesterolemic agents
- cholesterol
- cohort studies
- epidemiology
- lipids
- longitudinal studies
This is an Open Access article distributed in accordance with the Creative Commons Attribution Non Commercial (CC BY-NC 4.0) license, which permits others to distribute, remix, adapt, build upon this work non-commercially, and license their derivative works on different terms, provided the original work is properly cited and the use is non-commercial. See: http://creativecommons.org/licenses/by-nc/4.0/
Statistics from Altmetric.com
Strengths and limitations of this study
A strength of this study is the inclusion of repeated measurements of total cholesterol and lipid-lowering drug use in the same individuals in a population-based sample, over four decades.
A limitation of this study is that, due to different sampling procedures between the surveys, not all birth cohorts could be followed from young adulthood to older age.
Another limitation is that 41% of the participants contributed with only one blood sample.
Further, a limitation is that data on weight, diet and other potential mediators of cholesterol changes have not been included in the analyses.
Introduction
High blood cholesterol is a modifiable risk factor for cardiovascular disease (CVD)1 and was estimated to be responsible for more than 10% of global CVD deaths in 2010.2 Reduction in total cholesterol was found to account for about one-third of the reduction in coronary heart disease (CHD) incidence3 and mortality4–6 in recent studies. Although cholesterol levels decreased in Western Europe, North America and Australasia in recent decades, cholesterol levels in these regions are still well above the recommended goal of <5 mmol/L.7 A reversal of decreasing cholesterol trends has been reported from Sweden and Finland, coinciding with an increase in fat intake.8 9 Taken together, surveillance of cholesterol trends is needed to study disease burden, to consider priorities for CVD prevention and intervention and to understand the effect of diet, lifestyle and lipid-lowering drug (LLD) use.7
Previous population studies of trends in cholesterol levels lack data to follow long-term trends combined with information on LLD treatment in individuals born in different decades.7 In the present analysis from the large population-based Tromsø Study, we included 43 710 men and women born between 1905 and 1977, aged 20–95 years at screening, who participated in surveys conducted from 1979 to 2016. The study design allowed us to analyse both secular trends of total serum cholesterol (ie, cross-sectional trends in age groups) and longitudinal trends (ie, follow individuals or birth cohorts with repeated measurements) and LLD use in a general population.
Methods
Study population
The Tromsø Study is an ongoing population-based cohort study in the municipality of Tromsø, Northern Norway, with a population of 75 000 inhabitants (46 000 in 1979). The study includes six surveys (Tromsø 1: 1974, Tromsø 2: 1979–1980, Tromsø 3: 1986–1987, Tromsø 4: 1994–1995, Tromsø 5: 2001, Tromsø 6: 2007–2008 and Tromsø 7: 2015–2016) to which total birth cohorts and representative samples of the population were invited.10 Response rates were between 66% and 79%. A total of 45 473 women and men participated.
Participants in at least one of the surveys conducted from 1979 to 2016 (Tromsø 2–7, n=44 489) were eligible for the present analysis. We excluded the first survey (Tromsø 1) because it included men only, subjects who did not consent to research (n=181), were born before 1905 (n=29), attended Tromsø 3 without an invitation or were younger than 20 years of age (n=499) or did not have any cholesterol measurements (n=70). Altogether, we included 43 710 subjects (51% women) aged 20–95 years. Fifty-nine per cent had more than one measurement (19% had two, 15% had three, 12% had four, 8% had five and 5% had six repeated cholesterol measurements).
The Regional Committee of Medical and Health Research Ethics and the Norwegian Data Protection Authority have approved the Tromsø Study, and therefore all procedures performed were in accordance with the 1964 Declaration of Helsinki and its later amendments. The participants have given informed consent.
Measurements
Non-fasting venous blood samples were collected by standard methods by trained personnel, with the participant sitting. A brief venous stasis applied to the upper arm was released before venipuncture. Serum total cholesterol concentrations were analysed within 48 hours by CHOD-PAP enzymatic colorimetric methods with commercial kits (Boehringer-Mannheim (Tromsø 2–4) and Roche Diagnostics (Tromsø 5–7), Mannheim, Germany) at the Department of Laboratory Medicine, University Hospital of North Norway, Tromsø. Use of LLD was assessed through questionnaires (Tromsø 4–7, except participants ≥70 years in Tromsø 4) and a written list of brand names of medications used on regular basis checked by health personnel at the study site (in Tromsø 4, only in individuals aged 55–74 years and 5.5% of participants >74 years). Thus, 1362 participants 75–97 years were not asked about LLD use in Tromsø 4. Self-report of medication used regularly for chronic conditions is considered accurate.11 A comparison of data from Tromsø 6 and information from the Norwegian Prescription Database (time window 180 days) showed a kappa value of 0.94 (95% CI 0.93 to 0.95) for LLD (A E Eggen, unpublished data, 2017).
Statistics
Secular
Population means of total cholesterol (mmol/L) (table 1) according to survey number were estimated in sex-specific analyses and 10-year age groups using linear mixed models with indicator variables of survey number as independent variables. Linear mixed models were used to estimate linear trend over surveys within each 10-year age group using date of surveys as a continuous time variable. The unit for the regression coefficient was reported per 10 years. In a separate set of analyses, we assessed whether the observed trends in total cholesterol were independent of high-density lipoprotein (HDL) cholesterol by including HDL cholesterol as a covariate in the models. Linear mixed models were also used to estimate secular trends in age-adjusted means across surveys within two age intervals, 30–49 years and 50–89 years (figure 1). Adjustment for age was performed by modelling cubic polynomials for age. An autoregressive order 1 covariance matrix was specified to control for dependencies between repeated measures using restricted maximum likelihood as the estimation method. Descriptive characteristics were calculated by survey (online supplementary material table 1).
Supplementary file 1
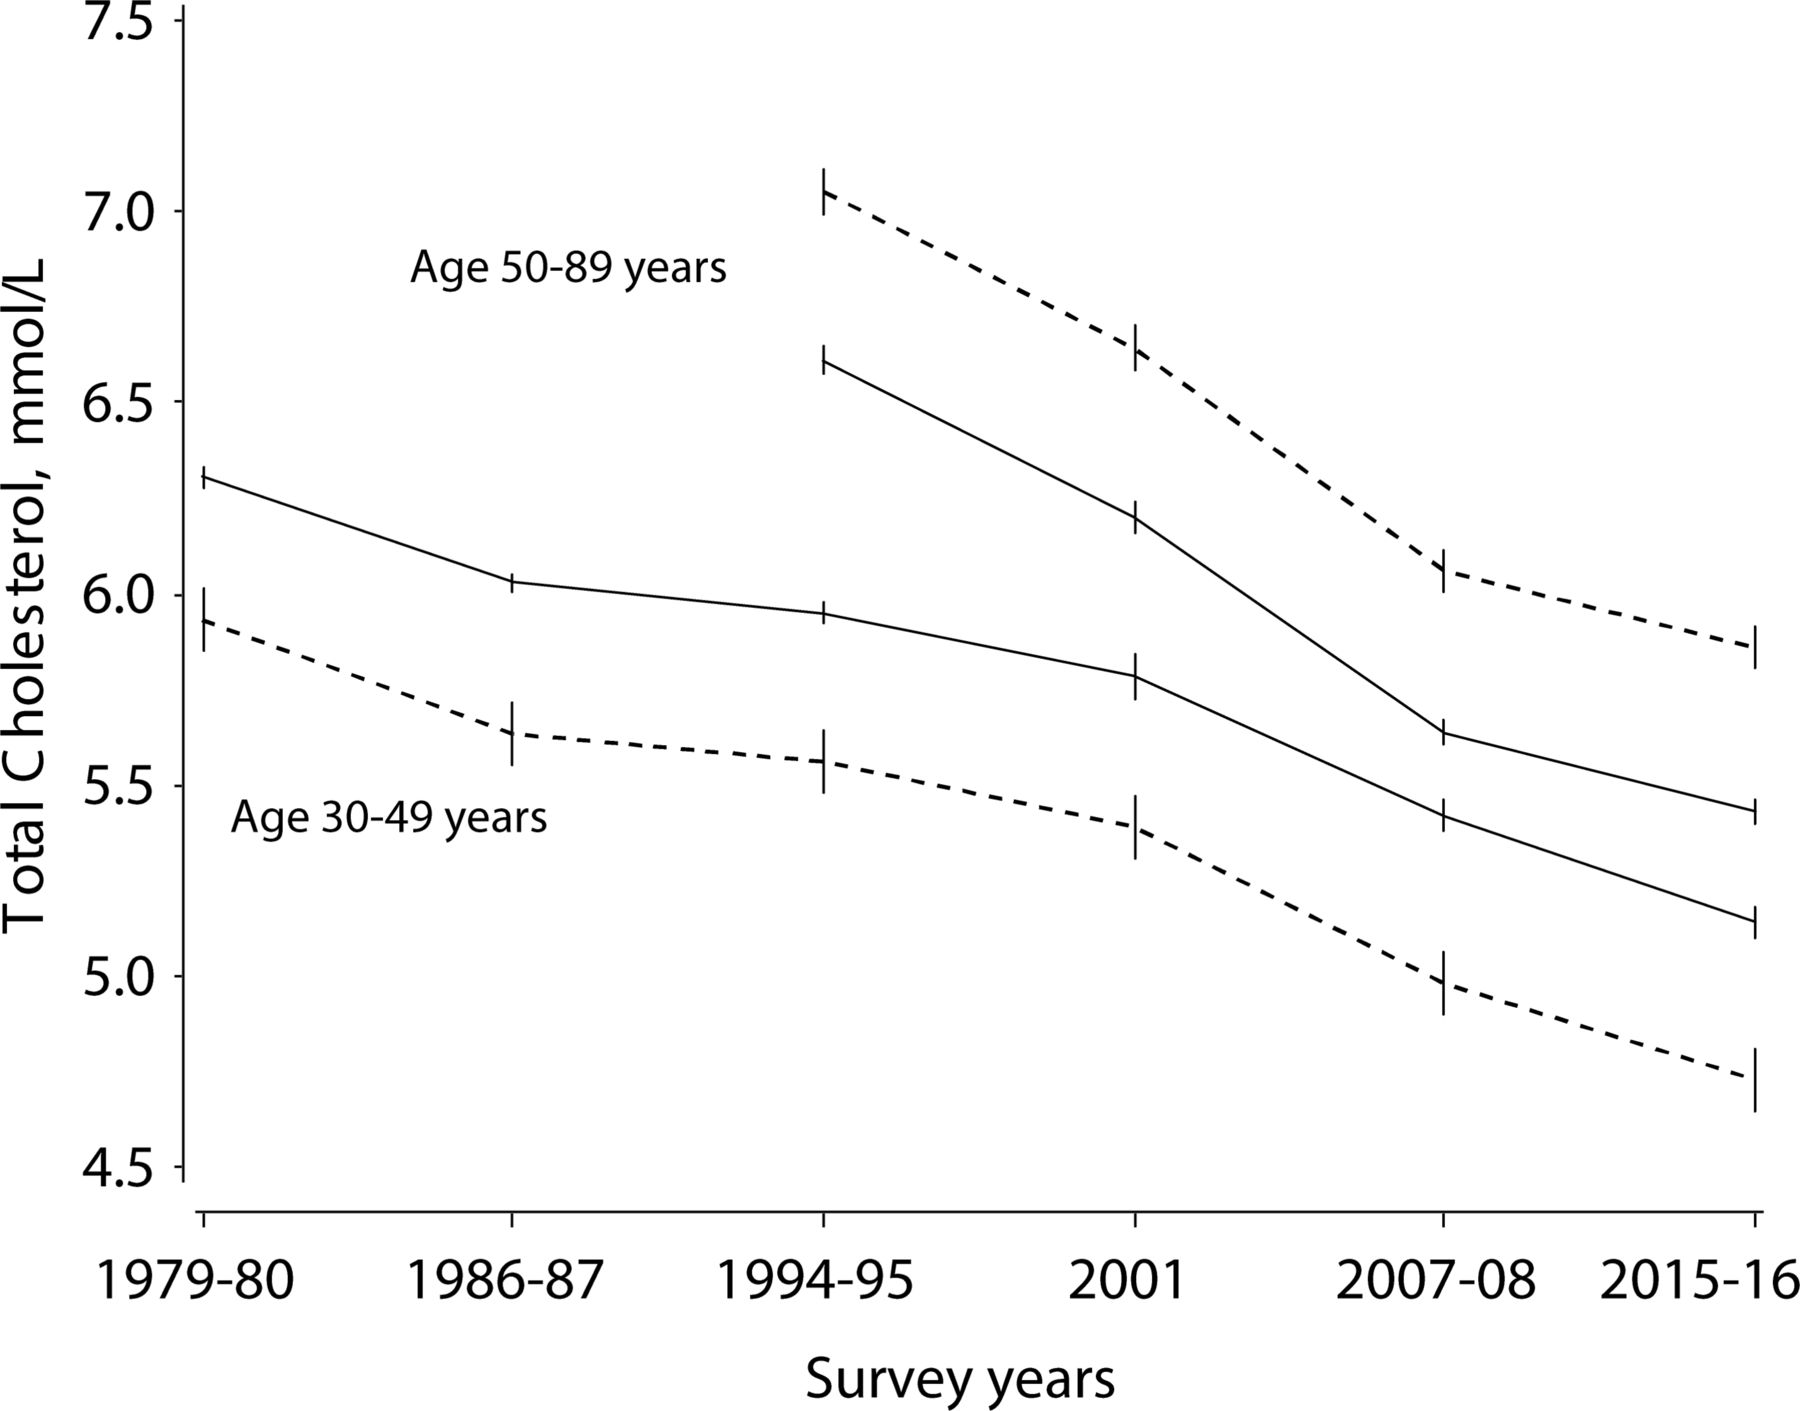
Trends in age-adjusted mean total cholesterol (mmol/L) in women (dotted line) and men (solid line) in 1979–2008 aged 30–49 years and 50–89 years with 95% CIs. The Tromsø Study 1979–2016.
Estimated mean total cholesterol (mmol/L) by sex, survey and age group*: the Tromsø Study 1979–2008
We calculated the 20th, 50th and 80th centiles of the cholesterol distribution in Tromsø 2–7 for each 10-year age group in women and men (online supplementary material tables 2 and 3) and the differences in cholesterol concentrations between Tromsø 4 and Tromsø 7 in mean and 20th, 50th and 80th centiles to track changes in the cholesterol distribution (table 2).
Differences in cholesterol levels (mmol/L) between 1994–1995 and 2015–2016 by sex and age group: the Tromsø Study
The proportion (%) of current users of LLD (table 3) was calculated in sex-specific analyses according to strata of surveys and 10-year age groups, with generalised estimation equation to test for linear trend over surveys within each 10-year age group using date of surveys as a continuous variable. An exchangeable covariance matrix was specified to control for dependencies between repeated observations.
Time trends in population studies may be related to selection bias as healthier subsets of the population are likely to participate in later (repeated) surveys. We therefore calculated differences in cholesterol levels dependent on participation in one or more surveys for sensitivity analyses (online supplementary material tables 4 and 5).
Prevalence (%) of current lipid-lowering drugs use by sex, survey and age group: the Tromsø Study 1994–2016
The change in cholesterol levels that could be explained by LLD use was estimated by the expression:

where βs are regression coefficients for the linear time trend in cholesterol in linear mixed models adjusted for age, βt, and additional adjustment for LLD use, βt*.
We created cholesterol kernel density distribution curves12 for Tromsø 4 and Tromsø 7 (figure 2), using the kde procedure in SAS .
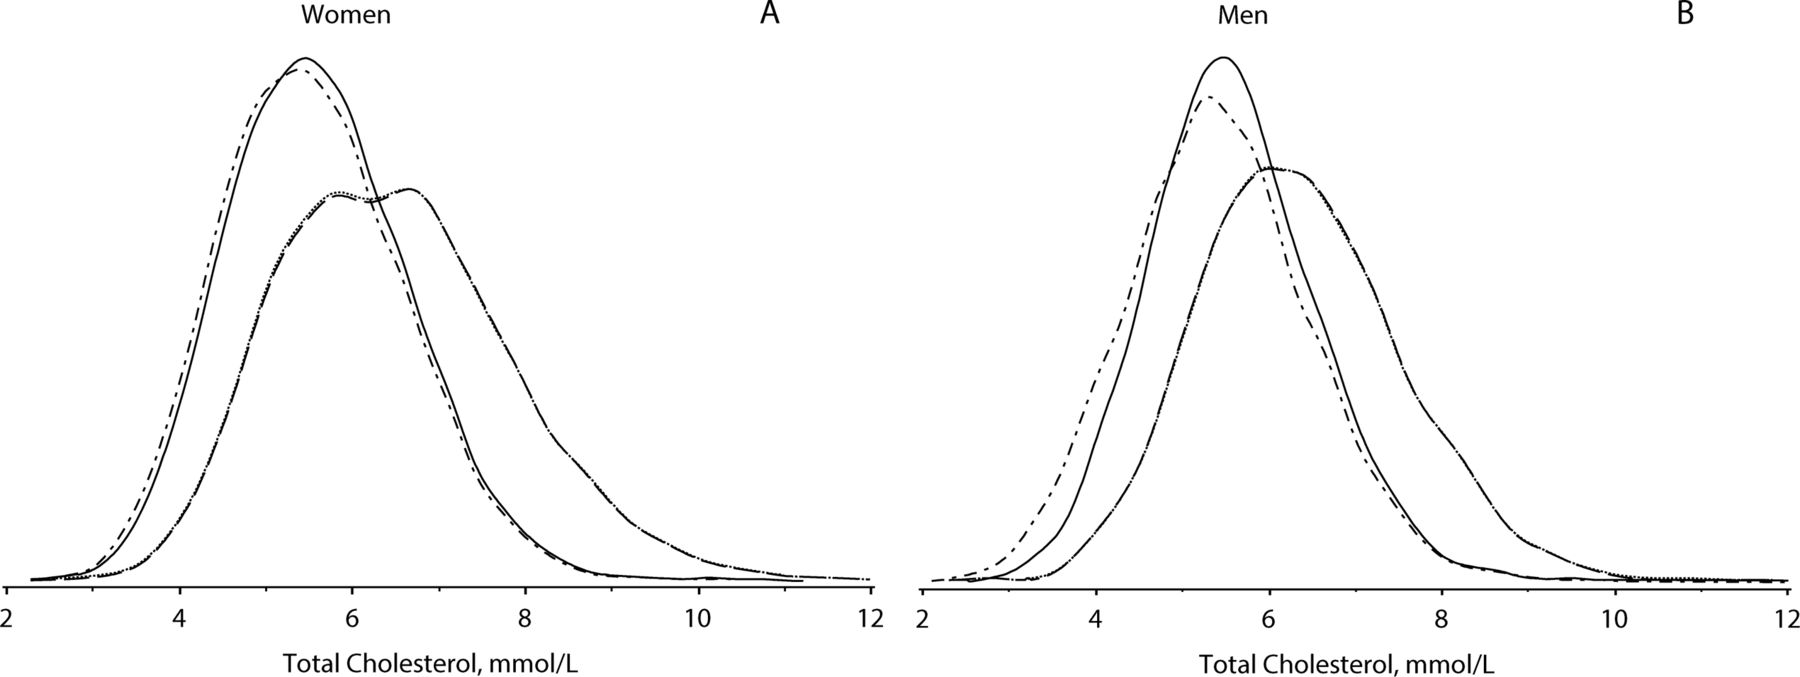
Population cholesterol distribution density curves (mmol/L) for Tromsø 4 1994–1995 overall (dashed lines) and for non-users of lipid-lowering drugs (LLD; dotted lines, embedded in the overall line due to few LLD users) and Tromsø 7 2015–2016 overall (dash-dot lines) and for non-users of LLDs (solid lines), for women and men in age group 40–74 years. The Tromsø Study 1994–2016.
Longitudinal
Linear mixed models were used to estimate longitudinal cholesterol means over time according to sex and birth cohort. The fixed time variable in the models was either survey number (figure 3A,B) or attained age (figure 3C,D), with additional analyses for never-users of LLD (online supplementary material figure 1). Linear mixed models were used to estimate linear trends over surveys restricted to the period 1994–2016 using date of survey as a continuous time variable. In order to estimate different time trends across birth cohorts, we added indicator variables for each 10-year birth cohort and two-way interaction terms between each birth cohort and time. We also modelled birth cohort as an ordinal variable in separate models. Linear mixed models were also used to estimate cholesterol means from 1994 to 2016 in strata according to LLD use. These models included indicator variables of survey number adjusted for birth cohort included as an ordinal variable with cubic polynomials (online supplementary material figure 2). An autoregressive order 1 covariance matrix was specified to control for dependencies between repeated measures using restricted maximum likelihood as the estimation method. The first and the last author had full access to the data and take responsibility for its integrity and the data analysis. Statistical analyses were performed using SAS V.9.4.

Observed longitudinal cholesterol (mmol/L) trends in women and men over surveys (1979–2016) (A and B) or age (20–89 years) (C and D) by 10-year birth cohorts (born 1910–1977) with 95% CIs. The Tromsø Study 1979–2016.
Results
Secular time trends
There was a secular decrease in mean cholesterol over six time points from 1979 to 2016 in both sexes and all age groups (table 1, figure 1). Although a more modest decrease or slight increase was observed between 1986 and 1994, a significant linear decrease was observed in all age groups 30–89 years over the time period. For example, the decrease in mean cholesterol in age group 40–49 years was 1.2 mmol/L in women and 1.0 mmol/L in men. Before the age of 50, women had lower mean cholesterol levels than men. The regression coefficients for those aged ≥30 years are presented in table 1, and 11 out of 12 coefficients were not confounded, but HDL as the regression coefficients changed by ≤8% when HDL was included in the model. Descriptive characteristics by survey is presented in online supplementary material table 1.
The 20th, 50th and 80th centiles of the mean cholesterol distribution decreased between 1979 and 2016 in both sexes and all age groups (online supplementary material tables 2 and 3). The mean cholesterol decrease from 1994 to 2016 was somewhat higher in the 80th centile compared with the 20th centile (table 2), indicating a possible treatment effect of high cholesterol levels. However, the cholesterol kernel density distribution curves (figure 2) indicate a shift to the left in the entire cholesterol distribution from 1994 to 2016 in both genders and all age groups, with a similar pattern for non-users of LLD.
Longitudinal trends
Longitudinal analysis included 43 565 subjects born between 1910 and 1977, by 10-year birth cohorts (figure 3). In most birth cohorts, mean total cholesterol increased with age and time until 1994 or 2001, followed by a decrease until 2016. In the youngest birth cohorts, the peak in total cholesterol was not yet observed by the end of follow-up in 2016. At any given age, total cholesterol was significantly higher in older compared with younger birth cohorts. The different time trends between the birth cohorts have resulted in reduced variation in total cholesterol across birth cohorts from early in the observation period to the latest time points. The majority of the 95% CIs for the estimated marginal means in figure 3 are not overlapping, indicating significant differences between all birth cohorts at any given time point. In a separate set of analyses, we estimated linear trends from 1994 to 2016 in each birth cohort and observed significant decreasing trends for all birth cohorts except for the three youngest cohorts in women and the two youngest cohorts in men. Tests for interaction with time and birth cohort were highly significant (p values<0.0001), both in models where birth cohorts were included as indicator variables and as one ordinal variable, indicating that the decrease in total cholesterol became significantly steeper the older the birth cohort. The difference in time trends across birth cohorts became smaller when adjusted for LLD, but the interaction between time and cohort was still highly significant (p values<0.001 in both women and men). Analyses in a subsample of never-users of LLD showed similar trends as the total sample (online supplementary material figure 1).
The use of LLD treatment
Use of LLD was very rare in 1994 but increased between 1994 and 2016 (table 3), especially in persons older than 50 years. Among women and men younger than 50 years, use of LLD was less than 5% in all surveys. LLD was used more frequently by men than by women. Among those younger than 50 years, the estimated age-adjusted drop in mean cholesterol from 1994 to 2016 was 0.81 mmol/L in women and 0.82 mmol/L in men. Adjusted for LLD use, the decrease was 0.77 mmol/L and 0.72 mmol/L in women and men, respectively. Thus, among those younger than 50 years, the mean cholesterol decrease was not explained by LLD use. Among those aged 50 years and older, the age-adjusted drop in mean cholesterol from 1994 to 2016 was 1.22 mmol/L for women and 1.13 mmol/L for men. Adjusted for LLD use, the decrease was 0.97 mmol/L and 0.82 mmol/L in women and men, respectively. Thus, among those 50 years and older, 21% of the decrease in women and 28% of the decrease in men was explained by treatment with LLD. Average total cholesterol level was lowered by about 2.0 mmol/L among participants on LLD, and this effect was maintained on long-term therapy (online supplementary material figure 2).
Discussion
We found a substantial decrease in mean cholesterol levels in the general population between 1979 and 2016. Favourable trends were observed with age and time in women and men, in all age groups and in the oldest birth cohorts, and in both ends of the cholesterol distribution this shifted the distribution curve or cholesterol to the left. Subjects using LLD had a larger decrease in cholesterol than non-users.
Secular trends
The observed secular decrease in population cholesterol levels is similar to findings from cross-sectional population-based surveys in other Nordic countries9 13 14 and the Czech MONICA and post-MONICA study,15 with Iceland showing the highest decline: 1.5 mmol/L among non-users of LLD aged 25–74 years during 1967–2008.13 Studies from the USA of the same age groups and time period have shown a smaller decline: 0.5 mmol/L in National Health and Nutrition Examination Survey16 and 0.3 mmol/L in the Minnesota Heart Survey.17
Longitudinal trends
Previous population-based studies of longitudinal trends with repeated measurements were scarce and had limitations, studying one sex only,18–20 restricted age groups18 20–25 and/or have a very limited study period.18–27 The lower mean cholesterol levels at any given age observed for younger compared with older birth cohorts can be related to both early life experience and exposures later in life, effects that are difficult to disentangle.28 The increase in cholesterol with age shifting to a decline in older age has previously been reported in several longitudinal studies.18–20 25 27 In general, this can be a result of lifestyle changes, LLD use and survival bias. The unique contribution of age, period and cohort could not be isolated in our analyses. Previous studies have shown that adjustment for loss to follow-up17 27 did not influence the observed cholesterol decease with age. The participation rate in the Tromsø Study has fallen from an initial 79% to 65% in the last survey, a decrease similar to reports from health examination surveys in various European countries.29 However, sensitivity analyses including Tromsø 4 and Tromsø 6 participants showed that age-adjusted mean cholesterol did not differ between those who met to either and to both studies (online supplementary material tables 4 and 5). This suggests that selection bias does not explain our findings.
The impact of lifestyle factors and LLD treatment
Several cholesterol-associated lifestyle factors changed in the Tromsø Study population during the study period 1979–2008. Mean body weight, body mass index and proportion of overweight and obese subjects increased in both genders and in every birth cohort and age group from 1974 to 199530 and further to 200831 in all groups of educational level.32 Occupational physical activity decreased, while the prevalence of moderate and vigorous physical activity in leisure time had a U-shaped trend between 1979 and 2008.33 Smoking prevalence decreased,34 while the frequency of alcohol consumption changed little.34 National trend data from consumer surveys and food supply statistics35 show that the overall composition of fatty acids in the diet has changed favourably from 1975 to 2000, including a steep decrease of transfat from 1990 to 2000 and thereafter stabilisation at the recommended level.35 However, after 2000, the dietary intake of saturated fat has increased somewhat.35
Similar falls in the 80th, 50th and 20th percentile of the cholesterol distribution between 1994 and 2008 point to a population effect influenced by factors shifting the distribution curve to the left, rather than only a treatment effect of individuals with hypercholesterolaemia. However, the 80th centile of the cholesterol distribution had a somewhat larger decrease than the 20th centile. LLD use did not explain the cholesterol decrease among those younger than 50 years, but LLD use had an effect on population cholesterol level among those aged 50 years and older. Patients on drug treatment would also have received lifestyle advice, and therefore observed cholesterol changes among drug users will include the effect of lifestyle changes. In the US, LLD use was estimated to account for almost half of the small decrease in total cholesterol observed during the past two decades.16 This is in contrast with findings from Finland,36 Sweden14 and Iceland13 and the Czech Republic,15 where the effects of LLD use on population cholesterol levels were reported to be small.
Parallel trends in CVD
Analyses using the IMPACT mortality model on national registry data show that approximately 40% of the CHD mortality reduction can be explained by the decrease in total cholesterol in Norway’s neighbouring countries Finland5 and Sweden4 in the 15-year period from 1980 and onwards. A meta-analysis of 61 prospective observational studies mostly from Europe and the USA showed that a cholesterol decrease of 1.0 mmol/L was associated with a half, a third and a sixth lower ischaemic heart disease mortality in both genders at the ages of 40–49, 50–69 and 70–89 years, respectively.37 In the Tromsø population, there has been a decline in CVD incidence38 39 in parallel with favourable trends in risk factor levels3 40 during the last three decades. Reduction in population cholesterol levels accounted for 32% of the decline in incidence of fatal and non-fatal CHD.3
Strengths and weaknesses
The main strength of this study is the use of repeated measurements of total cholesterol and LLD use in the same individuals in a population-based sample, over a time period of four decades. The study sample size and recruitment from a general population increase generalisability of the results. However, not all birth cohorts could be followed from young adulthood to older age, which can be observed in the figures of longitudinal trends. This can be explained by different sampling procedures between the surveys; not all former participants were reinvited to the following surveys. Only 59% of the study sample contributed with more than one measurement. Furthermore, another weakness is that data on potential mediators of cholesterol changes, such as weight and diet, were not included in the analyses. Ideally, the analysis should include all potential mediators, to investigate their impact on the trends.
Conclusion
We found a substantial decrease in mean total cholesterol levels in the general population between 1979 and 2016 in both sexes and all age groups. In birth cohorts, total cholesterol decreased after a peak around middle age, except for the youngest birth cohorts where a peak was not yet observed by the end of follow-up. The total cholesterol distribution was shifted to the left in both ends of the curve. Subjects using LLD had a larger decrease in total cholesterol than non-users, but LLD use could only partly explain the population total cholesterol changes.
References
Footnotes
Contributors TW and LAH performed the analyses. LAH, KHB, AEE, SG, BKJ, MLL, EBM, IN and TW took part in the interpretation of data and writing of the manuscript. All authors have read and approved the submitted version of the manuscript.
Funding This work was supported by the Norwegian Health Association’s board in Troms County to LAH.
Competing interests None declared.
Patient consent Obtained.
Ethics approval The Regional Committee of Medical and Health Research Ethics and the Norwegian Data Protection Authority.
Provenance and peer review Not commissioned; externally peer reviewed.
Data sharing statement No additional data are available.