Article Text

Abstract
Objectives To evaluate potential return on investment of the National Health Service Diabetes Prevention Programme (NHS DPP) in England and estimate which population subgroups are likely to benefit most in terms of cost-effectiveness, cost-savings and health benefits.
Design Economic analysis using the School for Public Health Research Diabetes Prevention Model.
Setting England 2015–2016.
Population Adults aged ≥16 with high risk of type 2 diabetes (HbA1c 6%–6.4%). Population subgroups defined by age, sex, ethnicity, socioeconomic deprivation, baseline body mass index, baseline HbA1c and working status.
Interventions The proposed NHS DPP: an intensive lifestyle intervention focusing on dietary advice, physical activity and weight loss. Comparator: no diabetes prevention intervention.
Main outcome measures Incremental costs, savings and return on investment, quality-adjusted life-years (QALYs), diabetes cases, cardiovascular cases and net monetary benefit from an NHS perspective.
Results Intervention costs will be recouped through NHS savings within 12 years, with net NHS saving of £1.28 over 20 years for each £1 invested. Per 100 000 DPP interventions given, 3552 QALYs are gained. The DPP is most cost-effective and cost-saving in obese individuals, those with baseline HbA1c 6.2%–6.4% and those aged 40–74. QALY gains are lower in minority ethnic and low socioeconomic status subgroups. Probabilistic sensitivity analysis suggests that there is 97% probability that the DPP will be cost-effective within 20 years. NHS savings are highly sensitive to intervention cost, effectiveness and duration of effect.
Conclusions The DPP is likely to be cost-effective and cost-saving under current assumptions. Prioritising obese individuals could create the most value for money and obtain the greatest health benefits per individual targeted. Low socioeconomic status or ethnic minority groups may gain fewer QALYs per intervention, so targeting strategies should ensure the DPP does not contribute to widening health inequalities. Further evidence is needed around the differential responsiveness of population subgroups to the DPP.
- public health
- diabetes and endocrinology
- health economics
This is an Open Access article distributed in accordance with the Creative Commons Attribution Non Commercial (CC BY-NC 4.0) license, which permits others to distribute, remix, adapt, build upon this work non-commercially, and license their derivative works on different terms, provided the original work is properly cited and the use is non-commercial. See: http://creativecommons.org/licenses/by-nc/4.0/
Statistics from Altmetric.com
Strengths and limitations of this study
The study uses the School for Public Health Research (SPHR) Diabetes Prevention Model, which synthesises a broad range of evidence from published data about type 2 diabetes risk factors and the complex disease progression pathways that lead from a diabetes diagnosis.
The individual patient-level model structure allows the heterogeneity present within the population to be modelled, enabling detailed subgroup analysis.
The National Health Service (NHS) Diabetes Prevention Programme (DPP) has recently begun national implementation and direct data collection on its effectiveness in practice in England has not yet been obtained; therefore, the analysis assumes that effectiveness will be similar to that obtained in pragmatic trials of intensive lifestyle interventions aimed at preventing type 2 diabetes, while also undertaking sensitivity analysis around this assumption.
The analysis uses a comparator of ‘no NHS DPP intervention’, which does not fully represent the current situation where some localities do have programmes for high-risk individuals. These were not modelled due to limited evidence and heterogeneity of intervention implementation between localities.
Data about the long-term effectiveness of lifestyle interventions and the differential response of population subgroups to such interventions are limited. Further research is required to inform these parameters.
Introduction
Type 2 diabetes is a major public health priority in the UK. Currently there are >2.9 million people with diabetes in England1 and estimated to be a further 5 million at high risk of developing the disease.2 Diabetes is estimated to directly cost the National Health Service (NHS) in England about £5.6 billion per year,3 of which most contributes to treating complications of the disease such as amputation, blindness, kidney failure and cardiovascular disease (CVD). To help tackle this problem, Public Health England (PHE), NHS England and Diabetes UK are together implementing the NHS Diabetes Prevention Programme (DPP).4 The NHS DPP consists of intensive lifestyle management programmes aimed at those at high risk of diabetes due to impaired glucose regulation (IGR), defined as HbA1c 6%–6.4% (42–47 mmol/mol) or fasting plasma glucose of 5.5–6.9 mmol/L. It is expected that IGR individuals will be identified through a mixture of NHS Health Checks and opportunistic or targeted screening processes, and that 100 000 individuals will be referred to the DPP each year once the programme is running.
Previous economic evaluations indicate that lifestyle interventions such as that planned for the NHS DPP can be cost-effective.5–8 However, there is evidence that diabetes prevention interventions may be differentially effective in different population subgroups,9–13 thereby potentially leading to differential cost-effectiveness. Given the limited number of available interventions, analysis of potential disparities in cost-effectiveness of the DPP between different subgroups is important not only to maximise potential health benefits and cost-savings, but also to ensure that health benefits are distributed in the population in a fair and equitable manner, which is an important consideration for public health interventions.
This study aims to (1) model the potential cost-effectiveness of the proposed NHS DPP in the English population using an adaptation of the National Institute for Health Research (NIHR) School for Public Health Research (SPHR) Diabetes Prevention Model7 14 and (2) investigate in which subgroups, defined by age, gender, ethnicity, socioeconomic deprivation, baseline body mass index (BMI), baseline HbA1c and working status the DPP is likely to have the most benefit in terms of cost-effectiveness, cost-savings and health benefits.
Methods
Model structure
The SPHR Diabetes Prevention Model was developed to forecast long-term health and healthcare costs under alternative scenarios for diabetes prevention. A detailed description of the methodology and assumptions used in the model can be found in the online supplementary appendix 1.
Supplementary file 1
The model is an individual patient simulation model based on the evolution of personalised trajectories for metabolic factors including BMI, systolic blood pressure (SBP), cholesterol and measures of blood glucose (including HbA1c).15 The baseline population consists of a representative sample of the English population obtained from the Health Survey for England (HSE).16 HSE 2011 was chosen to inform the baseline population in the model due to its focus on diabetes and CVD, meaning it incorporates information about relevant metabolic factors. Individuals aged <16 years were excluded from the analysis.
The model runs in annual cycles (see schematic in the supplementary material). For each person, their BMI, cholesterol, SBP and HbA1c progress from year to year. Every year in the model, an individual may visit their general practitioner (GP) or undergo a health check, and be diagnosed with and treated for hypertension, high cardiovascular risk, diabetes, microvascular complications of diabetes, CVD, congestive heart failure, osteoarthritis, depression and breast or colon cancer, or may die. Utility of each individual in each year of the model is dependent on their age, gender and medical conditions. Each condition is associated with a utility (health-related quality of life) decrement and a healthcare cost. Details of how all utilities and costs were modelled can be found in the online supplementary appendix. Total costs and quality-adjusted life-years (QALYs) are aggregated over all individuals in the model. Costs are at 2014 values in English pounds. The model perspective is that of the NHS in England.
Intervention
The NHS DPP is an intensive lifestyle intervention focusing on dietary advice, physical activity and weight loss, aimed at individuals in England at high risk of diabetes. The model begins at the point where individuals eligible for the DPP (HbA1c 6%–6.4%/42–47 mmol/mol; aged ≥16 years) have been identified and does not incorporate any local costs or utility change associated with identification or referral (see online supplementary material details for baseline characteristics for the 1492 high-risk individuals in the HSE 2011).
An intervention uptake rate of 32% was assumed in consultation with PHE. It was assumed that those who did not take up the intervention incurred no extra costs or benefits. Effectiveness evidence came from a recent PHE commissioned evidence review and meta-analysis of pragmatic diabetes prevention interventions, carried out specifically to inform the likely effectiveness of the NHS DPP.9 PHE, NHS England and Diabetes UK have specified that in order to maximise intervention effectiveness, they wish the commissioned DPP to fulfil at least 9–12 guidelines as recommended in the National Institute for Health and Care Excellence (NICE) guidance for diabetes prevention (PH38).17 NICE guidelines include using particular strategies associated with increased effectiveness, specifying the minimum amount of contact time and follow-up sessions, and delivering the programme through qualified practitioners. In line with this, a mean weight loss of 3.24 kg was assumed, taken from the meta-analysis of interventions fulfilling 9–12 NICE guidelines.9 Data about concomitant reduction in SBP, total cholesterol and HbA1c were not available from the PHE evidence review and so were linearly extrapolated from an earlier review and meta-analysis18 (see supplementary table S2 and supplementary material for details). Current evidence indicates that while there may potentially be a small number of adverse musculoskeletal events associated with intensive lifestyle intervention compared with control, these are not significant so were not incorporated into the analysis.11
There is some evidence to indicate that effectiveness of lifestyle interventions to prevent type 2 diabetes differs between population subgroups, although study quality varies.9–13 Stratification of intervention effectiveness by baseline BMI was implemented into the model, again using data from the PHE meta-analysis.9 There was insufficient evidence around differential effectiveness for other subgroups to incorporate into the model. In practice, some individuals who start the intervention will not complete it. Most of the studies used to derive the estimate of effectiveness in the PHE meta-analysis used intention-to-treat analysis, but two have not (personal communication from N. Ashra). It is likely therefore that the effectiveness estimate used in the model only partially accounts for non-completion and therefore may be higher than is realistic in practice. Sensitivity analysis was carried out to account for this possibility. A linear rate of weight regain (plus reduction in the intervention effects on HbA1c, SBP and cholesterol) was assumed over the first five years in line with the assumptions used to produce the NICE guidelines for diabetes prevention (PH38).19 This meant that individuals’ metabolic trajectories returned to where they would have been without intervention, within 5 years of intervention implementation.
The cost of the NHS DPP was determined through the DPP procurement process in 2016. As this was still undergoing at the time of this analysis, the average cost from the NHS England impact assessment of £270 per participant was used.20 This is the price that the NHS is willing to pay per person starting the intervention and incorporates expected retention rates of participants. Due to the NHS perspective taken, potential out-of-pocket costs for intervention attendees were not included. In the control simulation, it was assumed that IGR individuals would not receive any intervention and would therefore not incur any extra costs or changes to their metabolic trajectories.
Subgroups
Population subgroups were selected for analysis due to the potential influence of different characteristics on diabetes risk and for equity implications. The following subgroups were chosen:
four age groups (ages 16–40 years; 40–59 years; 60–74 years; ≥75 years)
two gender groups (male; female)
two ethnicity groups (white; black minority ethnic (BME))
five deprivation groups (index of multiple deprivation (IMD) quintiles 1–5)
three working status groups (working; retired; other)
four BMI groups (BMI<25 kg/m2; 25–29.9 kg/m2; 30–34.9 kg/m2; ≥35 kg/m2)
two HbA1c groups (HbA1c 6%–6.19%; 6.2%–6.49%).
The analysis models a single year of NHS DPP intervention and all the downstream cost-savings and health benefits (including life-years, QALYs and reduction in diabetes and CVD cases) that this produces over the subsequent 20 years. In total, 1000 model runs were performed for each of the 1492 HSE 2011 individuals in the deterministic analysis and model outcomes for each subgroup extracted from the total results. All costs were discounted by 3.5% and QALYs by 1.5%, as per Department of Health guidelines.21
Sensitivity analysis
Four deterministic one-way sensitivity analyses were performed to investigate the sensitivity of the results to a more conservative set of intervention parameters. The assumptions around intervention specification for each of these scenarios are shown in supplementary table S2.
uniform intervention effectiveness (no stratification by BMI)
25% lower mean effectiveness
three-year duration of intervention effect (instead of 5 years)
higher intervention cost of £350 (instead of £270).
A fifth sensitivity analysis was also carried out in which a series of combinatorial subgroups were modelled, defined by both BMI and age, or BMI and HbA1c, in order to observe the interaction between characteristics.
Probabilistic sensitivity analysis (PSA) was carried out to describe the uncertainty in parameter inputs of the model and how this translates into uncertainty in the outcomes of the model. A suitable distribution was selected for each parameter, based on its mean and SE. Random sampling simultaneously across all input parameter distributions allowed parameter uncertainty to be quantified. In total, 5000 different random samples of parameter values were selected, and each was applied to the 1492 individuals in the simulation. A list of model parameters, their distribution for PSA and their source is provided in online supplementary tables 42-60.
Results
Population results
Model results suggest that a year of DPP implementation in the English IGR population is likely to reduce healthcare costs from the first year of implementation, recoup intervention costs within 12 years (by the end of 2027/2028) and be cost-effective compared with no DPP intervention (at a willingness-to-pay threshold of £20 000 per QALY gained) within 6 years (by the end of 2021/2022) (figure 1). For every 100 000 interventions given, the DPP is expected to prevent or delay 4147 cases of diabetes and 413 cases of CVD (table 1).

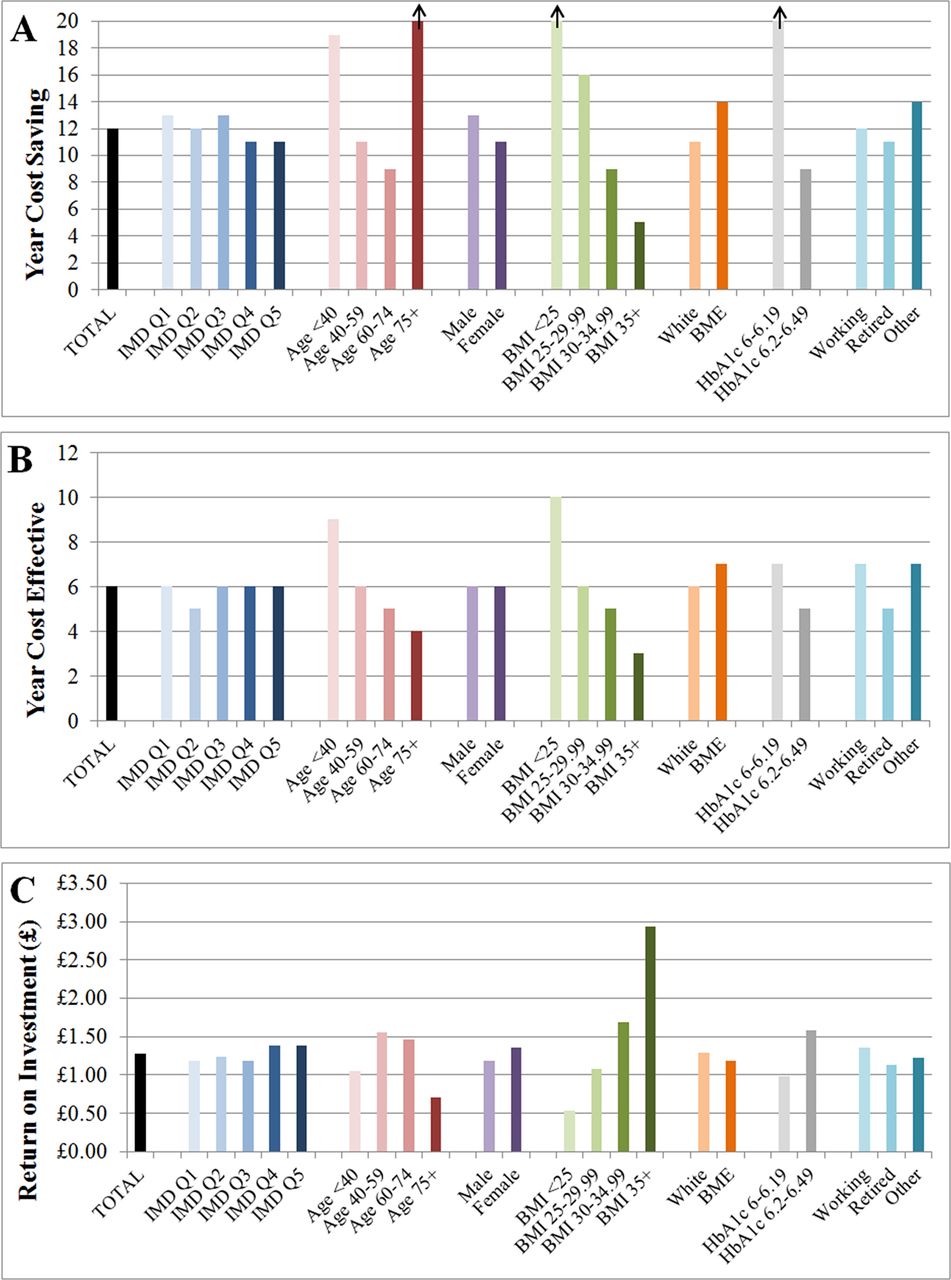
Bar charts showing (A) the year that the National Health Service Diabetes Prevention Programme (NHS DPP) becomes cost-saving (recoups intervention costs); (B) the year that the NHS DPP becomes cost-effective; (C) the total NHS return on investment within 20 years per £1 spent on the NHS DPP for each of the population subgroups. Vertical arrows indicate that the DPP is not cost-saving within the 20-year period modelled. BME, black minority ethnic; BMI, body mass index; IMD, index of multiple deprivation.
Mean cumulative incremental outcomes per person given the intervention in England
The subdivision of NHS costs/savings by disease area is shown in table 1. This indicates that most cost-savings arise due to reductions in the cost of treating diabetes or CVD, with high savings also accrued through a reduction in other primary care costs including GP visits and prescription of statins and antihypertensives. The timing of cost-savings varies depending on disease area, with cost-savings in CVD care, diagnostics and other primary care accumulating in the short term, while cost-savings in diabetes treatment, microvascular disease and other complications accumulate more slowly. This indicates that 1 year of the DPP implemented now is likely to continue saving money in the NHS for many years in the future despite a fairly transient (diminishing over 5 years) effect on metabolic risk factors due to knock-on delays in progression to more complex diabetes (requiring insulin) and to expensive microvascular complications of diabetes.
Return on investment is calculated by dividing total savings or monetised benefit (excluding intervention costs) by the cost of the intervention to work out the gain obtained for each £1 invested in the DPP. The model estimates that at 20 years following intervention implementation, for every £1 invested in the DPP, £1.28 of NHS savings and £9.21 worth of total net monetary benefit (calculated using £60 000 as the value of a QALY) will be produced (figure 1 and table 1).
Subgroup results
Across the subgroup dimensions examined, the biggest differentials in cost-effectiveness are seen in the subgroups defined by baseline BMI (figure 1). The NHS DPP is estimated to be most cost-effective in individuals with BMI ≥35 kg/m2 (12% of the eligible population). For this subgroup, NHS savings outweigh initial investment within 5 years and rise to a net value of £520 per person within 20 years (figure 2). QALYs gained over 20 years are also highest (6377 per 100 000 individuals), and there are the largest reductions in diabetes and CVD cases (maximum reduction of diabetes cases=5484 at year 6, and maximum reduction of CVD cases=846 at year 7; see supplementary figure S2). The 20-year return on investment is estimated to be £2.93 per £1 spent on intervention (figure 1) and over £17 per £1 spent if monetised health benefits are included at £60 000 per QALY. The second most cost-saving group is those who have BMI 30–34 kg/m2. In contrast, the non-obese subgroups have substantially worse estimated return on investment, with the BMI <25 kg/m2 subgroup not recouping intervention costs within the 20-year modelled period.

Graphs showing cumulative incremental (net) costs per person given the intervention over a 20-year time horizon for each subgroup and for the total population. Annual incremental costs per person are shown as a dotted line on the total population graph. Costs are discounted at 3.5%. BMI, body mass index; DPP, diabetes prevention programme.
Across the other dimensions for defining subgroups, IMD deprivation quintile makes a relatively small difference to return on investment. Age makes a much larger difference with the middle-age groups (40–59 and 60–74 years) showing better return on investment than the younger (<40 years) and older (≥75 years) groups. Estimated return on investment is marginally better for females than males, marginally different between working, retired and other, and marginally better for a white versus BME subgroup. The other large subgroup difference is between those above or below 6.2% HbA1c at baseline, with the higher HbA1c subgroup showing a larger return on investment than the lower HbA1c subgroup.
There are three subgroups to which net mean cost-savings do not accrue within the 20 years following intervention implementation. These include the oldest age group (≥75 years), individuals who are normal weight or underweight (BMI <25) and individuals with HbA1c 6–6.19. Note that subgroup characteristics are not mutually exclusive, so although on average the intervention is not cost-saving in people of normal weight, it may be cost-saving in certain individuals with other characteristics which correlate with cost-savings, such as high HbA1c.
In general, subgroups that obtain the highest cost-savings also obtain the highest QALY gains and are the most cost-effective as cost-savings relate to preventing disease progression. However, the DPP also reduces mortality of older individuals, resulting in higher QALYs than might otherwise be expected in subgroups containing higher numbers of older people. Equally subgroups containing younger individuals (including the BME group and the most socioeconomically deprived group) gain fewer incremental QALYs and life-years; their disease and mortality risk is reduced due to their lower age so the NHS DPP is less effective, suggesting that the health benefits of the DPP may not be equitably distributed (see online supplementary figures 2 and 3).
In all subgroups, numbers of incremental diabetes/CVD cases drop in the short term while the intervention effect is operating and then rise again at the point when weight has been fully regained. This indicates that most cases of diabetes/CVD are likely to be delayed rather than prevented entirely based on current assumptions about long-term effectiveness of the interventions.
Sensitivity analyses
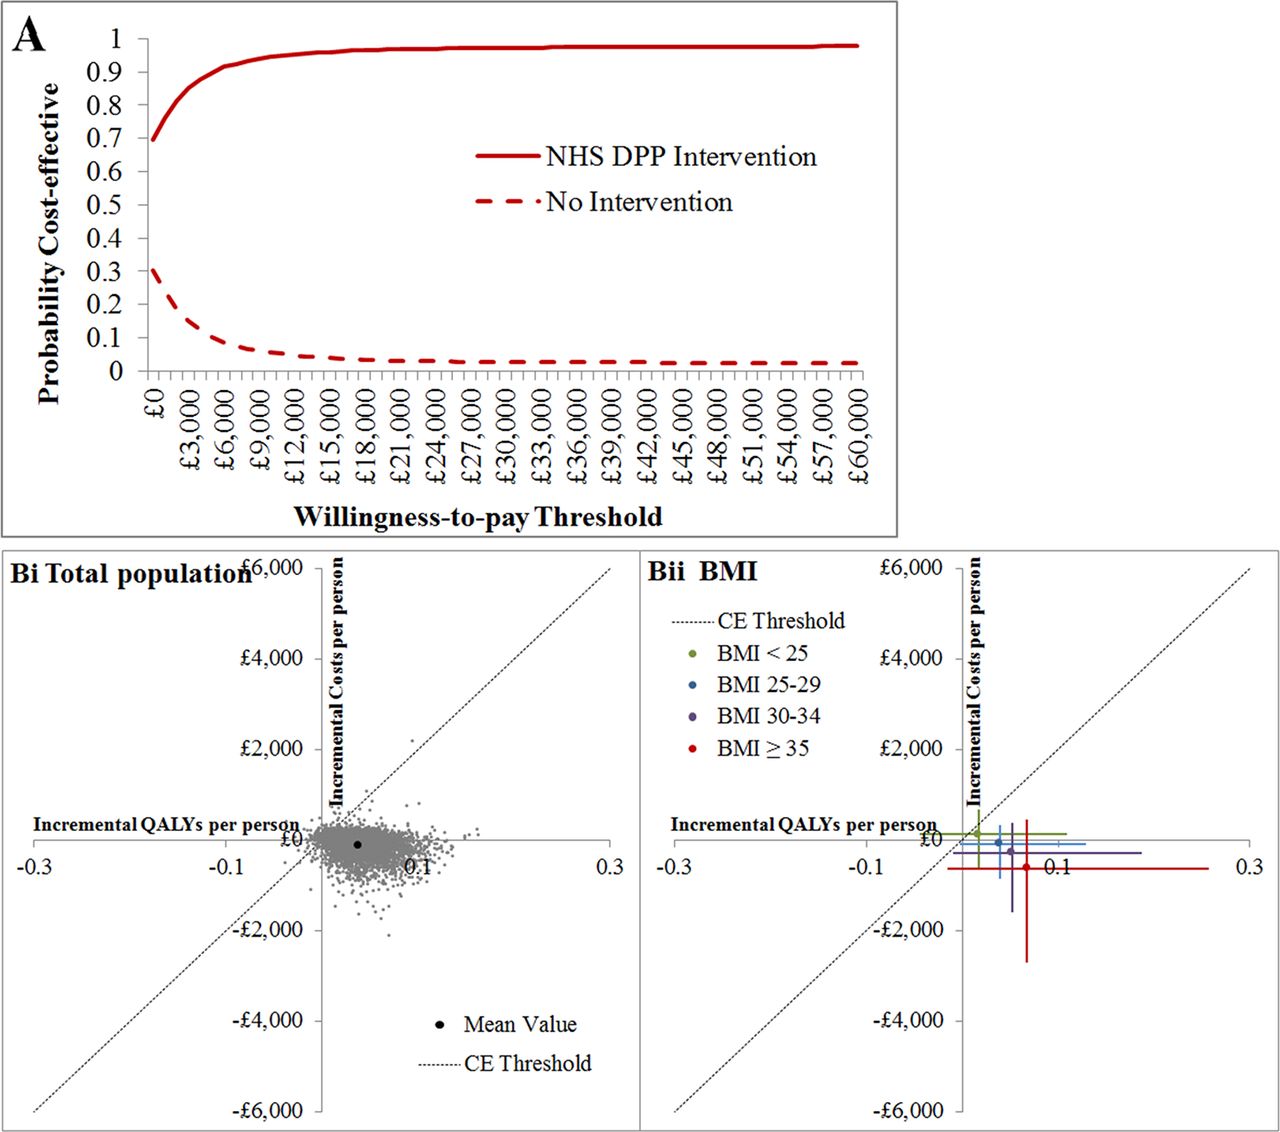
The PSA estimation of mean incremental total cost-savings per person is £131 and of mean incremental QALYs is 0.0388 at 20 years following intervention implementation in England (see online supplementary table 3). This is higher for both cost-savings and QALY gains than found during deterministic analysis; the difference is due to non-linearity in the model, which is likely to be particularly important around the BMI stratified estimation of intervention effect. The probability that the NHS DPP will be cost-effective in 20 years compared with no DPP intervention, at a willingness-to-pay threshold of £20 000 per QALY is 97% (see figure 3), and the probability that the DPP will be cost-saving for the NHS 20 years after intervention implementation is 70%. As in the deterministic analysis, BMI is the most important criteria for determining cost-effectiveness, with the two highest BMI subgroups being more cost-saving and cost-effective than other population subgroups (see online supplementary table S3and figure 3).

Probabilistic sensitivity analysis (PSA) results. (A) Cost-effectiveness acceptability curve showing the probability that the Diabetes Prevention Programme (DPP) or no intervention will be cost-effective over a range of different willingness-to-pay thresholds. (B) Distribution of PSA results for (i) the total population and (ii) body mass index (BMI) subgroups on the cost-effectiveness plane. Error bars represent 95% CIs for incremental total costs and incremental quality-adjusted life-years (QALYs). The cost-effectiveness (CE) threshold is £20 000/QALY. Note that the size of the 95% CIs and therefore the probability that the intervention will be cost-effective or cost-saving is partially related to the size of each subgroup within the total impaired glucose regulation population of England, in addition to being related to the distribution of results on the cost-effectiveness plane.
One-way sensitivity analysis indicates that under conservative scenarios of higher intervention cost (£350 instead of £270), 25% lower intervention effectiveness or lower duration of intervention effect (3-year decline instead of 5-year), the NHS DPP would take longer than 20 years to recoup initial intervention costs in the majority of subgroups (see online supplementary table S4). The intervention is still likely to be cost-effective (at a threshold of £20 000 per QALY) within a 10-year time horizon in all but the least cost-effective subgroups. Of these scenarios, reducing duration of intervention effect has the most significant impact on outcomes, with only the BMI≥35 subgroup remaining cost-saving. However, in all three scenarios, the relative cost-effectiveness of subgroups remains unchanged compared with the base case analysis.
If intervention effect is no longer stratified by BMI, the difference between subgroups of a particular population characteristic is reduced compared with the base case scenario. While for some subgroups, such as those defined by BMI, a clear gradient is still apparent, for other groups such as those defined by IMD quintile or ethnicity the difference in outcomes is minimal, suggesting that stratification of intervention effectiveness by BMI is a key driver of differential cost-effectiveness in those groups in the base case analysis.
Combinatorial analysis indicates that the high return on investment in the BMI 35+ subgroup is mitigated in individuals who are also aged 75+ and reduced to only £1.54 per £1 spent, whereas in individuals aged 40–59 years it is improved even further to £3.20 (figure 4). An even higher return on investment of £3.52 could potentially be obtained if individuals who have both BMI 35+ and HbA1c 6.2%–6.4% are selected for the NHS DPP intervention. This suggests that subgroups with high benefits can be combined to potentially increase the return on investment even further.

Graphs showing the interaction between body mass index (BMI) and (A) age, (B) HbA1c. Return on investment in combinatorial subgroups defined using two personal characteristics.
Discussion
It is essential with large-scale and expensive national programmes such as the NHS DPP that a cost-effectiveness analysis using the best currently available data is carried out prior to implementation: first, to determine whether the intervention should be carried out at all; second, to enable effective budgeting; and third, where interventions are limited, to estimate who is likely to benefit most and therefore should be prioritised. This analysis suggests that the NHS DPP is highly likely to be cost-effective and cost-saving over the medium to long term using current assumptions around intervention cost, effectiveness and duration of effect, and should start to save costs for the NHS from the first year of implementation, recouping the initial investment in the intervention by year 12. The number of potential individuals at high risk of type 2 diabetes in England (estimated to be about 5 million2) far exceeds the 100 000 interventions that NHS England plans to offer each year.3 This analysis indicates that prioritising obese individuals in particular (BMI ≥30 kg/m2), combined with those with the highest baseline HbA1c and focusing on those aged between 40 and 74 years (the ages covered in any case by the NHS Health Check), is likely to create the most value for money in the programme by obtaining both the greatest cost-savings for the NHS and the highest health benefits per individual targeted.
This study does suggest that care may have to be taken when implementing the NHS DPP to ensure that it does not lead to greater health inequalities in some groups at high risk of type 2 diabetes and its complications, including individuals from minority ethnic or socioeconomically deprived backgrounds. The analysis shows a tendency for the NHS DPP to provide fewer QALYs to these subgroups than to individuals from more socioeconomically advantaged or white ethnic backgrounds. Given that the model does not incorporate (nor is there any clear evidence for) differential effectiveness of the NHS DPP by socioeconomic status or ethnicity, these differences are likely to occur for two main reasons. First, disease risk is influenced by subgroup; for example, both ethnicity and socioeconomic status are parameters in the QRISK equations that are used in the model to determine CVD risk.22 This means that even if a given individual reduces their metabolic risk factors through the DPP they may still be at high risk of disease due to environmental or genetic factors outside the scope of the intervention. Second, subgroups differ in key personal characteristics associated with intervention efficacy; for example, mean age is lower than average in the BME subgroup and in the most socioeconomically deprived quintile. Low mean age results in lower health benefits and return on investment from the NHS DPP than high age due to the lower absolute risks of disease and mortality in such individuals and therefore lower ability to benefit. Given that BME and low socioeconomic status subgroups also tend to suffer from low uptake of lifestyle interventions,23 24 it is important that NHS DPP providers make particular efforts to engage individuals from these groups if exacerbation of health inequalities is to be avoided.
A major strength of this analysis is the synthesis of a broad range of evidence using the SPHR Diabetes Prevention Model.7 14 This is an individual patient simulation model that incorporates a large amount of evidence from published data about type 2 diabetes risk factors and the complex disease progression pathways that lead from a diabetes diagnosis and is able to represent the heterogeneity present within the English population and thereby model population subgroups. However, the model only takes healthcare costs into account, meaning that wider societal costs and benefits cannot be calculated, and even within healthcare does not incorporate diseases such as dementia that may impact on long-term healthcare costs. A more important limitation is that the comparator of ‘no NHS DPP intervention’ used for this analysis does not fully represent the current situation where some localities do have programmes for high-risk individuals. These were not modelled due to limited evidence and heterogeneity of intervention implementation between localities. Subgroup analysis has also been limited by the relatively small number of IGR individuals in the HSE data, meaning that smaller subgroups (such as individual minority ethnic groups) or a larger variety of subgroup combinations, both of which would provide useful information for those implementing the NHS DPP, cannot be accurately modelled.
While this study is not based on actual clinical data from the NHS DPP, because such data does not yet exist as the national programme implementation is just beginning, it does use the most recently published estimates of intervention effectiveness from a PHE evidence review designed specifically to inform the development of the NHS DPP,9 and therefore is likely to provide a more accurate estimate of NHS DPP cost-effectiveness than previous economic analyses of diabetes prevention interventions. However, data about the long-term effectiveness of lifestyle interventions and the differential response of population subgroups to such interventions is limited and represents the most important limitation of this study. Deterministic sensitivity analysis indicates that the cost-effectiveness of the NHS DPP is substantially influenced by parameters such as intervention effectiveness and duration of intervention effect, which could also impact on the ordering of subgroups. Future research should therefore focus primarily on improving estimates of subgroup effectiveness, and gathering evidence about initial weight loss and weight regain rates due to the NHS DPP, which could be added to the model. The biggest challenges in performing good quality subgroup analysis are sufficiently powering the clinical studies to account for subgroups that may only comprise a small proportion of the population, and taking into account potential interaction between personal characteristics that could lead to confounding across subgroups in intervention uptake rates or effectiveness. The NIHR is commissioning a formal evaluation of the NHS DPP which will include cost-effectiveness analysis. Careful statistical design of this analysis and long-term follow-up of participants should enable these challenges to be overcome successfully and provide high-quality data for updating and improving the accuracy of model predictions.
Acknowledgments
The authors would like to thank the PHE steering group and stakeholders from the DPP demonstrator sites for advice about model parameters relating to the DPP intervention and useful outputs. Many thanks also to Maxine Johnson, Kelly Mackenzie, Tom Sanders and Elizabeth Goyder for their involvement in stakeholder workshops and advice about other aspects of the project. We are also extremely grateful to Pete Dodd and Mat Hall for their excellent quality assurance work with the SPHR Diabetes Prevention Model. Finally, this work could not have been carried out without the SPHR Diabetes Prevention Model, which was funded by the National Institute for Health Research’s School for Public Health Research.
References
Footnotes
Contributors CT contributed to planning the project, carried out the model adaptation and wrote the manuscript. She is guarantor. SS contributed to planning the project, adapting the model and writing the manuscript. PB developed the model and revised the draft paper. HS contributed to the conceptual development of the model adaptation and revised the draft paper. MG provided specialist knowledge around model inputs and revised the draft paper. AB was principle investigator for the project and contributed to the analysis and manuscript.
Funding This abstract presents independent research commissioned and funded by Public Health England (PHE) with support from NHS England, Diabetes UK and the Department of Health. Model development was funded by the National Institute for Health Research (NIHR)’s School for Public Health Research (SPHR). The views expressed are those of the authors and not necessarily those of PHE, NHS England, Diabetes UK, the NIHR or the Department of Health.
Competing interests The authors have no financial relationships with any organisations that might have an interest in the submitted work in the previous three years other than Public Health England and NHS England and no other relationships or activities that could appear to have influenced the submitted work.
Ethics approval Ethical approval was not needed for this study because the model is based on publicly available data and analysis of secondary data.
Provenance and peer review Not commissioned; externally peer reviewed.
Data sharing statement Detailed results for each subgroup analysed in the model are available on request by email from the corresponding author.