Article Text

Abstract
Objective To examine the relationship between glycated haemoglobin A1c (HbA1c) levels and the risk of cardiovascular outcomes and all-cause mortality based on data from observational studies and to determine the optimal levels of HbA1c for preventing cardiovascular events and/or mortality in diabetic and non-diabetic populations.
Review methods We systematically searched Medline, Embase, the Cochrane Central Register of Controlled Trials, the Cochrane Database of Systematic Reviews and Web of Science databases, from inception to July 2016, for observational studies addressing the association of HbA1c levels with mortality and cardiovascular outcomes. Random effects models were used to compute pooled estimates of HR and respective 95% CI for all-cause mortality, cardiovascular mortality and risk of cardiovascular events, separately for people with and without diabetes.
Results Seventy-four published studies were included in the systematic review, but only 46 studies could be incorporated in the meta-analysis. In both diabetic and non-diabetic populations, there was an increase in the risk of all-cause mortality when HbA1c levels were over 8.0% and 6.0%, respectively. The highest all-cause mortality in people with diabetes was HbA1c above 9.0% (HR=1.69; 95% CI 1.09 to 2.66) and in those without diabetes was HbA1c above 6.0% (HR=1.74; 95% CI 1.38 to 2.20). However, both diabetic and non-diabetic populations with lower HbA1c levels (below 6.0% HR=1.57; 95% CI 1.14 to 2.17 and below 5.0% HR=1.19; 95% CI 1.04 to 1.36, respectively) had higher all-cause mortality. Similar pooled estimates were found when cardiovascular mortality was the outcome variable.
Conclusion HbA1c is a reliable risk factor of all-cause and cardiovascular mortality in both diabetics and non-diabetics. Our findings establish optimal HbA1c levels, for the lowest all-cause and cardiovascular mortality, ranging from 6.0% to 8.0% in people with diabetes and from 5.0% to 6.0% in those without diabetes.
- HbA1c
- All-cause mortality
- Cardiovascular mortality
- Meta-analysis
This is an Open Access article distributed in accordance with the Creative Commons Attribution Non Commercial (CC BY-NC 4.0) license, which permits others to distribute, remix, adapt, build upon this work non-commercially, and license their derivative works on different terms, provided the original work is properly cited and the use is non-commercial. See: http://creativecommons.org/licenses/by-nc/4.0/
Statistics from Altmetric.com
Strengths and limitations of this study
Previous meta-analyses have reported pooled estimates of the increase in mortality risk by each 1% increase in glycated haemoglobin A1c (HbA1c); thus, their estimates are based on the assumption of a linear relationship between these variables, which data from the studies included in this review did not show.
This study provides pooled estimates of changes in mortality risk by HbA1c level categories, and therefore, did not presuppose any functional statistical relationship between the involved variables.
Our findings establish that, to diminish cardiovascular and all-cause mortality, optimal HbA1c levels range from 5.0% to 6.0% in people without diabetes and from 6.0% to 8.0% in people with diabetes.
Publication bias cannot be disregarded because, although 74 studies met the inclusion criteria, only 46 were considered for our pooled estimates, since the other 28 reported their results using HbA1c levels not comparable to those of the studies included in the meta-analysis.
To assess the magnitude of publication bias, we calculated the number of unpublished or unrecovered null studies that would have been published to make the effect not statistically significant using the Rosenthal fail-safe N method.
Introduction
Cardiovascular diseases (CVD) are the first cause of mortality in the world, representing 31% of all global deaths. In 2012, 17.5 million people died by CVD according to WHO.1 Prevention of CVD through the control of risk factors is a priority in most developed countries.2
Glycated haemoglobin A1c (HbA1c) level is an indicator of the average blood glucose concentrations over the preceding 2 to 3 months that is recommended by the American Diabetes Association (ADA)3 and the WHO4 for the diagnosis of diabetes. This indicator has exhibited more accuracy for the diagnosis of diabetes retinopathy than fasting plasma glucose (FPG),5 an early diabetes-related complication that is considered a good criterion for comparing the diagnostic accuracy of diabetes biomarkers.6 HbA1c levels have also been proved to be useful in algorithms for calculating cardiovascular risk, along with age, gender, smoking status, blood pressure and cholesterol,7–9 and therefore may be a relevant biomarker to be considered in CVD prevention strategies.10 11
An increased mortality at both high and low HbA1c levels has been reported in a meta-analysis of observational studies including type 2 diabetes patients.12 Another meta-analysis, but in subjects without known diabetes, reported a non-linear association between HbA1c and mortality from all causes, CVD and cancer, providing a relatively flat curve dose–response for HbA1c levels around 5.7% and which rose steeply thereafter.13 Thus, although the existence of a ‘security zone’ of HbA1c levels for diabetes management has been suggested, the existence of optimum clinical HbA1c targets is a controversial issue in subjects with and without diabetes.
The aims of this systematic review and meta-analysis were to: (1) estimate the relationship between HbA1c levels and the risk of cardiovascular outcomes and all-cause mortality based on data from observational studies and (2) analyse the range of HbA1c that is the most likely to prevent CVD and/or mortality in populations with and without diabetes.
Methods
This study was reported according to the Preferred Reporting Items for Systematic Reviews and Meta-Analyses14 (figure 1) and the Meta-analysis of Observational studies in Epidemiology15 statements and followed the recommendations of the Cochrane Collaboration Handbook.16 This systematic review and meta-analysis was registered through Prospective Register of systematic reviews (Registration number: CRD42015032552) and its protocol has been published elsewhere.17
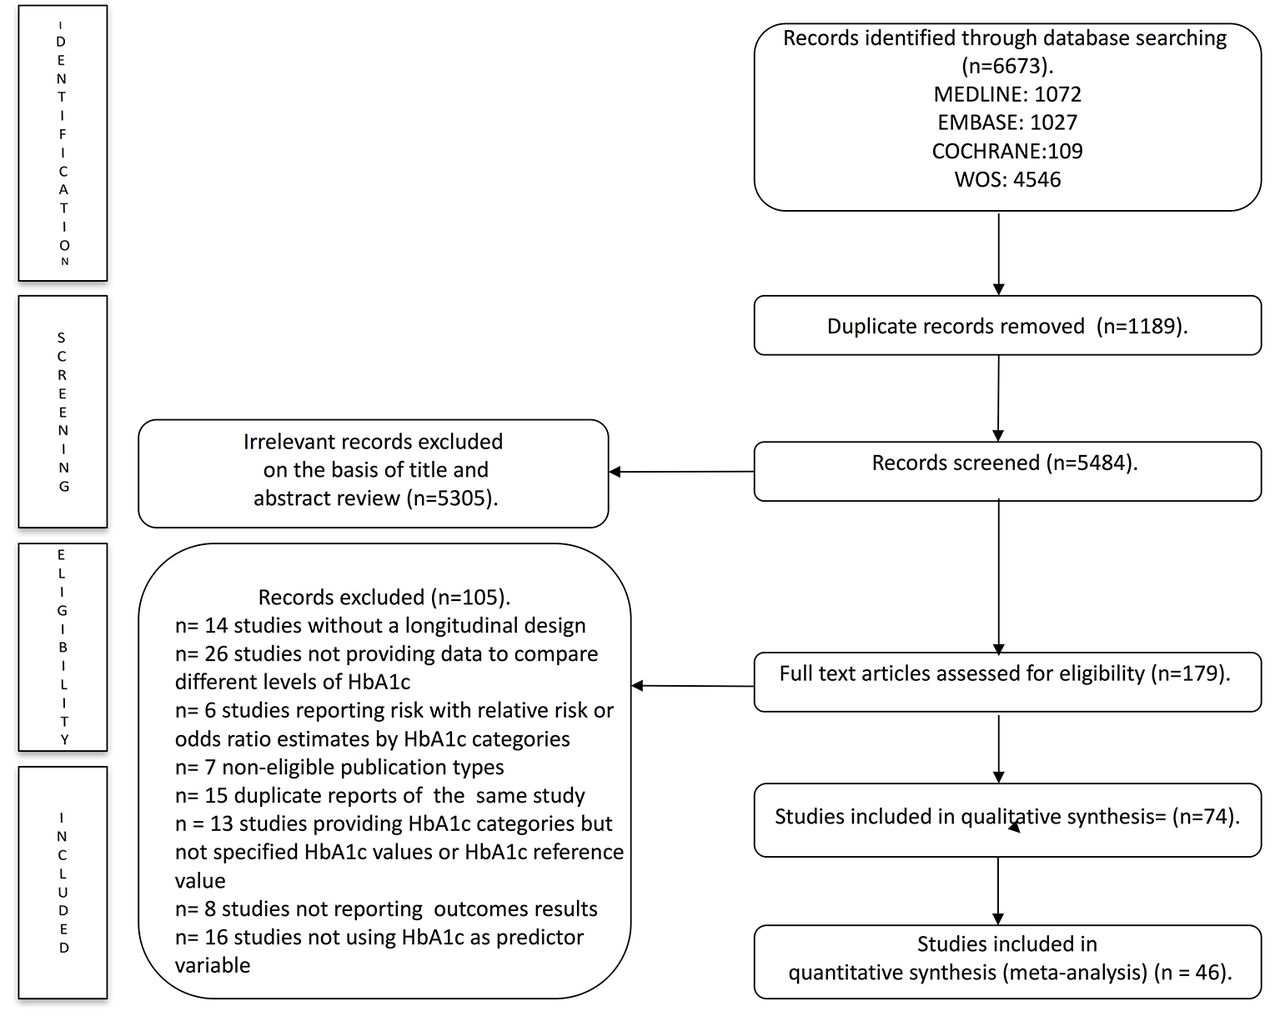
Literature search Preferred Reporting Items for Systematic Reviews and Meta-Analyses consort diagram. HbA1c, glycated haemoglobin A1c; WOS, Web of Science.
Search strategy
We systematically searched Medline (via PubMed), Embase, the Cochrane Central Register of Controlled Trials, the Cochrane Database of Systematic Reviews and Web of Science databases from their inception until July 2016. Articles addressing the association of HbA1c levels with all-cause and cardiovascular mortality and/or any cardiovascular outcomes and based on data from observational studies were eligible. The search expressions are presented in the online supplementary table A. The literature search was complemented by reviewing citations of the articles considered eligible for the systematic review.
Study selection
The criteria for excluding studies were as follows: (1) reports not written in English, Portuguese or Spanish, (2) studies without a longitudinal design, (3) studies not reporting risk of mortality or cardiovascular outcomes, such as myocardial infarction, stroke, major adverse cardiovascular events, coronary heart disease and heart failure, (4) studies not using Cox proportional hazards models to measure cardiovascular outcomes or mortality, (5) studies including individuals aged below 18 years old, (6) non-eligible publication types, such as review articles, editorials, comments, guidelines or case reports, (7) studies not providing data to compare different levels of HbA1c and (8) duplicate reports of the same study.
When more than one study provided data referring to the same sample, we considered the one presenting the results with more detail or providing data for the largest sample size. However, data regarding sample characteristics could be extracted from the multiple reports to obtain the most complete information.
The literature search was performed independently by two reviewers (ICR and CAB), and disagreements were solved by consensus or involving a third researcher (BP).
Data extraction and quality assessment
The following data were extracted from the original reports: (1) year of publication, (2) country, (3) study design, (4) study/project designation and period of data collection, (5) length of follow-up, (6) sample characteristics (sample size and age distribution), (7) type of population (with diabetes or without diabetes, including subjects without known diabetes), (8) diabetes diagnosis criteria, (9) methods used in HbA1c assay, (10) level of HbA1c used as the reference and (11) number of cardiovascular events and/or deaths.
The Quality in Prognosis Studies (QUIPS) tool18 was used to evaluate the risk of bias in six domains: study participation (sampling bias), study attrition (attrition bias), prognostic factor measurement, outcome measurement (ascertainment bias), confounding measurement and accounting and analysis and reporting. Studies were considered to have a low, moderate or high risk of bias, if they satisfied five to six, three to four or one to two of the six domains, respectively.
Data extraction and quality assessment were independently performed by two reviewers (ICR and CAB) and inconsistencies were solved by consensus or involving a third researcher (BP).
Statistical analysis and data synthesis
The DerSimonian and Laird method19 was used to compute pooled estimates of HR and respective 95% 95% CI for all-cause mortality, cardiovascular mortality and risk of cardiovascular events, separately for people with diabetes and without diabetes. The heterogeneity of the results across studies was evaluated using the I2 statistic. I2 values of <25%, 25%–50% and >50% usually correspond to small, medium and large heterogeneity, respectively.20 The corresponding p values were also considered. At least four observations providing HR estimates were required to conduct meta-analysis.
When studies presented several statistical risk-adjustment models, we considered those that included the largest number of additional covariates. A pooled HR estimate for each HbA1c level was calculated with the DerSimonian and Laird method using the specific HR reported in the studies. Furthermore, in the meta-analyses of cardiovascular events’ incidence, pooled HR estimates were computed taking into account all of the possible events (myocardial infarction, stroke, major adverse cardiovascular events, coronary heart disease and heart failure). For each HR estimate, the natural log HR (lnHR) was calculated by converting it to the natural log scale.
Additionally, for all-cause mortality, HR estimates for each HbA1c category from all studies were converted onto a common scale using HbA1c <6.0% as reference category for population with diabetes and HbA1c <5.0% for those without diabetes. HR estimate was reciprocated from risk or protective factor to reference value.21
Sensitivity analyses were conducted to assess the robustness of the summary estimates and to detect if any particular study accounted for a large proportion of heterogeneity. In addition, random-effects meta-regression was used to evaluate whether results differed according to the mean age of the participants and the length of follow-up,22 as these could be considered major sources of heterogeneity. Subgroup analyses were performed based on the risk of bias assessed by the QUIPS tool (low, moderate or high risk of bias).
Finally, publication bias was evaluated through visual inspection of the funnel plots, as well as by using the method proposed by Egger.23 Also, Rosenthal's fail-safe N method was used to determine the number of unpublished or unretrieved null studies that would be needed to increase the p value above 0.05 (to make the effect not statistically significant).24
Statistical analyses were performed using Stata/SE software V.14.
Patient involvement
Neither patients were involved in the election of the research question or the outcome measures nor they were involved in the design or implementation of the study. No patients were asked regarding the interpretation or writing up of results. There are no plans to disseminate the results of the research to study participants or the patient community.
Results
Systematic review
We identified 74 studies (see figure 1 and both a full list of references of included studies in the online supplementary references and online supplementary table B) quantifying the HR for the association between HbA1c levels and the risk of all-cause mortality, cardiovascular mortality or risk of cardiovascular events, which were conducted in 20 countries: three from the Americas, seven from Asia, nine from Europe and one from Oceania.
The reports were published between 2005 and 2016 and provided data collected between 1979 and 2013. The follow-up duration varied across studies, from 3 months to 18 years.
Regarding the characteristics of the population evaluated in the studies, 37 were performed in medical centres, 25 were community based, nine used national databases, two used hospital databases and one was conducted in an elderly institution. Included subjects were aged between 25 and 90 years, with sample sizes ranging from 78 to 548 808 subjects. The studies included populations with diabetes, without diabetes or both (in general population, in patients with disease and in patients with renal disease). The data extracted from the included studies were adjusted for several covariates (see online supplementary table C).
The diagnosis criteria guidelines used to ascertain the diagnosis of diabetes mellitus were specified in 31 studies (ADA, International Statistical Classification of Diseases and Related Health Problems, WHO, Read Codes or Experts Committee). Only 18 studies used certified national glycohaemoglobin standardisation programme methods for the assessment of HbA1c level.
Study quality
As assessed by the QUIPS tool (see online supplementary table D), 39% of the studies obtained a total score corresponding to a low risk of bias, 57% moderate and only 4% had a high risk of bias. The study attrition domain showed a high risk of bias in most studies (72%). Conversely, 77% of the studies showed a low risk of bias in the statistical analysis and reporting domain, and no study scored a high risk of bias in study participation.
Meta-analyses
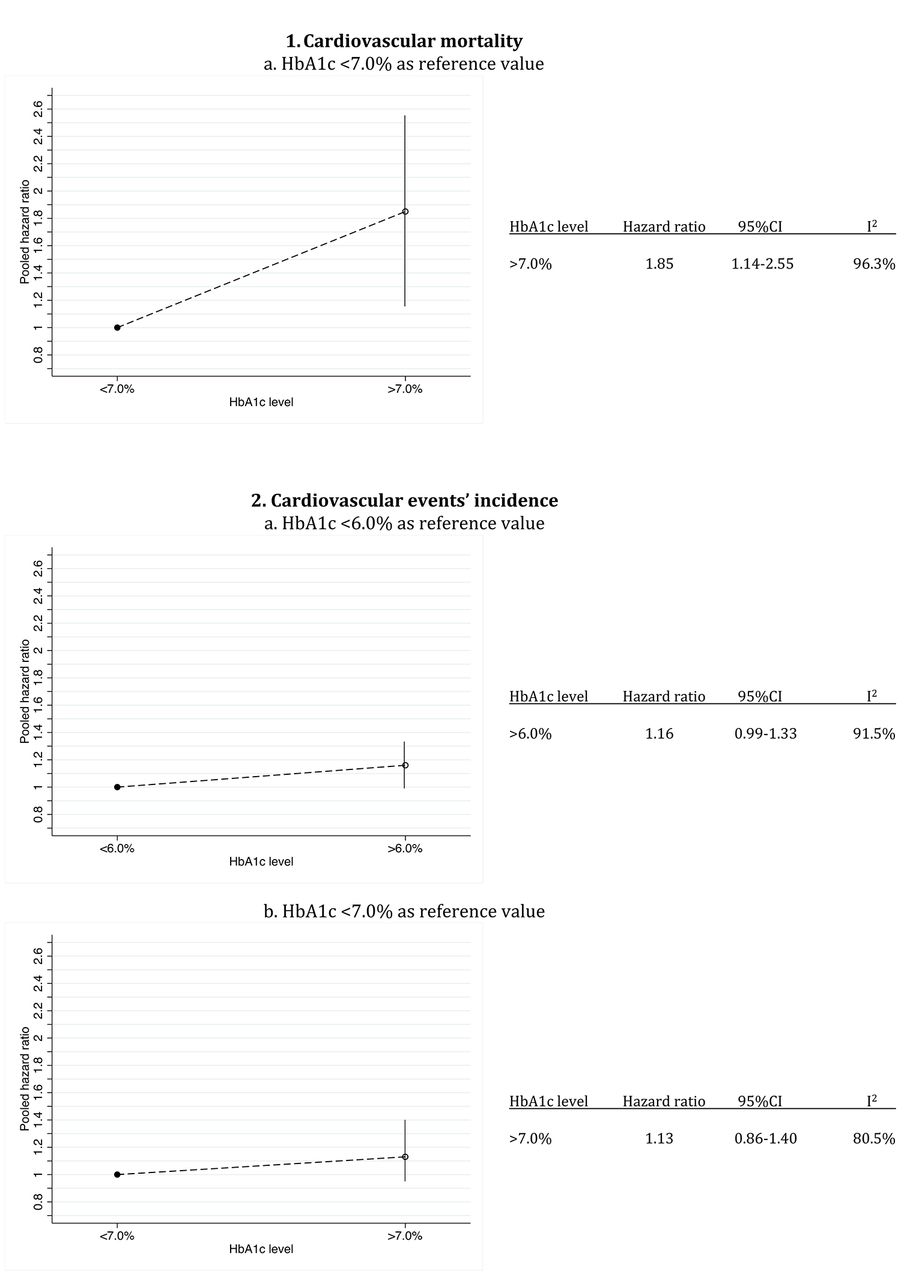
To more clearly display the pooled HR estimates of all-cause mortality, cardiovascular mortality and risk of cardiovascular events, we have provided figures including the pooled HR estimates, their 95% CI and the I2 heterogeneity statistic for each HbA1c level, using the different reference values of this biochemical parameter provided by the included studies (figures 2–5). The corresponding forest plots are available as online supplementary figures A–F).

Pooled HRs for all-cause mortality in diabetic population, according to HbA1c levels. HbA1c, glycated haemoglobin A1c.

Pooled HRs for all-cause mortality in non-diabetic population, according to HbA1c levels. HbA1c, glycated haemoglobin A1c.

Pooled HRs for cardiovascular mortality and risk of cardiovascular events in diabetic population, according to HbA1c levels. HbA1c, glycated haemoglobin A1c.

Pooled HRs for cardiovascular mortality and risk of cardiovascular events in non-diabetic population, according to HbA1c levels. HbA1c, glycated haemoglobin A1c.
All-cause mortality in diabetic population
Regardless of the reference value, the pooled HR increased significantly (p<0.05) for HbA1c levels above 9.0% (figure 2A–D) and for HbA1c ranging from 8.0% to 9.0% (figure 2B, C and D). For levels of HbA1 below 6.0%, the pooled HR estimates were also significantly higher (p<0.01) as compared with the reference values (supplementary figure G and figure 2B and D). There was substantial heterogeneity between the studies included, except for HbA1c levels below 6.0% (I2=0.0%, figure 2B) and HbA1c ranging from 8.0% to 9.0% (I2=25.3%, figure 2C).
When pooled HR was calculated converting HbA1c <6.0% as reference level, an increase of risk was shown at HbA1c level >9.0% (p<0.001). Conversely, HbA1c levels 6.0% to 7.0% and 7.0% to 8.0% were presented as protective factor (p<0.001).
All-cause mortality in non-diabetic population (
Overall, levels of HbA1c above 6.0% were significantly (p<0.001) associated with higher pooled HR estimates (figure 3A–C). Also, for levels of HbA1 below 5.0%, the pooled HR estimates were significantly higher (p<0.01) as compared with the reference values (figure 3C). There was no heterogeneity between the studies included.
When pooled HR was calculated converting HbA1c <5.0% as reference level an increase of risk was shown at HbA1c level >6.0% (p<0.05) (see online supplementary figure G).
Cardiovascular mortality and risk of events in diabetic population
HbA1c levels above 7.0% were associated (p<0.05) with a higher pooled HR for cardiovascular mortality (figure 4A.1). Overall, pooled estimates of HR for HbA1c levels above 6.0% were not significantly associated with a higher risk of cardiovascular events (figure 4B.1 and 4B2). There was substantial heterogeneity between the studies included.
Cardiovascular mortality and risk of events in non-diabetic population
Overall, HbA1c levels higher than 6.0% were significantly associated with higher pooled HR estimates for cardiovascular mortality (figure 5A.1 and 5A.3). This also occurs when the HbA1c level was above 6.5% (figure 5A.2). Additionally, when HbA1c levels were above 5.0% and were compared with lower HbA1c levels (figure 5A.1), the pooled HR estimates increased (p<0.01). As compared with levels of HbA1c between 5.0% and 6.0%, levels below 5.0% were not significantly associated with higher pooled HR estimates for both risk of cardiovascular events and cardiovascular mortality (figure 5A.3 and 5B.1). There was only substantial heterogeneity for Hba1c levels above 6.0% (figure 5A.1) and and HbA1c ranging from 5.5% to 6.5% (figure 5A.2).
Sensitivity analysis, meta-regression subgroup analysis and publication bias
When the impact of individual studies was examined by removing studies from the analyses one by one, the pooled HR for all-cause mortality in diabetics increased only when removing the Ricks et al study. We also observed that there were seven studies for all-cause mortality in diabetic population and one for all-cause mortality in non-diabetic population, for which heterogeneity decreased when they were removed.
The metaregression model showed that the length of follow-up was associated with heterogeneity across studies of all-cause mortality in diabetics at HbA1c levels above 9.0% as compared with reference level below 6.0% (p=0.036) and across studies of all-cause mortality in those without diabetes at HbA1c levels below 5.0% as compared with HbA1c ranging from 5.0% to 5.9% (p=0.027). The mean age of the participants was associated with heterogeneity across studies in the meta-analysis of cardiovascular mortality in non-diabetic population at HbA1c levels above 6.0% using HbA1c below 5.0% as the reference level (p=0.042).
Subgroup analyses based on the risk of bias assessed by the QUIPS tool showed a decrease in some pooled HR estimates when the analysis was performed in studies with low risk of bias (see online supplementary table E).
Egger's test showed potential publication bias for all-cause mortality in diabetic population at HbA1c ranging from 6.0% to 7.0%, using HbA1c levels below 6.0% as the reference (p=0.006; Fail-safe N test=0) and at HbA1c below 6.0% using HbA1c ranging from 7.0% to 8.0% as the reference level (p=0.046; Fail-safe N test=197). For cardiovascular mortality in non-diabetic population, potential publication bias was detected at HbA1c levels above 6.5% when HbA1c below 5.5% was the reference (p=0.029; Fail-safe N test=14) and at HbA1c below 5.0% when HbA1c ranging from 5.0% to 5.9% was the reference level (p=0.048; Fail-safe N test=1).
Discussion
This systematic review and meta-analysis provides an overview of the evidence supporting that HbA1c is a risk factor for mortality and cardiovascular outcomes. Our data confirm the association between chronic hyperglycaemia and cardiovascular complications and also highlights the importance of considering hypoglycaemia levels in this association. Furthermore, this meta-analysis establishes the optimal HbA1c associated with the lowest all-cause and cardiovascular mortality ranging from 6.0% to 8.0% in diabetic population and 5.0% and 6.0% in non-diabetic population.
All-cause mortality
Previous systematic reviews and meta-analyses have analysed the all-cause mortality associated with several HbA1c levels using the HR per 1% increase in HbA1c or the relative risk (RR) per 1% increase in HbA1c. These studies have reported an increase for all-cause mortality in patients with diabetes with HbA1c levels around 7.5%12 25 and in subjects without known diabetes,13 with HbA1c levels around 5.7%. Our findings show an increase in all-cause mortality when HbA1c levels are above 8.0%, but also below 6.0%, for people with known diabetes and above 6.0% or below 5.0% for clinical non-diabetic patients. Thus, our data reinforce previous findings26 and support the clinical importance of preventing hypoglycaemia in the diabetic population and in those without a diagnosis of diabetes, in such a way that it suggests that the optimal range for HbA1c might be established from 6.0% to 8.0% in patients with diabetes and from 5.0% to 6.0% in non-diabetic patients. Although previous studies have reported an increase in mortality risk by each 1% increase in HbA1c, their estimates are based on the assumption of a linear relationship between these variables, which the data from studies included in this review did not show. Thus, providing estimates of changes in mortality risk by HbA1c level categories did not presuppose any functional statistical relationship between the involved variables.
Cardiovascular mortality
A previous meta-analysis13 in a non-diabetic population estimated an increase of 5% in cardiovascular mortality per 1% increase in HbA1c levels, though this relationship was curvilinear and the dose–response curve was flat for levels of HbA1c below 5.7%. However, despite its clinical importance, there is a lack of summary estimates regarding the level of HbA1c from which cardiovascular mortality is significantly increased. Our data support that cardiovascular mortality is significantly increased when HbA1c levels are above 8.0% in the population with diabetes and above 6.0% in those without. Thus, our findings confirm the previous results in the population without diabetes, provide estimates regarding the levels of HbA1c from which cardiovascular mortality increases significantly and reinforce the idea that HbA1c may be included in algorithms to calculate cardiovascular risk in clinical settings.7–9
Cardiovascular events’ incidence
To summarise the increase or decrease of risk of cardiovascular events associated with HbA1c levels from data of individual follow-up studies is a complex task because of the variety of health conditions susceptible to be included in this clinical entity. The only meta-analysis that has addressed this issue in patients with type 2 diabetes estimated that each 1% increase in HbA1c was associated with 17% of cardiovascular events’ incidence.25 However, these findings are affected by the length of follow-up because relative risk only takes into account the occurrence of the event at the end of follow-up and there was a wide range in the length of follow-up in the included studies. Our data are in accordance with these estimates though only for people without known diabetes, in which 20% of risk of cardiovascular events in HbA1c levels above 6.0% was observed.
Heterogeneity assessment
Regarding the clinical variability of the samples of the studies included in this meta-analysis, the age of the subjects could be related with the outcome variables observed. It seems judicious to assume that studies in which an elderly population was included, mortality rates would be higher.27 However, our meta-regression analysis did not find any relationship between the mean age of participants and the observed variables, except for one subgroup analysis for cardiovascular mortality in those without diabetes. This is the only subgroup analysis that pooled subjects with the mean age of 38 years and the mean age above 51 years. Age is one of the primary risk factors for CVD and is associated with worst likelihood values in modifiable risk factors and risk of mortality.28 Otherwise, variability in the follow-up is considered an essential indicator of quality.29 We did not observe a relationship between the length of follow-up and the outcomes observed, except for two subgroup analyses which included studies involving elderly individuals and patients with a history of heart failure or kidney disease. The HR for all-cause mortality in these populations was closely related to the duration of the study, since life expectancy in these samples is substantially shorter.
The heterogeneity across subgroup analysis was decreased only by the exclusion of seven studies. Different sources could cause the described heterogeneity among studies: (1) The target population involved subjects from the general population to patients with cardiovascular or renal disease, but previous evidence including equal target populations obtained similar results;30 (2) Subjects came from different countries, there is evidence of differences in the prevalence of diabetes, CVD and mortality across countries,31–33 with East and Southeast Asia (excluding Japan) showing higher prevalences. Only five studies included in the meta-analyses were developed in these regions and only one lead to an increase in heterogeneity; (3)The criteria for the diagnosis of diabetes have changed over time.34 During the 1980s and part of the 1990s, the diabetes diagnosis criteria was a fasting plasma glucose (FPG) above 7.8 mmol/L,35 this was lowered to 7.0 mmol/L36 in 1997. Finally, the HbA1c level above 6.5% was included as a criterion for diabetes diagnosis in 2009.37–39 As the studies were conducted between 1979 and 2013, the progressive change in the diabetes diagnosis criteria could produce misclassification of people with diabetes or without diabetes; (4) Including retrospective studies could affect the accuracy of the data collected for exposures.40
The limitations of this study are common to other meta-analyses: selection bias, potential ecological fallacy and reporting bias. There was evidence for significant publication bias in 4 of the 37 meta-analyses included; it is possible that underpowered studies are less likely to be published. Among the reasons for this publication bias, we can highlight that due to the wide segmentation of data from the studies included in this review, some meta-analyses included a small number of studies, thus publication bias is likely. Furthermore, from the 74 retrieved studies, only 46 were included in the pooled estimates, the other 28 studies reported their results using HbA1c categories not comparable with the included studies; thus, publication bias cannot be disregarded, although these excluded studies provided HR estimates similar to the pooled estimates obtained. Moreover, since 26 studies were excluded because they provided results using a continuous approach, and they presented an HR estimate corresponding to an increase of 1 SD or 1% in HbA1c level, this could contribute to publication bias. Furthermore, using categories in the included studies may have contributed to publication bias and bias in HR estimates because categorising continuous variables can increase the type 1 error rate.41 To assess the magnitude of this bias, we determined the number of unpublished or unrecovered null studies that would have been published to make the effect not statistically significant using the Rosenthal fail-safe N method.24 Finally, of the six excluded studies reporting relative risk or OR estimates, only one study reported an assessment of mortality risk including OR as a measure of effect and using categories of HbA1c comparable to those of the other studies (see online supplementary table F). Therefore, although the exclusion of these studies might bias our pooled estimates, these studies provided risk estimates similar to the pooled estimates obtained. Due to the diversity of the HbA1c reference values used in the studies, we had to group them into categories for comparing the pooled HR estimates for cardiovascular outcomes and all-cause mortality. Despite our efforts to use a comprehensive approach, we should also consider that the meta-analyses were not conducted with the raw data provided by the authors of each study, thus the calculation of HR and corresponding 95% CI from the published data could bias our pooled estimates. Unlike other meta-analyses of observational studies, we have only included pooled estimates of HR, an epidemiological association measure that takes into account the occurrence of the event at the end of follow-up, as OR and RR, and when the event occurs during the follow-up period. Lastly, since many confounders were controlled for in most studies when computing HR, the external validity of our estimates of all-cause mortality, cardiovascular mortality and risk of cardiovascular events, in both diabetic and non-diabetic populations, could be reinforced.
Conclusion
HbA1c is a reliable risk factor for all-cause mortality and cardiovascular mortality in both non-diabetic and diabetic populations. Although the appropriate use of our meta-analysis results should be understood in each particular clinical context, our data suggest that clinicians should consider the level of HbA1c when they assess the risk of cardiovascular and all-cause mortality of each individual patient, and provide an optimal range of HbA1c levels that is associated with lower mortality and cardiovascular events’ incidence. Particularly, our data suggest that clinicians should advise their patients with diabetes to maintain their HbA1c levels in the range of 6.0% to 8.0% and also that the target limits for HbA1c in individuals without diabetes should be in the range of 5.0% to 6.0%. Notwithstanding, more research specifically addressed to evaluating the appropriateness of including this biomarker as a routine analytical parameter for the assessment of cardiovascular risk is needed.
References
Footnotes
Contributors ICR designed and implemented the literature search, designed the data extraction, extracted the data, completed the data analysis and drafted and revised the manuscript. BP designed and supervised the literature search and data extraction and drafted and revised the paper. CAB implemented the literature search and designed and implemented the risk of bias and qualitative analysis. FRA monitored the data extraction and revised the manuscript. VMV designed the literature search and study methods and reviewed the manuscript. VMV is the guarantor.
Funding ICR is supported by a grant from the Universidad de Castilla-La Mancha (FPU13/01582). CAB is supported by a grant from the Spanish Ministry of Ministry of Education, Culture and Sport (FPU13/03137). BP is supported by a grant from the Portuguese Foundation for Science and Technology (SFRH/BPD/108751/2015).
Competing interests None declared.
Provenance and peer review Not commissioned; externally peer reviewed.
Data sharing statement No additional data available.