Article Text

Abstract
Objectives Mortality due to liver disease (of which cirrhosis is the end stage) is increasing more than any other chronic condition in the UK. This study aims to demonstrate that (1) exclusive reliance on mortality rates may not reveal the true burden of liver cirrhosis, and (2) diverse use of diagnostic coding may produce misleading estimates.
Design Observational study.
Setting The Office for National Statistics death registry was interrogated to investigate liver cirrhosis mortality trends in England and Wales from 1968 to 2011.
Main outcome Standardised mortality trends according to three different definitions of liver cirrhosis based on the specificity of diagnostic codes were calculated: 1 (chronic liver diseases), 2 (alcoholic and unspecified cirrhosis only) and 3 (cirrhosis as end-stage liver disease). The mortality trends were compared with incidence rates established in a previous population-based study (based on definition 3), from 1998 to 2009, to investigate discrepancies between these two measures.
Results Over the study period, the overall standardised liver cirrhosis mortality rates were 8.8, 5,1 and 5.4 per 100 000 person-years for definitions 1, 2 and 3, respectively. The mortality rates for definition 3 in 1998 and 2009 were 6.2 and 5.9 per 100 000 person-years, respectively; while the equivalent incidence rates were at least threefold and sixfold higher: 23.4 and 35.9 per 100 000 person-years, respectively. This discrepancy between incidence and mortality rates was also at least threefold in men and women separately and across age groups.
Conclusion Mortality rates underestimated the incidence of liver cirrhosis by at least threefold between 1998 and 2009 and varied with differing definitions of disease. Mortality data should not be used exclusively as an indicator for the occurrence of liver cirrhosis in the population. Routinely collected healthcare data are available to measure occurrence of this disease. Careful consideration should be taken when selecting diagnostic codes for cirrhosis.
- Liver cirrhosis
- Mortality
- Incidence
- Routine data
This is an Open Access article distributed in accordance with the Creative Commons Attribution Non Commercial (CC BY-NC 4.0) license, which permits others to distribute, remix, adapt, build upon this work non-commercially, and license their derivative works on different terms, provided the original work is properly cited and the use is non-commercial. See: http://creativecommons.org/licenses/by-nc/4.0/
Statistics from Altmetric.com
Strengths and limitations of this study
First study to quantify the difference in liver cirrhosis mortality rates based on different definitions of disease
First study to demonstrate that overall mortality rates underestimate the incidence of liver cirrhosis by at least threefold
A key strength of the study is the large number of registered deaths and the long period of time that the data were obtained over.
A potential limitation of death registry data is the change in coding practice over time.
The Office for National Statistics data cover deaths in England and Wales combined, whereas the incidence data are based solely on English general practices.
Introduction
Liver disease, of which liver cirrhosis is the end stage, constitutes the third most common cause of premature death in the UK.1 According to the UK’s current chief medical officer (CMO), the rate of increase in premature mortality from liver disease and from cirrhosis is substantially higher in the UK than other countries in Western Europe.2 Further, cirrhosis per se has recently been reported to be increasing in the UK at a faster rate than the top four most-commonly diagnosed cancers (lung, breast, bowel and prostate).3 The main reasons for the rise in cirrhosis are probably parallel increases in alcohol consumption and obesity.1 4 In the UK, alcohol consumption per person across the population has more than doubled in the last half-century and one in four adults are now considered to be obese.5 6 These are preventable causes and interventions such as minimum pricing for alcoholic drinks, and campaigns for healthier lifestyles have been considered as part of a strategy to reduce liver disease.7 8
Despite its 5-year mortality being equivalent to that seen in colon cancer, and in contrast to the monitoring of new cancer diagnoses, there is no mandatory registration of cirrhosis cases in the UK or elsewhere in the world.9 Estimates of the occurrence of cirrhosis, and consequently the assessment of success or failure of primary interventions, have therefore been primarily drawn from death registry data.1 2 This methodology is likely to mask the true incidence of cirrhosis. First, not everyone with cirrhosis dies directly due to the disease, and our recent population-based study estimated that only 32% of deaths in people with cirrhosis had a cirrhosis-related code anywhere on their death certificate.10 Second, there is a time-lag between diagnosis and death. Hospital-based studies have reported survival estimates at 1 year of around 65%.11 12 Those who do not die immediately after diagnosis, and those who do not die directly from the disease, will not be accounted for by reliance on the death registry.
Establishing accurate estimates of cirrhosis is further compounded by the fact that there is no clear boundary between liver disease and cirrhosis. There are a myriad of liver diseases and for each one patients progress to cirrhosis at different rates, if at all.13 Previous authors of well-cited papers have used a range of codes representing different liver diseases when reporting mortality due to ‘liver cirrhosis’.11 12 14 Subsequently it is often not possible to determine whether authors are truly examining liver disease or cirrhosis per se.
In the UK, as in many Northern European countries, patients with suspected liver cirrhosis may be diagnosed by their primary care physician, or more commonly are referred to a secondary care specialist who will then pass on information to the primary care physician. Our research group has therefore used linked primary and secondary routine healthcare databases to capture the incidence of cirrhosis as comprehensively as possible.3 Given the dependence of health service planning on accurate knowledge of occurrence of disease, we sought to use routinely available data to (1) examine how cirrhosis mortality rates may differ according to the range of specificity of diagnostic codes used within the hepatology community and (2) quantify the difference between cirrhosis mortality rates (from death registry data) and cirrhosis incidence rates (previously established) from linked routine healthcare databases) based on the same definition of disease and over the same time period.
Methods
Data sources
We obtained mortality data from the Office for National Statistics (ONS) website (https://www.ons.gov.uk). These data are derived from registered death certificates and consist of counts of death by underlying cause (based on the International Classification of Disease (ICD)15) year of death, 5-year age group and sex for England and Wales from 1968 to 2011. Population data for the respective years were also obtained from the ONS website stratified by 5-year age group and sex. We used the linked Clinical Practice Research Datalink (CPRD) and English Hospital Episodes Statistics (HES) to conduct a cohort study identify incident diagnoses of cirrhosis between 1998 and 2009 (n=5118). The diagnoses in the CPRD are made by histological examination and/or characteristic clinical signs of advanced liver disease.3
Definitions of cirrhosis
We used three definitions of cirrhosis according to the specificity of ICD diagnostic coding.
Definition 1
This code list was developed by Leon and McCambridge14 for international comparisons and has been selected as it is a relatively broad definition of cirrhosis and includes other chronic liver disease (eg, alcoholic liver disease and chronic hepatitis) and has been used widely by other authors.16
Definition 2
This is a restrictive definition used by Jepsen et al,17 including only alcoholic and unspecified cirrhosis of the liver.
Definition 3
This code list reflects cirrhosis as the end stage of liver disease and includes codes for portal hypertension and oesophageal varices which are not included in the above definitions. This code list is the same definition our group has used previously to define a cohort of people with an incident diagnosis of cirrhosis in England using the linked CPRD and HES.3
To provide a context, we combined all liver diseases according to ICD version 10 chapter ‘Diseases of the Liver’ (K70–K77) and refer to this this category as ‘liver disease’. During the calendar period, considered three different revisions of the ICD were used and mapping across these three versions are shown in online supplementary tables 1 and 2.15 18 19
Statistical analysis
Mortality rates
Age at death was categorised from the age of 15 years in three groups (<45, 45–64 and ≥65 years). We determined crude mortality rates per 100 000 person-years from 1968 to 2011 for liver disease and all three definitions of cirrhosis. We calculated age stratum and sex stratum-specific cirrhosis mortality rates and applied these to the 2011 population to generate annual standardised mortality rates. Negative binomial regression modelling was used to estimate mortality rate ratios with adjustment for age and sex. We determined average annual increase.
Incidence rates
Determining the incidence of cirrhosis (using definition 3) has been described elsewhere.3 In brief, we defined a cohort of incident diagnoses from the linked CPRD and English HES data from 1998 to 2009 for adults from the age of 18 years onwards. Estimates of incidence from the study have been standardised to the 2011 population and used in this current paper to make a direct comparison with standardised mortality rates over the same time period and using the same definition of disease.
Results
Standardised mortality rates
The overall standardised mortality rates for definitions 1 to 3 of cirrhosis over the study period were 8.8 (95% CI 8.8 to 8.8), 5.4 (95% CI 5.4 to 5.5) and 5.1 (95% CI 5.0 to 5.1) per 100 000 person-years, respectively. Figure 1 displays the standardised mortality trends from 1968 to 2011 for all definitions. There was only a marginal difference in absolute and relative terms between liver diseases combined and definition 1, and similarly, only a marginal difference between definitions 2 and 3.

Standardised* mortality rates for England and Wales, 1968–2011, for liver disease† and different definitions‡ of cirrhosis. Standardised* incidence rates for definition 3, from 1998 to 2009. *Age and sex standardised to the 2011 population in England and Wales. †ICD-8, ICD-9 and ICD-10 codes listed for each definition in online supplementary tables 1 and 2. ‡Liver disease defined as ICD-10 codes for ‘Diseases of the Liver’ K70–K77 (or equivalent ICD-8 and ICD-9 codes, see online supplementary tables 1 and 2). ICD-8–10, International Classification of Diseases Eighth, Ninth and Tenth Revision.
Between 1979 (the introduction of ICD Ninth Revision (9)) and 2001 (the introduction of ICD Tenth Revision (10)), the average annual relative increase in mortality from cirrhosis was 1.04 (95% CI 1.03 to 1.04), 1.01 (95% CI 1.01 to 1.01) and 1.01 (95% CI 1.01 to 1.02) for definitions 1, 2 and 3 respectively. From 2001 onwards the increase was smaller for all definitions: 1.00 (95% CI 1.00 to 1.01), 1.00 (95% CI 0.99 to 1.00) and 0.99 (95% CI 0.99 to 1.00), respectively.
From 1992 to 2008, the absolute difference in rates between those of definition 1 and definition 2 diverged further with time. For example, the absolute rates for definition 1 in 1992, 1996 and 2008 were 7.8, 9.4 and 14.6 per 100 000 person-years; the equivalent for definitions 2 and 3 were 4.8, 5.5 and 5.8 and 5.5, 5.7 and 5.8, respectively.
Change in cause of death over time
To explore possible reasons for the divergence in deaths between the different definitions of disease, from 1992 and 2008, we have presented the distribution of causes of death in 1992 and 2008 per definition (table 1). We have not displayed the distribution for definition 2 as it is similar to that of definition 3.
Distribution of causes of death for liver cirrhosis definitions 1 and 3 in 1992 and 2008, n (%)
In 1992, the percentage of deaths attributed to alcoholic liver damage (ICD-9 5713), which is included in definition 1 but not in definition 3, was 21.2%. This increased to 40.1% in 2008 (ICD-10 K70.9). During the same time frame, the percentage of deaths due to alcoholic cirrhosis (ICD-9 5712) decreased from 24.6% to 15.7%. In contrast, the distribution of causes of death of definition 3 did not change that dramatically. For example, 35.4% of deaths in 1992 were due to alcoholic cirrhosis of the liver (ICD-9 5712) and the equivalent proportion in 2008 was 39.4% (ICD-10 K70.3). Similarly, the proportion of deaths due to cirrhosis without mention of alcohol was 52.2% in 1992 (ICD-9 5715) and 57.5% in 2008 (ICD-10 K74.6).
Comparison between mortality and incidence rates
In a previous study, we determined the incidence of cirrhosis in England during the period 1998 to 2009 using definition 3 of cirrhosis.3 These rates have been standardised to the 2011 population and inserted into figure 1. Specifically, the standardised incidence rates were 23.4 and 35.9 per 100 000 person-years in 1998 and 2009, respectively. This is in sharp contrast to the standardised mortality rates of 6.2 and 5.9 per 100 000 person-years in 1998 and 2009, respectively (in England and Wales). The overall rate of change between 1998 and 2009 was 50.6% for incidence, whereas mortality rates decreased by 2.5% over the same time period. The mortality rates according to definition 1 were also substantially less than the estimates of incidence; 11.1 and 13.8 per 100 000 person-years in 1998 and 2009, respectively, equating to a rate of change of only 28.9% across the period (figure 1).
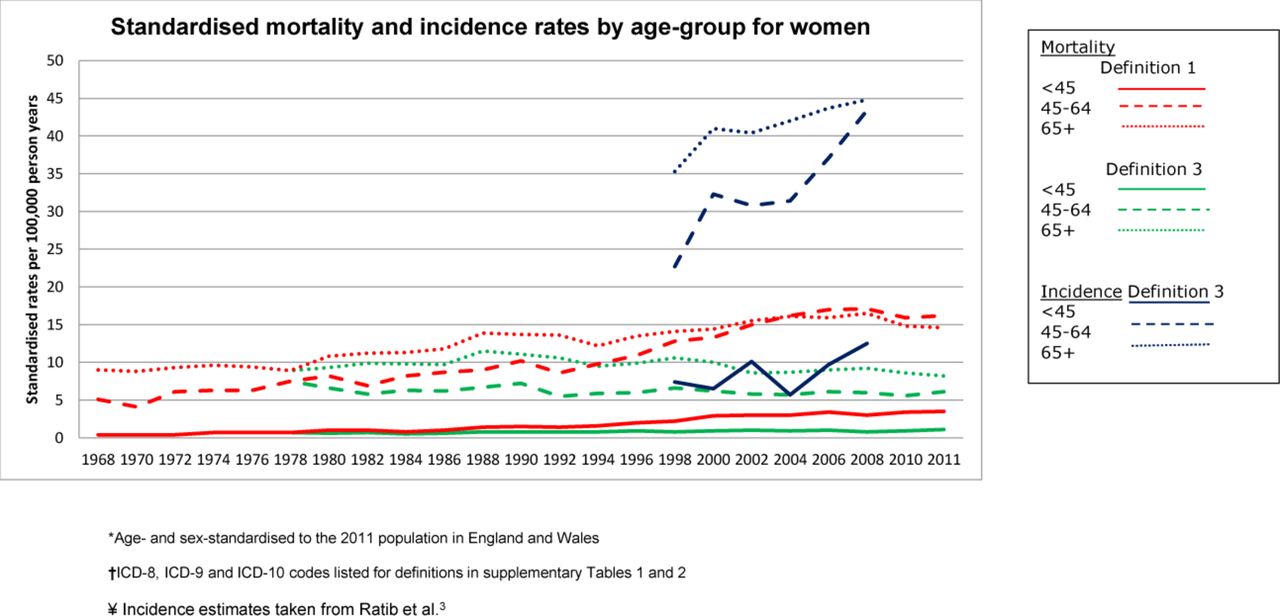
For both sexes, the standardised incidence rates were between threefold and sixfold that of mortality (definition 3) in all age groups, across the study period (figures 2 and 3). The incidence rates were also substantially higher than mortality rates based on definition 1, for both men and women and across all age groups.
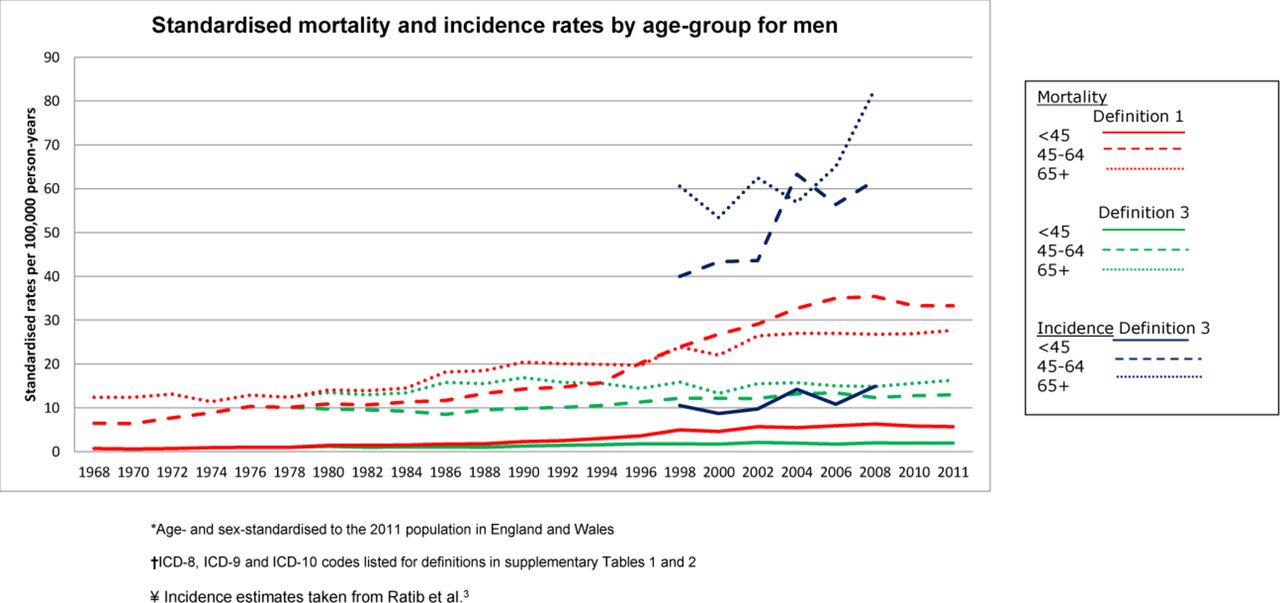
Standardised* mortality and incidence† rates by age group in men, according to cirrhosis definitions 1 and 3‡. *Age and sex standardised to the 2011 population in England and Wales. †Incidence estimates taken from Ratib et al.3 ‡ICD-8, ICD-9 and ICD-10 codes listed for each definition in online supplementary tables 1 and 2. ICD-8–10, International Classification of Diseases Eighth, Ninth and Tenth Revision.

Standardised* mortality and incidence† rates by age group in women, according to liver cirrhosis definitions 1 and 3‡. *Age and sex standardised to the 2011 population in England and Wales. †Incidence estimates taken from Ratib et al.3 ‡ICD-8, ICD-9 and ICD-10 codes listed for each definition in online supplementary tables 1 and 2. ICD-8–10, International Classification of Diseases Eighth, Ninth and Tenth Revision.
Discussion
Main findings
We found that both the absolute and relative cirrhosis mortality rates varied with differing disease definition. The overall age-standardised mortality rates during 1968 to 2011 were 8.8, 5.1 and 5.4 per 100 000 person-years for definitions 1 to 3, respectively. Careful consideration should be taken when selecting diagnostic codes for cirrhosis so that they are in line with the research question and research wastage is minimised. Further, using different routinely available clinical datasets, we have previously demonstrated that between 1998 and 2009, the incidence of cirrhosis increased by 50.6%, which is in contrast to a decrease in mortality from cirrhosis of 2.5% based on the same definition of disease.3 Cirrhosis incidence rates were consistently higher than mortality rates, at least threefold between 1998 and 2009, independent of age and sex. Mortality rates should therefore not be used alone to monitor the occurrence of cirrhosis; alternative sources of routinely collected data should be considered.
Strengths and limitations
This is the first study to quantify the difference in cirrhosis mortality rates by differing definitions of disease and the first to compare cirrhosis mortality and incidence rates using the same definition of disease. Key strengths of the study are its external validity, the large number of registered deaths and the long period of time that the data were obtained over. The latter meant that we were able to report trends of mortality rates for a period of more than 40 years. A potential limitation of death registry data is the change in coding practice over time, known as coding phenomenon. The change in rate of specific causes of death over time could be due to the use of different ICD versions throughout the study period rather than a true change. For example, the sharp increase in the number of liver disease deaths (definition) 1 after 1979 when ICD-9 came into use, followed by a reduction in the rate of change from 2001 onwards when ICD-10 came into place. This phenomenon has been reported by others.20 Coding phenomenon also occurs when doctors change the way they select codes on death certificates. For example, over time doctors may be more likely to use codes for alcoholic liver disease even in the presence of alcoholic cirrhosis. This may explain the increase in deaths coded as alcoholic liver damage in contrast to the fall in deaths coded for alcoholic cirrhosis, which we report in this study. Despite the potential changes in coding practice over time, mortality rates using the broadest definition of liver disease are still dramatically lower than the incidence rates of cirrhosis reported using a relatively restricted definition. Finally, the ONS data cover deaths in England and Wales combined, whereas the incidence data are based solely on English general practices so we are not exactly comparing like with like. However, given similar liver disease mortality in England and Wales,21 if death registry data for England only were available and had been used, the discrepancy between mortality and incidence would highly unlikely be less than that which we report and our conclusions would remain the same.
Implications
Our findings provide evidence that using mortality data alone to measure the occurrence of cirrhosis could have major implications on healthcare planning. Given the sharp rise in cirrhosis incidence in the last decade that is not visible from mortality statistics, the National Health Service may well be under resourced and unable to cope with future demand on hepatology clinics. Mortality and incidence are two very different measures of disease burden. If only cirrhosis which leads to death from cirrhosis is of importance to clinicians and policy-makers, then measuring mortality is indeed the more appropriate measure. However if we are truly concerned with measuring the occurrence of cirrhosis and/or the impact of public health intervention strategies, then incidence rates are crucial. When establishing the success of public health interventions aimed at reducing new disease, such as alcohol policies and healthy eating campaigns, it is essential to set targets for incidence to determine if these sorts of interventions have been effective or not. Evaluation of such interventions needs to account for the long sojourn between disease onset and fibrosis/cirrhosis, which can take between 10 and 30 years.22 Mortality is even further away, therefore even less relevant a measure than incidence. The study by Leon and McCambridge14 (definition 1) used mortality rates as they were believed to be important indicators of population levels of alcohol harm. However, our findings suggest that the use of incidence rates would have been more indicative. Finally, differences in incidence and mortality could be partially due to improvement in treatment and care of chronic liver disease, if anything this means that with improving treatment mortality becomes an even worse proxy measure of burden. One recommendation for future work, from this study, is to measure the incidence of cirrhosis by using routinely collected healthcare data often known as ‘Big Data’. Such data are becoming increasingly familiar and accepted in hepatology with, for example, the recent Lancet Commission recommending non-alcoholic fatty liver disease prevalence be measured by establishing a cohort from primary care data.1 The strengths of using routinely collected data are from methodological and cost-effectiveness perspectives. First, the recent linkage of primary care and secondary care allows a representative cohort of patients covering the full spectrum of disease to be identified, representative of the English population.3 23Second, accessing large amounts of routinely collected data for chronic diseases is substantially cheaper than establishing a bespoke prospective cohort of patients and following them potentially for several decades. Similar discrepancies between mortality and incidence figures have been shown in other diseases for which there is no mandatory recording such as idiopathic pulmonary fibrosis.24 Routinely collected data may be appropriate to measure the incidence of this condition too.
The second implication of our findings is the necessity of careful consideration of disease definition. We have shown that the inclusion of patients who died from chronic liver diseases introduced an overestimate of cirrhosis mortality rates, by about 60%, comparing definitions 1 and 3 (8.8 per 100 000 vs 5.4, respectively). Definition 1 included codes related to alcoholic liver disease such as alcoholic fatty liver disease (K70.0) and alcohol liver disease (K70.9) (the latter contributed 40% of ‘definition 1’ deaths in 2008), as well as autoimmune diseases, which were not included in definition 3. With respect to alcoholic liver disease, some patients with this condition can fluctuate between alcoholic fatty liver and alcoholic hepatitis and not actually completely progress to cirrhosis, and if they stop drinking, the architecture of their liver may return to normal.13 Consequently, on one hand, it may be misleading to include codes such as alcoholic fatty liver disease (K70.0), alcoholic hepatitis (K70.1) and alcohol liver disease (K70.9) when intending to measure deaths due to cirrhosis. Conversely, one could argue that as these diagnostic codes represent diseases which could be a precursor to cirrhosis, they could actually reflect a poor specification of decompensated disease and hence cirrhosis. For example, this current study has shown that a particular difference between definitions 1 and 3 in the rate of change cirrhosis between 1992 and 2008 may have been mediated through an increase in deaths coded as the broader term ‘alcoholic liver disease’ with a concomitant decline in the number of deaths coded as the more specific ‘alcoholic cirrhosis’. One cannot disprove the possibility of an artefactual difference due to clinicians’ certification practice rather than a true increase in alcoholic liver disease compared with alcoholic cirrhosis. Therefore, it may indeed be appropriate to use broader codes like alcoholic liver disease to capture patients with cirrhosis who may not have been certified as dying from cirrhosis per se. The key point is that code lists should reflect the precise research question that is being posed, otherwise results are misleading. Future research should take this finding into account. We acknowledge that specific ICD-10 codes for chronic viral hepatitis such as chronic hepatitis B (B18.1) and chronic hepatitis C (B18.2) have not been considered by researchers in the field. Inclusion of these codes could also be considered when developing a broad definition of cirrhosis.
Conclusion
This study has highlighted that reliance on mortality data alone may lead to an underestimate of the occurrence of cirrhosis, and indeed liver disease in general. Consequently the occurrence of liver disease in England is likely to be considerably greater than that which others report, including the current UK CMO.1 2 25 26 Alternative sources of routinely collected data should be considered as a matter of urgency and appropriate definitions of disease employed. Accurate monitoring of the incidence of cirrhosis will allow the optimisation of limited healthcare services and provide appropriate baseline figures from which to evaluate intervention, particularly those implemented at population level.
References
Footnotes
Contributors JW had the original idea for the study and all authors contributed to its interpretation. SR was responsible for data management, the statistical analysis and wrote the first draft of the paper. KMF and JW revised the paper critically and all authors approved the final version.
Funding This research received no specific grant from any funding agency in the public, commercial or not-for-profit sectors. SR was funded by a Senior Clinical Research Fellowship from University of Nottingham/Nottingham University Hospital NHS Trust awarded to JW.
Competing interests None declared.
Patient consent Detail has been removed from this case description/these case descriptions to ensure anonymity. The editors and reviewers have seen the detailed information available and are satisfied that the information backs up the case the authors are making.
Ethics approval Approval was given by the Independent Scientific and Ethical Committee of the CPRD for the CPRD study (09_065RA_3). Ethical approval was not required for the use of Office for National Statistics mortality data.
Provenance and peer review Not commissioned; externally peer reviewed.
Data sharing statement Patient level data and full data set and technical appendix and statistical code are available from the corresponding author SR. Consent was not obtained but the presented data are anonymised and risk of identification is low.