Article Text

Abstract
Objectives To examine trends in socioeconomic inequalities in major cardiovascular disease (CVD) risk factors among the Korean population.
Design Cross-sectional study.
Setting A nationally representative population survey database.
Participants A total of 42 725 Koreans, aged 25–64 years, who participated in the Korean National Health and Nutrition Examination Survey (KNHANES) II (2001) to VI (2013–2014).
Main outcome measures Trends in socioeconomic inequalities in five major CVD risk factors (smoking, obesity, diabetes, hypertension and hypercholesterolaemia).
Results Gender differences were noted in the time trends in socioeconomic inequalities in smoking, obesity, diabetes and hypertension. Among men, low socioeconomic status (SES) was associated with higher prevalence of smoking, but not with obesity, diabetes or hypertension. The magnitudes of socioeconomic inequalities in smoking, obesity and diabetes remained unchanged, and the magnitude of the inequality in hypertension decreased over time. However, among women, low SES was associated with higher prevalence of smoking, obesity, diabetes and hypertension. Time trends towards increasing socioeconomic inequalities, measured by income, in smoking, obesity and diabetes were found in women. Unlike the other CVD risk factors, hypercholesterolaemia was not associated with socioeconomic inequality.
Conclusions SES had a stronger impact on major CVD risk factors among Korean women than men. Moreover, socioeconomic inequalities in smoking, obesity and diabetes worsened among Korean women over time. Public policies to prevent smoking, obesity and diabetes in women with lower SES are needed to address inequalities.
- trend
- health inequality
- cardiovascular disease
- cardiovascular disease risk factors
This is an Open Access article distributed in accordance with the Creative Commons Attribution Non Commercial (CC BY-NC 4.0) license, which permits others to distribute, remix, adapt, build upon this work non-commercially, and license their derivative works on different terms, provided the original work is properly cited and the use is non-commercial. See: http://creativecommons.org/licenses/by-nc/4.0/
Statistics from Altmetric.com
Strengths and limitations of this study
The strength of this study is that a nationally representative sample was used as the study population.
The limitation of this study is that a period longer than 14 years could not be used for the investigation of socioeconomic inequalities, as data from Korean National Health and Nutrition Examination Survey (KNHANES) I (1998) were excluded due to a lack of reliability and there were no available nationally representative data before 1998.
The steady decline of response rates in the KNHANES could result in underestimation of inequalities.
Introduction
Socioeconomic status (SES) has shown inverse associations with cardiovascular disease (CVD) in most industrialised Western countries, such that disadvantaged groups experience higher risks for CVD.1 2 A considerable portion of the association between SES and CVD has been attributed to the integrated effects of inequalities in health-related habits and accessibility to healthcare system.3 As CVD mortality and morbidity contribute sizeable proportions to overall health inequality, attempts to reduce these causes of death are public health concerns.4 Previous studies have shown that a greater decline in the prevalence of CVD risk factors among higher SES groups widened the gap among SES groups over time in the USA.5 6 However, studies in England and Australia failed to provide strong evidence that socioeconomic inequalities in CVD risk factors had increased in recent decades.7 8
Korea, a recently developed country, has experienced rapid socioeconomic growth. The per capita gross national income has increased 2.5-fold over the past 14 years (from US$11 000 in 2001 to US$27 000 in 2014), but the gap in socioeconomic circumstances has widened during this period.9 10
To our knowledge, no previous study has examined time trends in socioeconomic inequalities with regard to major CVD risk factors in Koreans. The purpose of this study was to examine recent national trends in socioeconomic inequalities in five major CVD risk factors (smoking, obesity, diabetes, hypertension and hypercholesterolaemia) using national survey data by gender.
Methods
Study participants
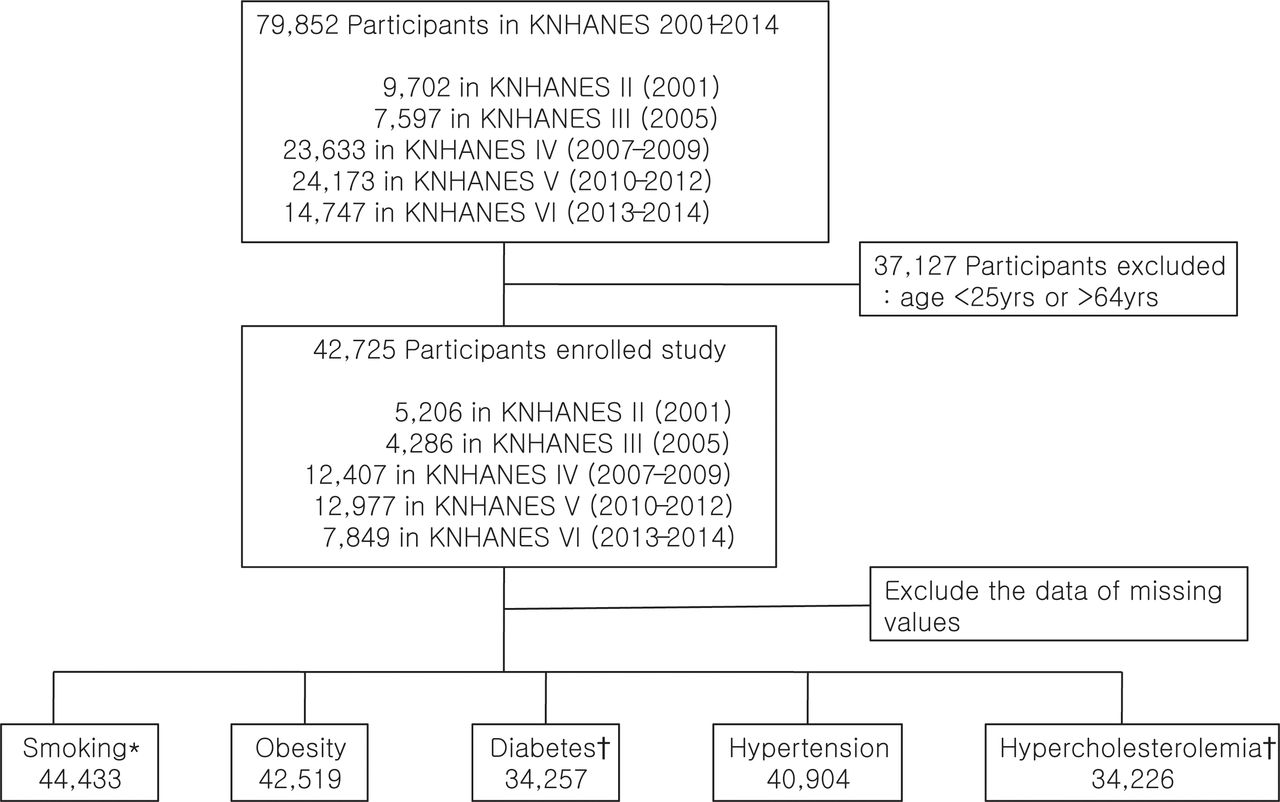
This study analysed the data from five consecutive Korean National Health and Nutrition Examination Survey (KNHANES) conducted from 2001 to 2014. The KNHANES is a national survey that assesses the general health and nutritional status of the Korean population. More information on the survey design and data collection of KNHANES has been reported previously.11 The KNHANES was initiated in 1998, but we excluded the data from KNHANES I (1998) due to lack of reliability.12 The response rates were 92.3%, 99.1%, 78.4%, 80.8% and 78.6% for KNHANES II, III, IV, V and VI, respectively. In this study, the study population was limited to adults aged 25–64 years to examine trends in socioeconomic inequalities. Considering the applicability of SES (income and education), we excluded survey participants aged younger than 25 years who may not have completed their education or have no job and those older than 64 years who were mostly economically inactive. For the four CVD risk factors (obesity, diabetes, hypertension and hypercholesterolaemia), the total number of participants in the analysis was 42 725, which included 5206 participants from the KNHANES II (2001), 4286 participants from the KNHANES III (2005), 12 407 participants from the KNHANES IV (2007–2009), 12 977 participants from the KNHANES V (2010–2012) and 7849 participants from the KNHANES VI (2013–2014) (figure 1). The total number of participants included in the smoking analysis was 45 522, which is different from the number included in the analysis of other risk factors because health interview data, instead of health examination data, were used to determine subjects’ smoking status. We composed the five data sets for each CVD risk factor individually, excluding the data with missing values for each CVD risk factor. (figure 1)

Study enrolment. The enrolled study population was from the Korean National Health and Nutrition Examination Surveys (KNHANES) 2001–2014. *Smoking: data from the health interviews were analysed; the total number of participants is 45 522. †Diabetes and hypercholesterolaemia: data from the of KNHANES III (2005) to VI (2014) were analysed; the total number of participants is 37 519.
Health interview and health examination
KNHANES consists of three component surveys: the health interview, health examination and nutrition survey.11 The health interview survey collects detailed information on SES (eg, education level, household income), smoking and drinking behaviours, and healthcare utilisation. There is a questionnaire about whether you have been previously diagnosed with diabetes or taking oral hypoglycaemic agents (eg, for treatment of diabetes, ‘what is your treatment for diabetes mellitus?’, with the following answer categories: insulin, oral hypoglycaemic agents or lifestyle modification). Height was measured to the nearest 0.1 cm and weight was measured nearest to 0.1 kg. The trained nurses measured systolic blood pressure (SBP) and diastolic blood pressure (DBP) at at least 5 min rest using a mercury sphygmomanometer (Baumanometer; Baum, New York, USA), according to the standard protocol.
Methods of blood sampling and analysis
Blood samples from each participant were taken after an 8 hour fasting and processed according to the protocols of KNHANES.11 The blood was centrifuged (2500~3000 rpm) for 15 min after separating an 8 mL serum separation tube (SST), which was kept at room temperature for 30 min to analyse lipid level. And a 2 mL NaF (sodium fluoride) tubes were mixed in a roller mixer for 10 min to analyse glucose level. All samples were kept in the refrigerator (2°C–8°C) and the glucose and lipid levels were measured (Advia 1650; Siemens, New York, USA, in 2005 and 2007; Hitachi Automatic Analyzer 7600; Hitachi, Tokyo, Japan, since 2008). From 2005, the quality control programme to monitor laboratory performance to ensure the values met acceptable standards of precision and accuracy started in a central laboratory.11 Because the programme has started in 2005, we only analysed the data of serum glucose and cholesterol level collected since 2005 in this study.
SES indicators
Education level and income were used as SES indicators. Education level was grouped into four categories: college or higher (≥13 years), high school (10–12 years), middle school (7–9 years) and elementary school or less (≤6 years). The measure of income was equivalised gross household income per month, defined as the total household income divided by the square root of the number of household members to adjust for the effect of the number of individuals in the household. We divided study subjects into four groups according to quartiles of equivalised household income by gender and age (Q1–Q4; Q1, highest quartile; Q4, lowest quartile).
Definition of CVD risk factors
Smoking, obesity, diabetes, hypertension and hypercholesterolaemia were examined because these are major independent risk factors for CVD.13 Cigarette smoking was defined as satisfying the following two questions: For the question ‘How many cigarettes have you smoked in your entire life?’, the answer was ‘More than 100 cigarettes’, and for the question ‘Do you smoke cigarettes now?’ the answer was ‘Yes’. Body mass index (BMI) was calculated from weight to height squared (kg/m2). Obesity was defined as a BMI of ≥25 kg/m2, according to the criteria of Asia-Pacific region.14 Diabetes was defined as fasting plasma glucose of ≥126 mg/dL, previous diagnosis of diabetes or administration of antihyperglycaemic agents or insulins.15 Hypertension was defined as an SBP and/or DBP ≥140/90/90 mm Hg or administration of antihypertensive agents.16 Hypercholesterolaemia was defined as a plasma total cholesterol of ≥240 mg/dL or administration of cholesterol-lowering agents.17
Statistical analysis
The demographic characteristics of the study participants are presented as mean±SE or age-adjusted prevalence (SE). Comparisons of the characteristics across survey periods were performed using analysis of variance or χ2 test, as appropriate, and χ2 linear trend test was also used. To adjust differences in results from changes in population age structure of each survey, age-adjusted prevalence was calculated using a direct standardisation method based on 2010 Korean Census.
The relative index of inequality (RII), a measure of effect that permits meaningful comparisons of socioeconomic health inequalities over survey periods was computed. The RII enables direct comparisons between SES variables with regard to the proportions of the population in different categories. To obtain the RII for each indicator of SES, a score between 0 (for the highest SES) and 1 (for the lowest SES) was assigned to each category based on the proportion of subjects above the midpoint in the category. For example, if 10% of the subjects were in the highest educational category, participants in the group were represented by the range 0–0.1 and given a score of 0.05 (half of 0.1). If 20% of the population were in the next group, participants in the group were given a score of 0.2 (0.1 plus 0.2/2). The RII was obtained by regressing the outcome on each of the SES scores and was directly interpretable for each SES indicator used to compare participants with the lowest SES (1) with those with the highest SES (0). In this study, the RII of major CVD risk factors is presented using the OR and 95% CI computed from binary logistic regression analysis adjusted for age. Trends in the RII were examined by estimating the p value for an interaction term of SES indicator and the variables that identified the year of the data in the model. Survey year was entered into the model as a numerical value (eg, 2001 for KNHANES II). We also calculated a slope index of inequality (SII) for each risk factor in each survey and investigated the trend of SII. The SII represents the linear regression coefficient that shows the relationship between the prevalence of each CVD risk factor in each SES and the hierarchical ranking of SES on the social scale. In addition, we investigated gender and SES association in an interaction model to examine whether there was a significant difference between the trends in men and women.
As data from KNHANES were derived from stratified and multistage clustered probability sampling methods to represent the entire Korean population, population weightings were also applied in the analyses.11 The PROC SURVEY procedure was used to apply stratification, primary sampling units and population weights. Significant levels were set at a two-tailed p value <0.05. All analyses were conducted using SAS V.9.4.
The STROBE statement checklist is provided in a supplementary file.
Results
The general characteristics of the participants in the KNHANES II (2001) to VI (2013–2014) are shown in table 1. The mean age of participants increased over time (41.2±0.2 to 43.8±0.2 years and 41.6±0.2 to 44.2±0.2 years for men and women, respectively). The proportion of participants with college or higher education (≥13 years) increased gradually, from 39% to 47% for men and from 24% to 39% for women from 2001 to 2014. There were significant interaction effects between gender and SES on RII except for hypercholesterolaemia. The p values for gender by education interaction were <0.001, <0.001, <0.001, <0.001 and 0.768 for smoking, obesity, diabetes, hypertension and hypercholesterolaemia, respectively, while those for the interaction of gender by income were <0.001, <0.001, 0.033, 0.048 and 0.302, respectively. Therefore, we examined the trends in socioeconomic inequalities for major CVD risk factors by gender.
General characteristics of the study population (25–64 years) from 2001 to 2014
Smoking
Over the past 14 years, the age-adjusted smoking prevalence decreased significantly, from 64% to 47% in men, but it did not change in women (table 1). Low SES was associated with a high prevalence of smoking in both genders (table 2). Among Korean men, time trends in socioeconomic inequalities in smoking prevalence by education and income levels were generally stable during 2001–2014. In contrast, a significantly increasing trend in socioeconomic inequalities with regard to smoking prevalence was noted among women (table 2).
Age-adjusted OR and 95% CI and RII in smoking by SES from 2001 to 2014
Obesity
We found significantly increased trends in the mean BMI (23.9 kg/m2 in 2001 and 24.6 kg/m2 in 2014, p<0.001) and the age-adjusted prevalence of obesity (34% for 2001 and 41% for 2014, p=0.038) over time in men (table 1). In contrast, women showed decreasing trends in mean BMI and the age-adjusted prevalence of obesity (23.4 kg/m2 in 2001 and 23.1 kg/m2 in 2014, p=0.018, 31% in 2001 and 24% in 2014, p=0.036; table 1). Time trends in socioeconomic inequalities in obesity were stable among men; however, a time trend towards increasing inequality in obesity by income was noted in women (1.72, 1.19 to 2.48 in 2001; 2.69, 2.02 to 3.59 in 2014, p=0.03, RII, 95% CI, respectively; table 3).
Age-adjusted OR, 95% CI and RII in obesity by SES from 2001 to 2014
Diabetes
The age-adjusted prevalence of diabetes did not change significantly over time in either gender (table 1). Although no significant time trend in socioeconomic inequality for diabetes prevalence was seen in men, significantly increasing inequality in diabetes prevalence was noticed in women, especially by income (0.76, 0.36 to 1.58 in 2001; 2.56, 1.55 to 4.22 in 2014, RII, 95% CI, p=0.01, respectively; table 4).
Age-adjusted OR, 95% CI and RII in diabetes by SES from 2005 to 2014
Hypertension
The age-adjusted prevalence of hypertension did not change significantly over time among men (table 1). However, the age-adjusted prevalence of hypertension was decreased over time among women. There were also gender differences in the time trend with regard to socioeconomic inequalities in hypertension (table 5). In men, socioeconomic differences decreased with income over the past 14 years (1.64, 1.09 to 2.49 in 2001; 0.99, 0.71 to 1.39 in 2014, RII, 95% CI, p=0.04), whereas inequalities were increased with marginal significance among women during the same period (1.48, 0.89 to 2.46 in 2001; 2.91, 1.98 to 4.29 in 2014, RII, 95% CI, p=0.06, by education; 1.22, 0.73 to 2.04 in 2001; 2.32, 1.63 to 3.30 in 2014, RII, 95% CI, p=0.056, by income, respectively; table 5).
Age-adjusted OR, 95% CI and RII of hypertension by SES from 2001 to 2014
Hypercholesterolaemia
The age-adjusted prevalence of hypercholesterolaemia among men increased with marginal statistical significance. The age-adjusted prevalence of hypercholesterolaemia among women increased over time (table 1). There was no significant association between SES and hypercholesterolaemia in either gender (table 6).
Age-adjusted OR, 95% CI and RII of hypercholesterolaemia by SES from 2005 to 2014
Discussion
The results of this study reflect gender differences in the relationships between major CVD risk factors and SES, and in the linear time trends in socioeconomic inequalities in major CVD risk factors among Koreans. Among men, no major CVD risk factor, except for smoking, showed significant associations with SES. Indeed, socioeconomic inequalities for major CVD risk factors were stable over time and inequality for hypertension decreased over the past 14 years. However, women with a lower SES had higher risks of smoking, obesity, diabetes and hypertension than did those with a higher SES. Increasing trends in socioeconomic inequalities in smoking, obesity and diabetes, especially measured by income, were noted in Korean women. In contrast to the other CVD risk factors, hypercholesterolaemia was not associated with socioeconomic inequalities in either gender.
Socioeconomic inequalities in CVD risk factors and disease-related mortality are well known in industrialised Western countries and are now being found in many developing countries as well.1 2 18 19 However, there has been relatively little research examining time trends in socioeconomic inequalities in these CVD risk factors.6–8 To our knowledge, this is the first report on trends in socioeconomic inequalities in major CVD risk factors in an Asian nation.
In this study, distinct gender differences in time trend for smoking prevalence were found between Korean men and women, which is consistent with trends in other Asian countries, such as China and Taiwan.20 21 Over the past 14 years, the smoking prevalence in men decreased, but that among women did not change significantly. Consistent with previous reports, our study showed that Koreans with a lower SES had higher smoking prevalence than those with a higher SES in both gender.22 23 However, our study further showed gender differences in the time trend of smoking inequality. Based on the RII trend, the trend in inequality was stable among men, but the socioeconomic gap among women widened. There has been significant progress with antismoking policies in Korea in recent years. In 1995, the Health Promotion Act was enacted and restricted smoking in public buildings and places. In 2004, a significant increase in taxation of tobacco products began.24 We suspected that these policies may have been effective among men in all socioeconomic groups, but they were ineffective for women with lower SES.
Over the past 14 years, the prevalence of obesity has increased in men, but it has decreased in women. Among men, SES was not associated with the prevalence of obesity; however, lower SES was associated with a higher prevalence of obesity in women, reflecting gender differences in attitudes towards body image in Korea.25 Gender difference affects different attitudes towards weight status. As society becomes more industrialised, women tend to have a more negative perception for obesity than men do. It may be attributed to the fact that the mass media encourage women to pursue skinnier image. Therefore, women are more likely to use resources to pursue a skinnier body than men, and tend to convert their health habits to a healthier orientation than men do.26 27
The prevalence of diabetes did not change in either gender during the study period. Our study found gender differences in association between SES and the prevalence of diabetes, which is consistent with previous studies that reported the influence of SES on the risk of diabetes was more pronounced in women than in men.19 28–30 To our knowledge, there is no previous study investigating time trends in socioeconomic inequalities for diabetes in Koreans. The inequality in diabetes among women, measured by income, increased during the past 14 years, which is consistent with previous studies in other countries.31 32 Although the reasons for the gender difference are unclear, there are a few possible reasons to relate lower SES and increased risk with diabetes, especially for women. First, socioeconomic inequalities may lead to difference in health-related behaviours, such as alcohol intake, smoking and exercise. Women with a lower SES are more at risk for excessive alcohol drinking, smoking at earlier age and becoming more inactive, resulting in higher prevalence of obesity.3 33 34 Second, women with a lower SES also had poorer access to healthcare services, such as the detection of diabetes and its associated risk factors and prevention of diabetes.35 Finally, women with a lower SES may have unhealthy eating habits, such as less intake of fruits and vegetables and more frequent intake of fast food.36
During the study period, the prevalence of hypertension did not change among men, but decreased among women. The pattern of associations between SES and risk of hypertension differed by gender, which is consistent with a previous study.37 The influence of low SES on hypertension was more prominent and socioeconomic inequalities widened with marginal statistical significance in women during the study period. In contrast, the socioeconomic inequality among men was decreased, although the reason for this alleviation of inequality was not clear. One possible explanation is that the marginally significant diminished inequality with respect to smoking in men during the study period may mitigate the inequality.
Trends in socioeconomic inequalities in obesity and diabetes among women increased by income level, but they were not significant when measured by education. Rapid social change has affected the meaning of education level; for example, the proportion of women who had an education level of college or above was 24% in KNHANES II (2001). However, it was ~40% in KNHANES VI (2013–2014). Thus, caution is needed in comparing education groups across time, especially in rapidly changing societies. Additionally, it may be better to divide education levels into equal parts to investigate health inequalities.26 38
Investigating the trend of RIIs was a commonly used method to assess relative measure of health inequality, but in some cases absolute and relative measure may diverge with respect to magnitude or the direction of change in health inequality.39 Therefore, we also examined the SIIs as absolute measures of inequalities for five major CVD risk factors, and found no difference in trends between relative and absolute inequalities (online supplementary tables 1–5). Two strengths of our study are that the study subjects were a nationally representative sample and that the time trends of the relationship between SES and five major CVD risk factors were examined using two SES measures (education level and household income). However, several limitations should also be noted. First, the study was cross-sectional in nature; thus, it was difficult to determine causal relationships between SES and CVD risk factors. Second, the KNHANES is a self-report survey and therefore prone to measurement error and recall bias as well as heterogeneity in self-reported health. Third, the steady decline in response rates in the KNHANES should not be overlooked, which could result in underestimating inequalities.40 Moreover, item responses were possibly associated with SES because there were significantly different SES distributions between item responders and non-responders for each of the risk factors (online supplementary tables 6–10), which may have resulted in underestimation. Fourth, the generalisability of our results to the whole Korean population is limited as our study included only individuals aged 25–64 years, and institutionalised older adults were excluded.11 Finally, we could not examine longer term trends in socioeconomic inequalities in CVD risk factors before 2001, because, following the authors’ judgement, the KNHANES I (1998) survey data were excluded due to lack of reliability.
Conclusions
This study found that the relationships between SES and major CVD risk factors (smoking, obesity, diabetes and hypertension) were more prominent in Korean women than men. Health inequalities, especially measured by income, for smoking, obesity and diabetes increased among Korean women over the past 14 years. Public policies should be implemented to prevent risk factors for CVD among Korean women with a lower SES.
References
Footnotes
Contributors (As co-first authors) YJK and JSL contributed equally to this study. (As co-corresponding authors) SGK and JL contributed equally to this study. YJK, SGK, JL and JSL developed the research questions and contributed to the development of the conceptual framework, and the interpretations of the results. YJK contributed to writing and submitting the manuscript. JSL performed the main analyses and critical revisions to the manuscript. JP provided theoretical support. DSC, DMK, K-HL and HYK assisted with writing the manuscript.
Funding JL’s research was supported by a grant from the College of Medicine, Korea University, Seoul, Republic of Korea (grant no K1616241).
Competing interests None declared.
Ethics approval All procedures and protocols of the study have been approved by the Institutional Review Board of the Korea Center for Disease Control and Prevention (KCDC) since 2007. Written informed consent regarding the survey and blood analysis has been obtained from all participants since 2001.
Provenance and peer review Not commissioned; externally peer reviewed.
Data sharing statement All relevant materials are provided in the manuscript. Data access for the KNHANES is available from.