Article Text

Abstract
Objective To study the magnitude and direction of city-level racial and ethnic differences in poverty and education to characterise health equity and social determinants of health in California cities.
Design We used data from the American Community Survey, United States Census Bureau, 2006–2010, and calculated differences in the prevalence of poverty and low educational attainment in adults by race/ethnicity and by census tracts within California cities. For race/ethnicity comparisons, when the referent group (p2) to calculate the difference (p1−p2) was the non-Hispanic White population (considered a historically advantaged group), a positive difference was considered a health inequity. Differences with a non-White reference group were considered health disparities.
Setting Cities of the State of California, USA.
Results Within-city differences in the prevalence of poverty and low educational attainment disfavoured Black and Latinos compared with Whites in over 78% of the cities. Compared with Whites, the median within-city poverty difference was 7.0% for Latinos and 6.2% for Blacks. For education, median within-city difference was 26.6% for Latinos compared with Whites. In a small, but not negligible proportion of cities, historically disadvantaged race/ethnicity groups had better social determinants of health outcomes than Whites. The median difference between the highest and lowest census tracts within cities was 14.3% for poverty and 15.7% for low educational attainment. Overall city poverty rate was weakly, but positively correlated with within-city racial/ethnic differences.
Conclusions Disparities and inequities are widespread in California. Local health departments can use these findings to partner with cities in their jurisdiction and design strategies to reduce racial, ethnic and geographic differences in economic and educational outcomes. These analytic methods could be used in an ongoing surveillance system to monitor these determinants of health.
- Epidemiology
- Public health
- Health policy
This is an Open Access article distributed in accordance with the Creative Commons Attribution Non Commercial (CC BY-NC 4.0) license, which permits others to distribute, remix, adapt, build upon this work non-commercially, and license their derivative works on different terms, provided the original work is properly cited and the use is non-commercial. See: http://creativecommons.org/licenses/by-nc/4.0/
Statistics from Altmetric.com
Strengths and limitations of this study
To our knowledge, this is the first comprehensive tabulation of pairwise within-city social determinants of health differences between major race/ethnic groups and neighbourhoods across California’s cities.
Most multilevel, place-based research examines individual and neighbourhood impacts, but often bypasses city as a ‘place’: racial and ethnic differences in health outcomes and their social determinants are widely reported in the USA at the national, state and county scale, with non-Hispanic White populations usually experiencing the best outcomes.
This article contributes to fill a geographic gap in current public health surveillance methods by documenting the glaring disparities in poverty and low educational attainment by race/ethnicity and neighbourhood that exist within nearly every California city.
This analysis provides both between and within city-level estimates that can be more effective for targeting interventions to where they are most needed.
As a univariate analysis, our findings have several limitations including lack of examination of other social determinants that could mediate the outcomes, time period of the study that coincides with high levels of economic instability during the Great Recession, 2007–2009, and use of aggregated data that mask the heterogeneity of subpopulations within the racial and ethnic groups studied.
Introduction
Differences in health outcomes or their determinants are widely reported between racial and ethnic groups in the USA at the national, state and county scale.1–3 Differences that are avoidable, unfair and rooted in historical social disadvantage are defined as health inequities. Differences with biological or other underlying causes are health disparities.4 County and city local health departments (LHDs) increasingly recognise their role in addressing the social determinants of health (SDOH) that underlie health inequities. LHDs are also reaching out to non-health sectors in their communities to impact the root causes of health inequities through ‘Health in All Policies’.5
Geographic analysis of SDOH is used to reveal health inequities, and prioritise public health interventions and target community engagement. While an increasing number of LHDs examine health inequities at small geographies, most rely on county level data that mask important differences within counties. The surveillance of SDOH at small geographies poses methodological challenges and opportunities for taking data to action. In assessing racial and ethnic inequities, non-Hispanic Whites are often considered the socially advantaged referent group. It has been posited that it is relatively rare for the most privileged group not to have the best outcome.4,p187
We explore racial, ethnic and geographic differences in poverty and low educational attainment. Poverty reduction, increasing educational attainment and the elimination of health disparities are national health goals of the USA6; these two SDOH may account for 18% of the national burden of mortality.7
We examined (1) the magnitude and direction of racial, ethnic and geographic differences in these SDOH within and between California cities; (2) the relationship between overall city disadvantage and SDOH disparities and inequities; and (3) possible actions that LHDs may consider based on surveillance findings produced with the research methods suggested in this study.
Methods
Data source
We used data from the American Community Survey (ACS),8 9 a continuous prevalence survey based on a probability sample of households throughout the USA. ACS publishes data in 5-year tabulations for cities and census tracts. We used ACS Selected Population Tables (2006–2010), which stratify the tabulations by mutually exclusive race and ethnicity categories: Hispanic or Latino, and non-Hispanic persons of the following races: White, Black, Asian, Native Hawaiian and Other Pacific Islander, Other, Multiple, and American Indian/Alaskan Native. For California, the ACS reported on 8057 census tracts, 480 incorporated cities and towns, and 1043 non-incorporated places (from here on towns and non-incorporated places will be referred to as cities). The prevalence of poverty and its SE were obtained from ACS Table DP03, and educational attainment in adults and its SE were obtained from Table DP02. The California Department of Public Health compiled these data (www.cdph.ca.gov/programs/pages/healthycommunityindicators.aspx).
ACS definition of poverty and educational attainment
The prevalence of poverty was defined as the 5-year annual average percentage of all individuals whose household income in the past 12 months was below the federal poverty level. Total household income was calculated from eight questions on the ACS-1 form about wages, self-employment, securities, rental property, retirement and disability payments, and public assistance. Households were classified as poor when total income of the householder’s family was below an income threshold, taking into account the size of the family, number of related children, and, for one-person and two-person families, age of householder.8 The prevalence of educational attainment less than high school was defined as the 5-year annual average percentage of adults aged 25 years or older whose maximum educational attainment was 0–11 years of grade school.
Between-city, within-city and neighbourhood-level racial and ethnic disparities and inequities and statistical methods
We calculated between-city, within-city and neighbourhood-level differences for combinations of White, Asian, Latino and Black subgroups.
Differences in the 5-year percentage of poverty or low educational attainment, p, were calculated between pairs of racial/ethnic groups, p1−p2. Differences have a positive or negative sign based on the referent group (p2). When the referent group, p2, was White, a positive difference represents a health inequity. Differences with a non-White reference group were considered health disparities. For cities with two or more census tracts, neighbourhood disparities were defined as the absolute difference of census tracts with the highest and lowest 5-year percentage.
Mean and medians of between-city and within-city differences and their SD were calculated. The between-city mean difference was defined as the difference of the mean prevalence of two specified race/ethnicity groups across all cities:
 ,
,
where i is the ith race/ethnicity group and j is the jth of NTotal cities of groupi, and k is the kth of N total cities of groupi+1.
The within-city mean difference was defined as:
 ,
,
where i is the ith race/ethnicity group and j is the jth of NTotal cities where data on both of the race/ethnicity pairs are available.
Within-city differences were plotted as cumulative frequency distributions of cities for each pairwise race/ethnicity comparison in order to assess the magnitude and direction of racial and ethnic inequities or disparities in cities across the state. For each city, Z-tests were carried out to determine whether the within-city difference was statistically significant. We followed the US Census Bureau guidelines for pooling SEs of per cents, which is the square root of the sum of the squares of the two individual SEs  . A p value of 0.10 was considered statistically significant. R software was used for the calculations.10
SDOH differences are often interpreted in the context of the range of their absolute values. For example, in some very poor cities, there may be no demonstrable differences between groups and ‘everyone is poor together’. In other cities, there is a small, but statistically significant difference between groups, but each group is relatively well off (eg, has a SDOH value far above the mean.) To contextualise a city’s disparities or inequities on a backdrop of high or low rate of poverty or educational attainment, we plotted the within-city disparities or inequities as a function of the between-city poverty rate (or educational attainment). Simple linear correlation (Pearson, r) assessed the strength of association.
Calculation of neighbourhood disparities
Census tract and city boundaries are not always congruent; therefore, for neighbourhood analyses, census tracts were associated with the city into which its centroid fell. We used ArcGIS V.10.3 (ESRI) to calculate and associate centroids with cities. In some cases, portions of census tracts outside of city limits were included in neighbourhood comparisons. This introduces some potential misclassification if the outlying portion of the census tract has different poverty or educational attainment. We also calculated the mean linear distance in miles between the centroids of the census tracts with the highest and lowest poverty and educational outcomes.
Exclusions
The ACS does not publish data for geographic areas with fewer than 50 respondents. Of 1523 cities, the number available for within-city pairwise comparisons varied by race/ethnicity subgroup: 221 cities had data for Black-Asian comparisons, 280 for Asian-White, 245 for Black-White, 364 for Latino-Asian, 252 for Latino-Black and 611 for Latino-White. We did not have sufficient data to carry out pairwise comparisons that included American Indian/Native Alaskans, Native Hawaiians and Other Pacific Islanders, Multiple races, and Other. Analyses of poverty at the census tract level excluded economically dependent populations in colleges, correctional facilities, and other group quarters and institutions. Two census tracts with a population less than 500 inhabitants were also excluded.
Association between within-city geographic disparities in educational attainment and poverty with within-city disparities in life expectancy at birth
To illustrate the association between SDOH and health outcomes within California cities, we calculated the correlation coefficient between census tract level life expectancy at birth (LEB) and the two social determinants. The LEB data for California census tracts are publicly available through the Health Disadvantage Index Project (http://phasocal.org/ca-hdi/). The census tracts with the highest and lowest educational attainment and those with the highest and lowest poverty rates were matched with their LEB. Within cities, the differences between minimum and maximum (min-max) SDOH and health outcomes, respectively, were calculated. Census tract differences in educational attainment and poverty were scaled so that positive differences indicated greater disparities. Census tract differences in LEB were scaled so that positive differences indicated increases in life expectancy, and conversely, negative differences indicated a lower life expectancy. The correlation coefficient between the differences (min-max) was calculated in R.
Results
Between-city and within-city racial and ethnic disparities and inequities
The poverty rate of Latinos (18.6%) and Blacks (17.4%) averaged over California cities was nearly twice that of Whites (9.2%) and Asians (9.5%) (table 1).
Between-city and within-city means and race/ethnicity specific pairwise differences in poverty rate and educational attainment, California, 2006–2010
The city average percentage of adults with low educational attainment was three to four times higher in Latinos compared with Whites, Asians or Blacks. The largest mean between-city educational inequity (30.9%) was between Latinos and Whites.
The distribution of within-city differences of race/ethnicity pairs is presented for poverty and low educational attainment (figure 1). In a large percentage of cities, Asians and Whites had better poverty outcomes than Latinos or Blacks (figure 1a). The largest inequities occurred between Blacks and Whites (8.5% mean difference) and Latinos and Whites (7.6%). In approximately 40% of cities, these differences were statistically significant. Latinos had better poverty outcomes than Asians or Whites in 26% and 18% of cities, respectively. Likewise, Blacks had better outcomes than Asians or Whites in approximately 20% of cities. The average differences in within-city poverty rates between Blacks and Latinos were small (0.3%), but there was considerable variation.

Distribution of within-city differences in (A) poverty rate and (B) low educational attainment for pairwise comparisons of California Whites, Blacks, Latinos and Asians, 2006–2010. *Considering Whites as a socially advantaged reference group, the differences that favour Whites are considered inequities. The legends show the per cent of cities in which the p2 race/ethnicity group has a better outcome and the per cent of cities in which the outcome is statistically significant (p<0.1). For instance, ‘Black-Asian (77%, 31%)’ indicates that 77% of the cities in which the comparison is possible have a better outcome for the Asian group and 31% of those cities have a significantly better outcome.
For low educational attainment (figure 1b), the largest mean difference was between Latinos and other groups (Latino-Whites, 26.2%; Latino-Blacks, 24.9%; Latino-Asians, 19.0%). Whites tended to have better outcomes than Asians or Blacks. Blacks tended to have better outcomes than Asians. Latinos had poorer outcomes than the other groups in almost all cities (94% or higher). An overwhelming majority of within-city differences between Latinos and other groups were statistically significant.
Online supplementary materials include maps of California cities depicting the race/ethnicity with the largest disparity for poverty or educational attainment.
Supplementary Material
Supplementary fileBetween-city and within-city racial and ethnicity correlations
Within-city racial/ethnic differences in poverty and overall city poverty rate (figure 2a) appear to be correlated for all race/ethnicity combinations with White or Asian referents, but exhibit considerable variability (scatter). Black and Latino inequities (White referents) tended to be larger at higher levels of overall poverty (r=0.37, p<0.01). A weaker association (r=0.20, p<0.01) was observed for Black or Latinos with Asian referents.
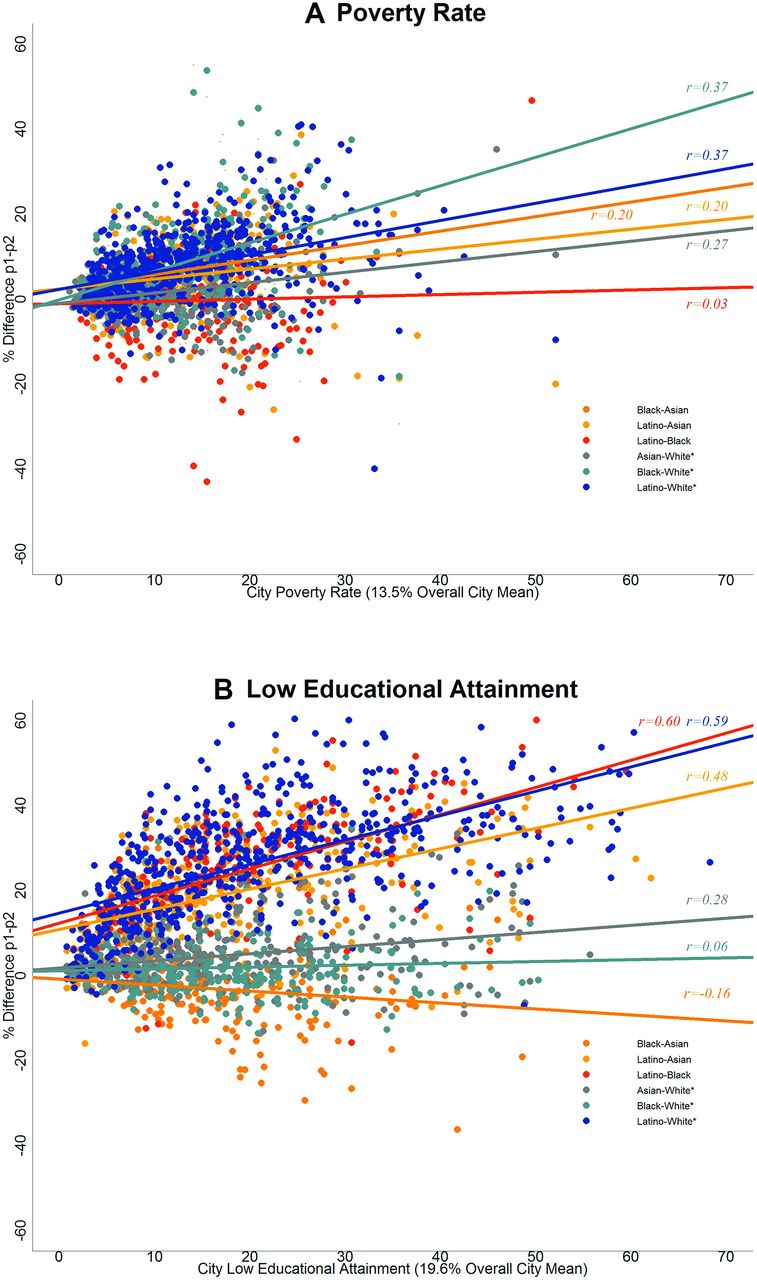
(A) Within-city poverty rate differences and overall city poverty rate and (B) low educational attainment and overall city low educational attainment, California cities, 2006–2010. r is the Pearson correlation coefficient between within-city differences and the overall city value. *Considering Whites as a socially advantaged reference group, the differences that favour Whites are considered inequities.
In a large proportion of California cities, Latinos experience both large educational disparities and live in cities with low overall educational attainment. Within-city education differences between Latinos and other groups were strongly associated (r range: 0.48–0.60) with overall city low educational attainment (figure 2b).
Neighbourhood disparities
The distribution of within-city differences of poverty and educational attainment between the highest and lowest census tracts is presented in figure 3. The median difference was 14.3% for poverty and 15.7% for educational attainment. Disparities of 25% or greater were observed in 25% of cities for poverty and 33% of cities for educational attainment. In approximately 73% of 500 cities with two or more census tracts, the differences were statistically significant. For the 174 cities with 10 or more census tracts, 99% of differences were statistically significant. The median straight-line distance between the highest and lowest census tracts was 2.6 km (SD, 3.2) for poverty and 2.9 km (SD, 3.04) for educational attainment.

Distribution of within-city differences in the highest and lowest census tract rates for educational attainment and poverty, California, 2006–2010.
Within-city associations between disparities in LEB and disparities in the SDOH
Within cities, increasing disparities in educational attainment between census tracts with the highest and lowest levels were significantly correlated with increasing disparities in which life expectancy decreased (Pearson r=−0.24, p<0.001). A similar significant correlation was found for poverty disparities and life expectancy (Pearson r=−0.28). In simple linear regression analyses, 0.08 year of life expectancy was lost for each per cent of educational disparity and 0.05 year of life expectancy was lost for each per cent of poverty disparity.
Discussion
We found widespread racial, ethnic and geographic differences in educational attainment and poverty within California cities. Comparisons between Whites and Blacks and Whites and Latinos generally conformed to a health inequities model—that historically, socially disadvantaged groups had poorer outcomes than Whites. This was less frequent in comparisons between Asians and Whites. In a small, but not negligible proportion of cities, historically disadvantaged race/ethnicity groups had better SDOH outcomes than Whites. We found a correlation between a city’s underlying level of poverty (or educational attainment) and racial/ethnic disparities. Neighbourhood level differences within cities were also ubiquitous. On average, a mere 2.6 km separates a city’s census tracts with the highest and lowest poverty rates or educational attainment. An illustrative analysis showed that increases in within-city disparities in poverty and educational attainment are associated with reductions in life expectancy, providing support for the relevance of the identification, targeted intervention and monitoring of SDOH.
Strengths and limitations
To our knowledge, this is the first comprehensive tabulation of pairwise within-city SDOH differences between major race/ethnic groups and neighbourhoods across California cities.
As a univariate analysis, our findings have several limitations. Racial/ethnic differences may be related to other SDOHs which mediate the outcome. For example, recency of immigration profoundly influences poverty and educational attainment,11 and may explain, in part, the educational inequities we observed in Latinos and Whites. Moreover, SDOH are themselves interrelated. Conducting a multivariate analysis to establish the independence of racial/ethnic disparities4 is not feasible using pretabulated ACS tables. Other US Census Bureau products (Public Use Microdata Sample) and surveys may serve this purpose, but do not provide reliable estimates at small geographies.
For a small percentage of cities, socially disadvantaged groups had significantly better outcomes than Whites. Further research of these cities may reveal whether this finding is associated with community ‘resiliency’, confounded by other sociodemographic factors, or has another explanation.
We acknowledge that the race categories included in the analysis are composed of subpopulations whose poverty and educational attainment are heterogeneous (for instance, differences between Asian ethnic groups). Valuable information may have been lost by aggregation.
Differences in SDOH between geographic units such as census tracts may be disparities or inequities, depending on the history of social disadvantage. Long-standing patterns of racial discrimination and economic segregation within California cities12 undoubtedly underlie some of the differences that we labelled disparities.
Data suppression in the ACS impacts numerically small, geographically dispersed racial/ethnic populations, creating information bias towards areas with greater racial concentration or segregation. Small rural cities account for a disproportionate number of exclusions in our analysis. Nonetheless, depending on the race/ethnicity comparison, the cities included in our analysis contain between 68% and 88% of the California population.
Cross-sectional data cannot be used to establish causal relationships or directionality. Our finding that a city’s poverty rate and its racial/ethnic disparities are interrelated will require longitudinal, confirmatory studies. Studies in the USA and western countries suggest that income inequality inhibits overall economic development and economic mobility.13
The time period of this study coincided with high levels of economic instability during the Great Recession, 2007–2009. Cities and regions might have since experienced economic recovery, gentrification, population displacement and community succession. Due to lags in reporting, ACS data may not reflect current conditions.
What can cities do?
While cities alone cannot be expected to solve economic and educational disparities, they play an important role in shaping the SDOH through people-based and place-based strategies.14 In the USA, local government plays an active role in recruiting and retaining employers, establishing preferences for minority-owned businesses, adopting local first-hire policies and legislating minimum wages. School districts and boards exert local control over school policy and funding, whether the bulk of funds are from state or local taxes. Through local zoning, urban revitalisation and the creation of enterprise zones, local government shapes the built environment and the availability of resources for the basics of living (eg, food outlets, housing, jobs, transportation). Local housing authorities implement federal and state policies that influence the availability and placement of affordable housing. Several health impact assessments and health studies document the likely and actual health-promoting impacts of minimum wage ordinances15 16 and housing vouchers that relocate renters from neighbourhoods with concentrated poverty to those with low poverty.17 18 Many cities are examining their own internal policies and practices with regard to hiring, procurement and building capacity through authentic deep community engagement.
Local elected officials often comprise the governing bodies of regional associations of government, which make decisions on regional transportation, housing and economic investments. Economic development strategies forged at a regional level have a wide ranging impact at the local level.19 There is evidence that some strategies that promote overall regional economic development may exacerbate economic disparities.20
What can LHDs do?
Data and surveillance
In general, SDOH indicators have not been institutionalised in public health surveillance at the state and local level in the same manner as mortality surveillance, communicable disease reporting and behavioural risk factor surveillance. Monitoring SDOH geographic variation, time trends and population subgroups helps assess the magnitude of the problem, identify high-risk groups, monitor progress towards meeting goals, set priorities and target resources for intervention. Several US states have offices of health equity, which issue periodic reports.21 22 Due to requirements of the Affordable Care Act (ACA), LHDs in partnership with non-profit hospitals and community coalitions are producing community health needs assessments and improvement plans (US IRS Code Title IX, §6033(b)), frequently framing health disparities in terms of SDOH.23 24 ACA implementation supports the institutionalisation of surveillance of the SDOH at geographically resolved areas throughout the USA.
Health departments can also use the distribution of within-city inequities to identify specific cities that share socioeconomic and demographic similarities, but differ on health inequities. Fostering exchanges like learning collaboratives or intervention trials between peer cities may be but one mechanism to engage cities and identify successful strategies to reduce inequities.
Some LHDs are taking systematic approaches to link SDOH surveillance data to action in the form of how-to guides,25 internal capacity building, and setting explicit goals and activities to reduce disparities.26
Internal capacity building on racial and health equity
Efforts to examine and counter structural racism in health inequities are being integrated into public health practice by identifying upstream causes,22 27 and conducting assessments of organisational behaviour in health departments. Educational and action-oriented workshops, training and toolkits are increasingly part of public health workforce development, programme design, policy development and evaluation,28 29 and should touch areas relevant to public health department accreditation.
Health in All Policies
With the ascendance of Health in All Policies (HiAP),5 public health departments have opportunities to play an active and direct role in educating policy makers on the SDOH and health equity. Because different sectors may frame equity in profoundly different ways,30 public health practitioners can convene and constructively engage partners, including those central to economic development and education. HiAP-related actions include health impact assessments, advising and participating in cross-sector planning (eg, land use, transportation, food systems), and developing tools that non-health planners can use to quantify the health benefits or harms of various policies or programmes.28
Service environment
Overcoming fragmented social services delivery is highly desirable and underpins comprehensive models of service delivery that may have collective impact and address SDOHs.31 32 Building on city-level data of poverty and educational inequities, health departments can play a role in monitoring and evaluating the equitable access and distribution of services provided by the health department and other social service agencies.
Conclusions
Racial, ethnic and geographic disparities in poverty and educational attainment in adults are widespread within and between California cities. Given that public health practice is increasingly addressing root causes of disease, the identification, targeted intervention and surveillance of the SDOH may afford opportunities for engagement with neighbourhoods, cities and regional government to be an active partner in strategies that promote health and reduce poverty and low educational attainment.
Acknowledgments
The authors acknowledge the valuable review and comments by Dr Linda Rudolph and Brad Jacobsen.
References
Footnotes
Contributors DB and NM shared responsibilities in the design, analysis and write-up of this research.
Funding This research was self-sponsored by the authors and did not receive funding from a public, commercial or not-for-profit agency. The California Strategic Growth Council and The California Department of Public Health funded and created the datasets used in this analysis. The views expressed by the authors are their own and do not necessarily reflect those of employers or organizations with whom they have/had affiliations.
Competing interests None declared.
Provenance and peer review Not commissioned; externally peer reviewed.
Data sharing statement This study used publicly available data. Data sets usedin this analysis can be downloaded from: .