Article Text

Abstract
Objective Evidence on the impact of legislative changes on individual alcohol consumption is limited. Using an observational study design, we assessed trends in individual alcohol consumption of a Swiss adult population following the public policy changes that took place between 1993 and 2014, while considering individual characteristics and secular trends.
Design Cross-sectional study.
Setting Swiss general adult population.
Participants Data from 18 963 participants were collected between 1993 and 2014 (aged 18–75 years).
Outcome measures We used data from the ‘Bus Santé’ study, an annual health survey conducted in random samples of the adult population in the State of Geneva, Switzerland. Individual alcohol intake was assessed using a validated food frequency questionnaire. Individual characteristics including education were self-reported. 7 policy changes (6 about alcohol and 1 about tobacco) that occurred between 1993 and 2014 defined 6 different periods. We predicted alcohol intake using quantile regression with multivariate analysis for each period adjusting for participants' characteristics and tested significance periods. Sensitivity analysis was performed including drinkers only, the 10th centile of highest drinkers and smoker's status.
Results Between 1993 and 2014, participants' individual alcohol intake decreased from 7.1 to 5.4 g/day (24% reduction, p<0.001). Men decreased their alcohol intake by 34% compared with 22% for women (p<0.001). The decrease in alcohol intake remained significant when considering drinkers only (28% decrease, p<0.001) and the 10th centile highest drinkers (24% decrease, p<0.001). Consumption of all alcoholic beverages decreased between 1993 and 2014 except for the moderate consumption of beer, which increased. After adjustment for participants' characteristics and secular trends, no independent association between alcohol legislative changes and individual alcohol intake was found.
Conclusions Between 1993 and 2014, alcohol consumption decreased in the Swiss adult population independently of policy changes.
- alcohol
- individual alcohol consumption
- population based-study
- policy changes
- trends
- Switzerland
This is an Open Access article distributed in accordance with the Creative Commons Attribution Non Commercial (CC BY-NC 4.0) license, which permits others to distribute, remix, adapt, build upon this work non-commercially, and license their derivative works on different terms, provided the original work is properly cited and the use is non-commercial. See: http://creativecommons.org/licenses/by-nc/4.0/
Statistics from Altmetric.com
Strengths and limitations of this study
The main strengths of the study are the very large sample of data used, the long study period, the use of the same validated food frequency questionnaire (FFQ), and a strict and repeated methodology with interviews to assess and complete individual self-reported alcohol consumption.
While the FFQ used in this study is the best possible option to assess dietary intake in the Swiss French-speaking population, data derived from FFQ suffers from limitations.
Individual alcohol consumption could have been underestimated because of social desirability bias.
We cannot exclude some residual confounding.
The present study does not include economic conditions affecting alcohol outcomes; including participants' income; intraperiod alcohol prices; and measures of outlet density and type.
Introduction
Alcohol misuse is an important determinant of health and a major contributor to the burden of disease worldwide.1 The WHO, the European Commission in 2006 and recently the Global Strategy in 2010 have tried to raise awareness on alcohol-related harm and lead countries to adopt strategies to reduce them.2
In Switzerland, in 2014, according to data from the Federal Office of Public Health (OFSP), almost one-quarter (23.2%) of the population aged over 15 years has had a hazardous alcohol consumption in the past 12 months.3 Hazardous alcohol consumption was defined as either chronic excessive (more than 20 g per day for women and more than 40 g per day for men) or binge drinking (more than four standard drinks for women and five for men in a short time4).
With regard to alcohol use regulations, Switzerland has a long history of efforts to regulate alcohol production, sale and use, at the cantonal and federal levels.5 In July 1999, a Swiss reform on taxation on spirits came into effect, in accordance to the World Trade Organization agreement on the elimination of discriminating duties on foreign spirits. A uniform tax rate was established, leading to a reduction of 30–50% of the price of imported spirits in Switzerland and an increase in alcohol consumption.6 One year later, on 9 June 2000, a cantonal law limiting alcohol and tobacco advertisement was established in the State of Geneva.7 On 1 February 2004, the Federal Council abolished the uniform tax rate and implemented a 300% tax on alcopops (mix of distilled alcohol, malt beverage and wine cooler) which are very attractive beverages for the younger population, due to their taste and appearance. The aim was to limit their availability and protect the younger generation.8 On the 1 January 2005, a federal policy lowered the legal alcohol blood limit to drive to <0.5 g/1000 mL.9 Immediately following this law, a 14.0% decrease in alcohol-related traffic accidents was observed.10 Also, 1-month later, in Geneva, a new policy restricted the sale of alcohol (limited from 7:00 to 19:00 and only in certain retail outlets11).
Worldwide, several studies reviewed the evidence for the effectiveness of policies to reduce the harm caused by alcohol.12 ,13 Other reports examined how changes in legislation affect individual alcohol consumption including in Switzerland. For example, Nelson and McNall,14 in addition to illustrating the general decline in alcohol consumption after 2000 in Switzerland, identified five studies6 ,15–18 that explored policy effects on alcohol consumption in Switzerland. The overall effects of policy changes were estimated to be unclear and to depend on context and culture.14 ,18 Also, the number of different legislative changes either across countries or within a given country using comparable individual data is limited.
Moreover, individual characteristics such as gender, marital status, education, smoking and secular trends are often not considered. A Finnish study showed that the reduction in alcohol prices (after tax cuts in 2004) and the subsequent increase in consumption increased alcohol-related mortality in different age and socioeconomic groups, but especially in men aged 55–59 years. In the 30–59 years' age group, mortality increased mostly among the unemployed, early-age pensioners and those with low income, of low social class and low education.19 While not covering policy changes per se, Abel et al20 reported interesting social and regional variations in health status and health behaviour among young Swiss adults. They found that risk drinking (more than two units per day for young men and more than one unit per day for young women) was more widespread among males in the French rather than in the German-speaking region. In Geneva, one of the longest studies ever conducted in Europe showed a decrease in alcohol intake in both genders between 1993 and 2012.21 In 1993–1999, higher and lower educated men presented no difference in their alcohol consumption; conversely, higher educated women had a higher alcohol intake compared with women with a lower education but this difference was no longer significant in 2006–2012. In this study, trends in alcohol intake were reported but not related to the different changes in alcohol legislation.
The aim of our study was to evaluate trends in alcohol consumption in the adult population of Geneva following the public policy changes that took place between 1993 and 2014. We considered participants' characteristics (age, gender, marital and smoking status, education, energy intake, country of birth), environmental factors (alcohol legislation) and time trends that influenced individual drinking behaviour. Smoking ban may affect alcohol consumption.22 Of note, another important step forward in terms of promotion of health in Geneva was the implementation of a legislative smoking ban in public places in October 2009.23
Methods
Study design
We used data from the ‘Bus Santé’ study, a cross-sectional ongoing population-based study that collects information on chronic disease and lifestyle risk factors in Geneva, a State of 490 000 inhabitants, in Switzerland. The ‘Bus Santé’ is described elsewhere.24 Briefly, the study started in 1993 and ever since, each year, a representative sample of non-institutionalised men and women aged 34–75 years was recruited from 1993 to 2009, and aged 18–85 from 2010 to 2014. Eligible participants were identified with a standardised procedure using a residential list annually established by the local government. Random sampling in age-specific and sex-specific strata was made in order to be proportional to the corresponding frequencies in the population. A person who was not reached after three mailings and seven phone calls was replaced using the same selection protocol previously discussed, but individuals who were reached and refused to participate were not replaced. Included participants were not eligible for future recruitment and surveys. Participation rate ranged between 55% and 75%.21
Participants were asked to fill questionnaires at home and to participate to a physical examination in either a mobile unit (Bus Santé) or in two different stationary clinics.
Data collection
Between 1993 and 2014, approximately a thousand participants were randomly selected each year and contacted to answer a self-reported food frequency questionnaire (FFQ) developed and validated in the target population.25 Participants also completed a standardised questionnaire covering family status, self-reported education level, reproductive history, cardiovascular risk factors, age and physical activity. Smoking status was subdivided into never and former (more than 100 cigarettes smoked in the past), and current body weight and height were measured using standard procedures and body mass index (BMI; kg/m2) was calculated.26
Alcohol intake was assessed using the FFQ. For each alcoholic beverage (beer, wine, champagne, aperitif like martini or anisette and spirits like whisky, brandy or liqueur), consumption frequencies ranged from ‘less than once during the last 4 weeks to two or more times per day’. Participants were also asked to indicate the average serving size (smaller, equal or bigger) compared with the standard alcohol serving size, equal to 10 g of pure alcohol.24 We excluded participants who did not answer all the questions about alcohol and also those who gave incoherent answers. Data derived from this FFQ have been used by several large worldwide consortium (eg, Nutricode27) and published in high-impact journals.28 Of note, the same FFQ was used for the entire period of analysis (1993–2014).
Exclusion criteria
Participants with missing data, with extreme energy (<850 or >4000 kcal/day) or alcohol (>99th centile, >79.72 g/day) intake were excluded from the analysis as previously suggested.29
Ethics statement
The Bus Santé Geneva study complied with the Declaration of Helsinki. All participants had given written informed consent.
Statistical analysis
Statistical analyses were performed with the Stata V.13.1 for windows (Stata Corp, College Station, Texas, USA). The study period included six new legislations. However, given the very short time (1 month) between the implementation of the alcohol driving limit and the new schedule of off-premise sale, period 5 thus include two different laws (figure 1).
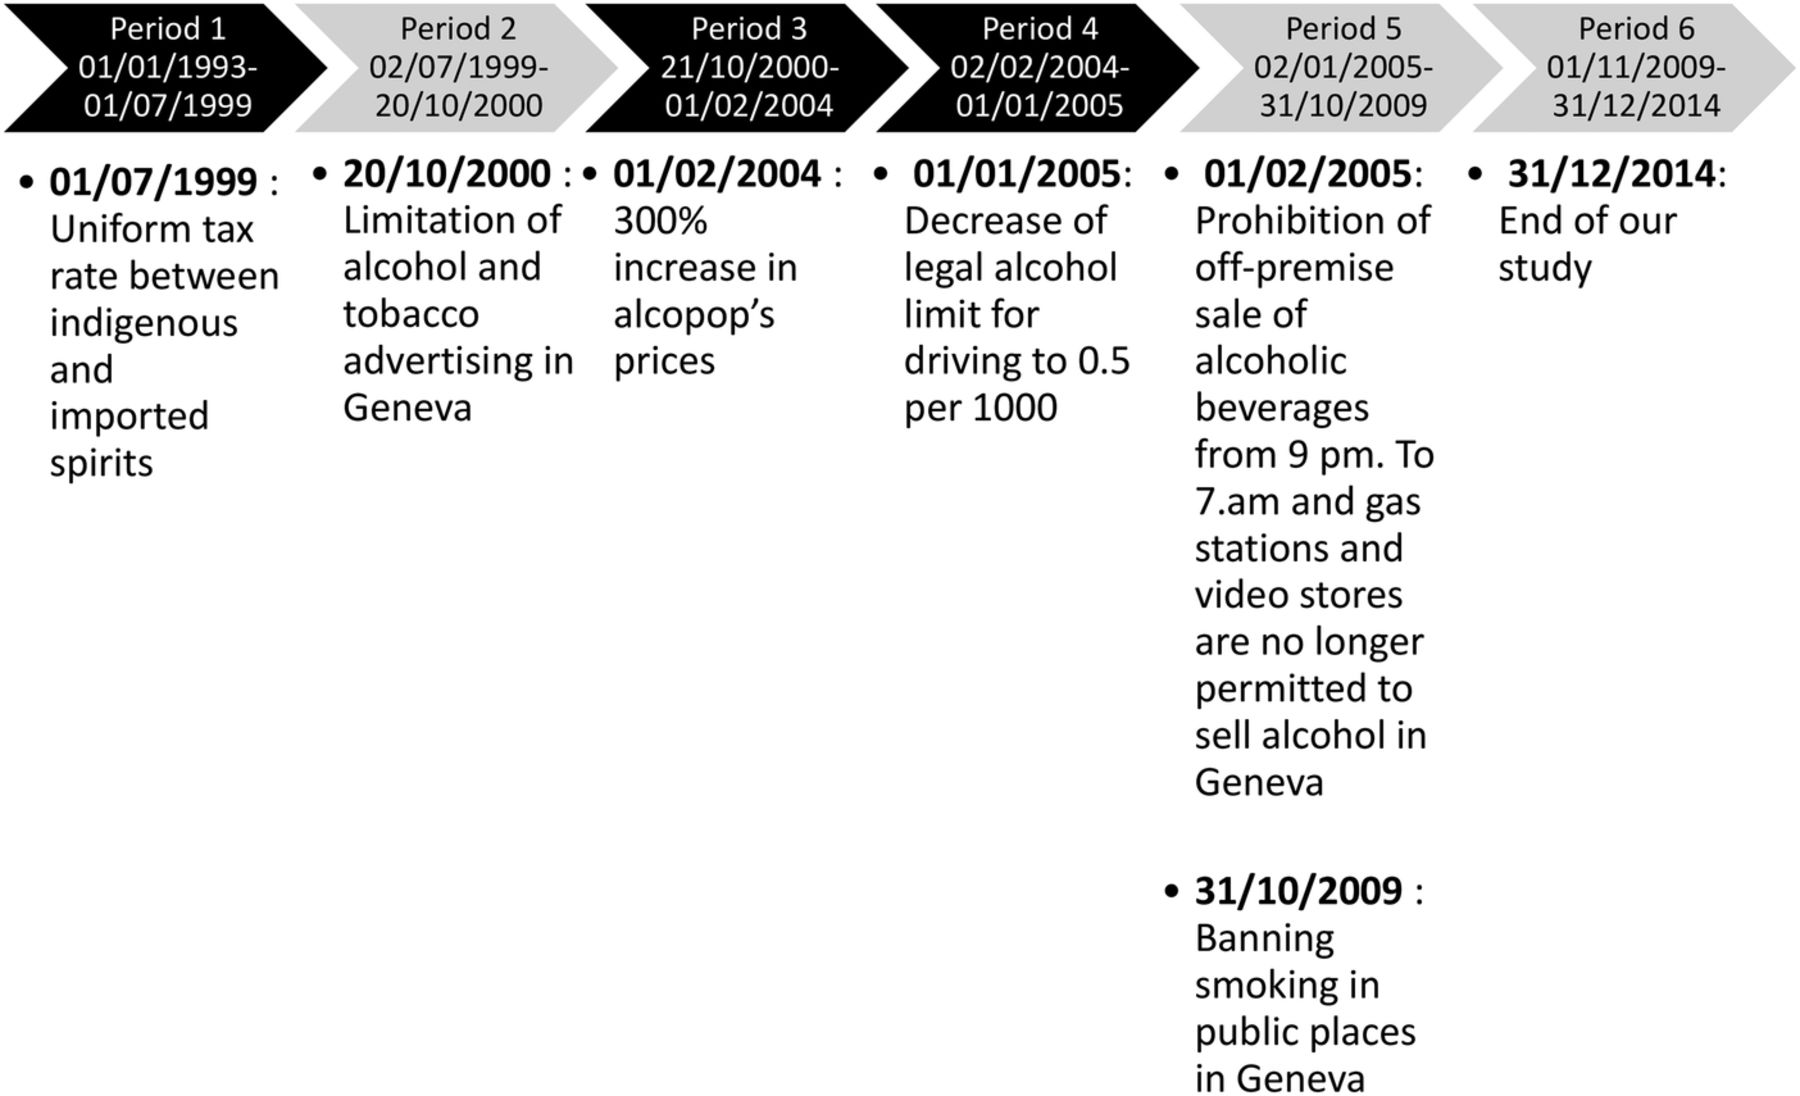
Study period divided in six periods according to policy changes between 1993 and 2014.
We summarised baseline participants' characteristics including age, gender, BMI, marital status, education, smoking status, country of birth and energy intake. All participants' alcohol consumption expressed in g/day was computed in median and IQR and stratified by their characteristics in each period's sample. The frequency of alcohol intake was classified similarly as in the FFQ (1–4 times a week and 1–2 times a day) and stratified into different types of alcoholic beverages (beer, wine and champagne, aperitifs and spirits) and expressed in percentage. To account for the survey year-specific age and gender structure, estimates and associations were weighted using the 2014 Geneva Census population. Weights were used to account for complex survey design and non-participating bias. Estimates and variances were calculated using design-based method procedures.30 To account for the potential secular trends of diseases that would be independent of the legislation periods, we included a linear time trend in the models. Using quantile regression (for which no survey procedures are implementable), we predicted alcohol intake with multivariate analysis for each period adjusting for participants' characteristics and tested statistical significance between periods. We further tested differences across periods adjusting for secular trends. Then, we reported the adjusted associations between policy modifications and median alcohol (g/day) intake of the participants using three different models: (1) adjusted for previous policy modification(s), if any; and (2) adjusted for age, gender, BMI, marital status, education, smoking status and country of birth, with a further adjustment for previous policy modification(s), if any; and (3) adjusted for secular trends with a further adjustment for age, gender, BMI, marital status, education, smoking status, country of birth and policy modification(s), if any. Furthermore, we stratified this analysis by smoking status as smoking was thought to possibly modify the associations, if any.
We conducted sensitivity analysis including drinkers only (to avoid an underestimation due to the proportion of abstinent participants) and the highest decile drinkers' alcohol consumption expressed in g/day. The latter analysis was motivated by results from previous reports6 ,15 suggesting different effects of Swiss alcohol policies on alcohol consumption among heavy drinkers. We reported adjusted association between policy modifications and median alcohol (g/day) intake of drinkers only using the three previous models as mentioned. Statistical significance was considered for a two-sided test with a p value <0.05.
Results
Descriptive data
Of the initial sample, 1666 participants (8.8%) were excluded; thus, data from 18 963 participants with a mean age 48.5 (SD 12.0) years (range 18–85 years) were analysed. Characteristics of all included participants over the five periods are presented in table 1.
Characteristics of the pa rticipants of the ‘Bus Santé’ study, Geneva, Switzerland, according to study period*
Trends in alcohol intake
Among all participants, 90.7% of women consumed alcohol <20 g/day and 89.6% of men consumed <40 g/day (ie, ‘high-risk’ use in women and men, respectively). When drinkers only were considered, 88.3% of women had an alcohol consumption <20 g/day and 88.5% of men <40 g/day. Trends in alcohol consumption between 1993 and 2014 according to gender, marital status, education, smoking status and country of birth are reported in table 2. Throughout all periods, participants' alcohol intake ranged from 7.1 to 5.4 g/day (24% reduction, p<0.001; figure 2). Men drank more than three times as much as women did, but decreased their alcohol intake by 34% compared with 22% for women. Married and cohabitating adults consumed more than divorced and single participants; the consumption of widowed participants showed no differences across periods. Participants with high education had a higher alcohol intake than participants with low education. Ex-smokers and current smokers drank more than twice as much as never-smokers, and ex-smokers had higher alcohol consumption than smokers. Participants born in Switzerland had higher alcohol consumption than those born abroad.
Alcohol (g/day) intake of the participants of the ‘Bus Santé’ study, Geneva, Switzerland, according to study period,* stratified by participants' characteristics

Trends in alcohol consumption among all participants, drinkers only and 10th highest drinkers between 1993 and 2014.
We observed similar results among drinkers only (see online supplementary table S1) and heaviest drinkers (see online supplementary table S2) with a decrease of, respectively, 28% and 24% (p<0.001; figure 2). Considering drinkers only, men decreased their alcohol intake by 30% and women by 23%. However, conversely to the previous results, an inverse relationship was found regarding education if drinkers only were considered. Participants with low education had a higher alcohol intake than participants highly educated.
supplementary tables
Table 3 shows the pattern of consumption of each type of alcoholic beverage. Wine appeared to be the beverage of choice among Geneva participants. Beer consumption from 1×/month to 1–2×/week was significantly higher in period 6 compared with period 1 and the proportion of beer abstainers decreased by 11.0% (p<0.001). There was a general decrease in wine consumption and an increase in abstinence throughout the periods except a slight increase in adults who drank wine 2–3 times a month. Regarding wine and champagne consumption, only 17–21% were totally abstinent compared with other alcohol beverages like beer, aperitifs and spirits for which about 50–70% were totally abstinent (p<0.001). Every type of aperitif consumption decreased between 1993 and 2014. Participants drinking spirits generally decreased from period 1 to 6, except two temporary increases in periods 3 and 6.
Weighted frequency of alcohol intake of the participants of the ‘Bus Santé’ study, Geneva, Switzerland, according to study period,* stratified by type of alcoholic beverage
In table 4, multivariable-adjusted alcohol intake of participants shows that consumption of every category (except for widowed participants due to a small sample) decreased in comparison to the first period. However, when we adjusted these results for secular trends, none was significant. Adjusted association between policy modifications and median alcohol (g/day), according to the period, shows only one significant result: a decrease (β coefficient −1.1, 95% CI (−1.9 to −0.3)) after the fifth policy modification (p<0.007). Models including individual characteristics and secular trends showed no significant associations (table 5). Similar findings were obtained when drinkers only were considered (see online supplementary table S3) and among heaviest drinkers also (data not shown).
Multivariable-adjusted alcohol (g/da y) intake of the participants o f the ‘Bus Santé’ study, Geneva, Switzerland, according to study period*
Multivariable-adjusted association between policy modifications and median alcohol (g/day) intake of the participants of the ‘Bus Santé’ study, Geneva, Switzerland
Among non-smokers, there was a significant decrease (β coefficient−1.0, 95% CI (−2.0 to −0.01)) after the second policy modification, for period 3 compared with period 1 (table 6). Online supplementary tables S4–S6 present quantile regression analyses for different models including models adjusted for secular trends only, models adjusted for covariates only, and models adjusted for both secular trends and covariates.
Multivariable-adjusted association between policy modifications and median alcohol (g/day) intake of the participants of the ‘Bus Santé’ study, Geneva, Switzerland, by smoking status
Of note, results were robust to statistical changes, including the use of sample weights.
Discussion
This repeated cross-sectional study investigated trends in alcohol consumption from 1993 to 2014 in the State of Geneva, Switzerland, after the implementation of seven different policies. While studies explored change in alcohol use, drinking patterns and alcohol-related harms following legislative changes, few studies considered individual data and participants' characteristics. To the best of our knowledge, this is the first study ever conducted in Switzerland assessing trends in individual alcohol intake following legislative changes in a very large representative population-based sample. Our results suggest that alcohol consumption decreased throughout the years and evolved in general very similarly in all groups. This decrease seems not to be a consequence of the changes in alcohol-related legislation but rather a phenomenon due to secular trends.
Trends in alcohol intake
In general, adults from the State of Geneva seemed to drink less than what the OFSP considered, at the time of the study, in its recommendations as a ‘high-risk chronic use’ (<20 g/day for women and <40 g/day for men) although acknowledging that we missed details on binge drinking.31
In Geneva, men drank overall more than women, a finding in agreement with the literature that is explained, at least partly, by cultural, neurological and neuroendocrine mechanisms.32 ,33 Married and cohabitating individuals decreased their alcohol consumption since 1993, but they still drank about 1 g more per day than adults living alone; this is consistent with the social aspect of alcohol.20 Participants with high education drank more than those with low education. Marques-Vidal et al21 previously showed higher alcohol consumption among highly educated women in Geneva. Income is thought to be positively associated with heavy drinking rates among women.33 Ex-smokers and current smokers had higher alcohol consumption compared with the other groups. Picone et al,22 using the data of the six waves of the Health and Retirement Study longitudinal survey in Michigan, observed a positive reinforcement effect of past cigarette consumption on current alcohol consumption.
Changes in alcohol distribution
Profile consumption of each type of alcohol between 1993 and 2014 were similar to the Swiss Alcohol Board 2014 report of alcohol sales between 2009 and 2012.34 Whereas the use of other types of alcohol decrease, beer consumption increased before and after period 4 corresponding to the time after the raise in alcopops taxes and the decrease in alcohol blood level limit for driving. This change in alcohol distribution can be an overall trend or a result of public policies. The increase in beer intake might be expected because of the increase in the price of alcopops (the beverages are economic substitutes), but the beneficial effect of the alcohol blood level law is harder to explain as discussed elsewhere.14 While acknowledging differences in the alcohol environment between Russia and Switzerland, it is interesting to note that Neufeld and Rehm35 outlined a similar phenomenon in Russia in years 2001–2010 after alcohol policies when beer consumption was reported more often than that of vodka or any other alcoholic beverage. No clear pattern in the use of spirits was found. Heavy consumption of spirits (2× or more per/day) remained unchanged throughout time suggesting that adults with this type of consumption might be already too dependent to be affected by prevention measures.
Impact of legislative changes on alcohol consumption
In general, the decrease in individual alcohol intake observed throughout the study period was not independently associated with policy changes after considering secular trends, which is in line with the international literature.36 Allamani et al18 reported that aggregate Swiss alcohol consumption was largely affected by secular trends and unaffected by Swiss policy changes. Moreover, Nelson and McNall14 reviewed the results from empirical studies of alcohol policy interventions in Denmark, Finland, Hong Kong, Sweden and Switzerland and found a lack of consistent results that could provide an evidence base for development of alcohol tax policies. In sensitivity analyses, we found different associations between policy changes and alcohol consumption among smokers and non-smokers. Indeed, non-smokers decreased their alcohol consumption in period 3 in comparison with periods 1 and 2 after the policy of alcohol and tobacco advertising limitation in Geneva in October 2000. But the association was only borderline significant. Some authors underlined the potential association between alcohol advertising and its consumption37 and others pointed out that greater public health benefits may be realised if legislative restrictions are applied to alcohol marketing instead of alcohol marketing self-regulation which is routinely not enforced.38 It is however worth noting that our results do not clearly support these views and that the general level of evidence on the beneficial effect of alcohol marketing is low.39 In Switzerland, Allamani et al18 explored this issue within the AMPHORA Project and found that the effect of alcohol advertising policy was uncertain. Conversely, we did not find yet an effect of the antismoking ban in Geneva in October 2009 on alcohol intake of ex-smokers and current smokers. The impact of smoking legislation on alcohol use is not clear and a slight correlation between alcohol and tobacco is described in the literature. Kasza and colleagues tried to demonstrate a link between alcohol and tobacco consumption by assessing the impact of smoke-free bar policies on the drinking behaviour of hazardous drinkers and heavy smokers. Smoking bans in public places did not appear to be associated with sizeable reductions in smokers' alcohol consumption in general, but might be associated with small consumption reductions among hazardous drinkers and heavy smokers.40
Strengths and limitations
This study presents several limitations. First, data are derived from FFQ, which suffers from limitations that we acknowledged elsewhere.21 Yet, this FFQ has been validated in the Geneva population and data derived from this FFQ have recently contributed to worldwide analyses from consortiums involving experts in nutrition.27 To the best of our knowledge, there is no validated FFQ assessing annual dietary intake in Switzerland, and it has been shown that FFQs assessing dietary intake for shorter periods than 1 year have the same validity as FFQs assessing annual dietary intake.37 Thus, the FFQ used in this study is the best possible option to assess dietary intake in the Swiss French-speaking population. We acknowledge that individual alcohol consumption could have been underestimated because of social desirability bias. Still, as the same FFQ was used throughout the study period, the magnitude of the bias might have remained constant, so trend would not be affected. Second, data on young adults (18–33 years) were only included in 2010. Moreover, our study only included adults between 18 and 85 years and it would be relevant to extend it to adolescents (15–18 years) who constitute a vulnerable group regarding alcohol use disorders especially with the risky single-occasion drinking during weekends (binge drinking41). Third, although we observed that trends in alcohol use are secular and seem independent of legislative measures, we cannot entirely exclude some residual confounding. Finally, the present study does not include economic conditions affecting alcohol outcomes, including participants' income; intraperiod alcohol prices; and measures of outlet density and type. The main strengths of the study are the very large sample of data used, the long study period, the use of the same validated FFQ, and a strict and repeated methodology with interviews to assess and complete individual self-reported alcohol consumption.
Conclusion
Between 1993 and 2014, overall alcohol consumption, including that of heavy drinkers, decreased in our sample of the Swiss adult population. Risk factors for higher alcohol consumption were identified. However, although numerous policies have been established, this decrease does not seem to be associated with policies but rather with secular trends. Since alcohol misuse is still a major health problem, supplementary public health measures should be considered. In the future, long-term data sets such as ‘Bus Santé’ are valuable tools for monitoring alcohol use trends and evaluating legislative policies based on large representative samples.
Acknowledgments
The authors would like to acknowledge the work of the ‘Bus Santé’ study collaborators and all involved stakeholders as well as the participants in the study.
References
Footnotes
Contributors SD wrote most of the article; BB and IG designed the study and wrote part of the article; IG performed the statistical analyses and had full access to data; J-MG and J-MT collected the data; TF-C and PM-V revised the article for important intellectual content. All authors have approved the final version of the article.
Funding The ‘Bus Santé’ study is funded by the University Hospitals of Geneva and the General Directorate of Health, Canton of Geneva, Switzerland.
Competing interests None declared.
Patient consent Obtained.
Ethics approval Institutional Ethics Committee of the University of Geneva.
Provenance and peer review Not commissioned; externally peer reviewed.
Data sharing statement No additional data are available.