Article Text

Abstract
Objectives The objective of this study was to longitudinally examine the geographic distribution of physicians in Japan with adjustment for healthcare demand according to changes in population age structure.
Methods We examined trends in the number of physicians per 100 000 population in Japan's secondary medical areas (SMAs) from 2000 to 2014. Healthcare demand was adjusted using health expenditure per capita. Trends in the Gini coefficient and the number of SMAs with a low physician supply were analysed. A subgroup analysis was also conducted where SMAs were divided into 4 groups according to urban–rural classification and initial physician supply.
Results The time-based changes in the Gini coefficient and the number of SMAs with a low physician supply indicated that the equity in physician distribution had worsened throughout the study period. The number of physicians per 100 000 population had seemingly increased in all groups, with increases of 22.9% and 34.5% in urban groups with higher and lower initial physician supply, respectively. However, after adjusting healthcare demand, physician supply decreased by 1.3% in the former group and increased by 3.5% in the latter group. Decreases were also observed in the rural groups, where the number of physicians decreased by 4.4% in the group with a higher initial physician supply and 7.6% in the group with a lower initial physician supply.
Conclusions Although the total number of physicians increased in Japan, demand-adjusted physician supply decreased in recent years in all areas except for urban areas with a lower initial physician supply. In addition, the equity of physician distribution had consistently deteriorated since 2000. The results indicate that failing to adjust healthcare demand will produce misleading results, and that there is a need for major reform of Japan's healthcare system to improve physician distribution.
- Japan
- Physicians
- geographic distribution
- sufficiency
- healthcare demand
- equity
This is an Open Access article distributed in accordance with the Creative Commons Attribution Non Commercial (CC BY-NC 4.0) license, which permits others to distribute, remix, adapt, build upon this work non-commercially, and license their derivative works on different terms, provided the original work is properly cited and the use is non-commercial. See: http://creativecommons.org/licenses/by-nc/4.0/
Statistics from Altmetric.com
Strengths and limitations of this study
This study longitudinally examines the geographic distribution of physicians in Japan with adjustment for healthcare demand according to changes in population age structure.
The use of medical health expenditure per capita for the adjustment of healthcare demand enabled a more accurate reflection of the degree of workload than medical consultation rates.
The primary limitation of this study is that it was a retrospective study and, as such, does not provide estimates on future physician supply and healthcare demand.
Although the adjustment methodology itself may have international applications, the adjustment coefficient values that we used must undergo further examination and modification before their application to other countries.
Introduction
The inequitable geographic distribution of physicians is a pressing issue in many countries.1–4 There are at least two reasons why this issue attracts social and political attention. The first reason comes from the issue of equity and social justice, that is, a citizen's right to access healthcare equally. The other is rooted in the belief in linkages between physician availability and health status.5
Studies that address this topic frequently use the number of physicians per population as an indicator of physician supply. However, this simple calculation may present an oversimplification of findings due to its reliance on simple head counts that ignore differences within a population.5 In particular, healthcare demand is likely to differ substantially among the age strata as elderly people tend to require more healthcare. Since many parts of the world are experiencing accelerated population ageing, it is becoming increasingly important to consider the differences in age-dependent healthcare demand when examining physician supply.
Population ageing has become a key policy issue throughout the world.6 Japan currently has the highest proportion of people aged 65 years or older, and became one of the first ‘super-aged’ societies when this proportion exceeded 21% in 2007.7 In addition, Japan's rate of population ageing is unprecedented: the proportion of people aged 65 years or older rose from 10% to 20% within 20 years. In contrast, the UK had almost 79 years and the USA almost 59 years to adapt to this shift in population age structure. Furthermore, Japan's proportion of elderly people is predicted to rise to 33.4% in 2035 and 39.9% in 2060,8 indicating that its population is still undergoing rapid changes.
In Japan, the issue concerning the number of physicians has shifted from a shortage to a surplus. Japan faced a shortage of physicians in the 1960s and 1970s.9 During that period, the country experienced a massive increase in population from 94 million to 117 million people. The government at that time aimed to ensure a minimum of 150 physicians for every 100 000 people, and doubled medical school enrolments in the 1970s to bolster physician supply. The target number of physicians was achieved in 1984, but has since continued to increase. Owing to the ageing and projected decrease in the Japanese population, the possible surplus of physicians is an issue that needs to be addressed. Although the government-sanctioned reduction in enrolments in medical schools has been proposed as a possible measure to control physician numbers, this measure is controversial and has been met with resistance from several interest groups.10 Detailed and accurate information on physician supply that accounts for age-dependent healthcare demand are needed to support this decision-making process.
Although previous studies have examined trends in physician geographic distribution using healthcare demand-adjusted populations,11 ,12 there is currently no standardised method for adjusting healthcare demand. Furthermore, the trends in physician supply in a super-aged society such as Japan have yet to be investigated. In this study, we conducted a longitudinal examination of the geographic distribution of physicians with adjustment for healthcare demand according to the changing age structure of the Japanese population.
Methods
Data sources
The number of physicians was obtained from the National Physician Census, which is conducted biennially by Japan's Ministry of Health, Labour and Welfare (MHLW). The census data included the type and location (municipality) of workplace for each physician. Population data were collected from the National Basic Resident Register, which is published annually by the Ministry of Internal Affairs and Communications. We collected data on national health expenditure per capita according to patient age in 2014 from the MHLW. Although national health expenditure includes various types of healthcare, we only used general treatment medical fees for our analysis because the other types of care were deemed to have little direct relevance to the number of physicians. Medical consultation rates were collected from the 2014 Patient Survey conducted by the MHLW. Population density was calculated by dividing the number of people residing in each secondary medical area (SMA, described below) by the area (km2). The area of each region was obtained from statistical reports on land areas of prefectures and municipalities by the Geospatial Information Authority of Japan.
Physicians and population
Practising physicians at all Japanese clinics and hospitals were included in analysis, whereas registered physicians working in non-clinician roles (eg, basic researchers or government officials) were excluded. Physician densities were calculated for both the raw (unadjusted) population and the healthcare demand-adjusted population; the former included all Japanese citizens and the latter included all Japanese citizens adjusted for age-dependent healthcare demand. The population was stratified into 5-year age groups, with the initial group comprising persons aged 0–4 years and the final group comprising persons aged 80 years or older.
Secondary medical areas
The SMA was used as the geographic unit of analysis. The Japanese government has designated medical service administration areas throughout the country, and these areas are categorised into primary, secondary and tertiary medical areas. Primary medical areas are set at the municipal level, and generally represent areas that are capable of providing basic primary care to residents. Tertiary medical areas are generally set at the prefectural level, and generally represent areas that are capable of providing the most advanced and specialised medical treatments. SMAs, which are between these two levels, supply and manage the majority of primary care and emergency medical services to regional communities. Therefore, SMAs are arguably the most important of the three geographic units with regard to implementing health policies. The geographic boundaries of the primary and tertiary medical areas are based on existing regional borders, whereas SMAs are demarcated by the prefectural governments based on healthcare provision capabilities. As a result, SMAs are directly relevant to the functional aspects of healthcare administration. Previous studies on physician geographic distribution in Japan have been conducted at the municipal level,9 ,13 although recent studies have also focused on SMAs.4 ,14 ,15 SMA boundaries can be modified by prefectural governments in response to changing healthcare requirements. In this study, we analysed the 349 designated SMAs in 2012.
Analysis of physician distribution
First, we calculated the healthcare demand-adjusted population using adjustment coefficients that were derived according to the health expenditure per capita for each age group. The health expenditure for each age group was divided by the overall mean health expenditure of the population, and the obtained quotients were used as age group-specific adjustment coefficients. We then applied the adjustment coefficients to the raw population to obtain the healthcare demand-adjusted population. The numbers of physicians per 100 000 population in the SMAs were calculated for the raw and demand-adjusted populations, and these values were used in the following analyses. In addition, we assessed the robustness of the adjustment coefficients by comparing them with alternative coefficients based on medical consultation rates instead of health expenditure, and also examined the annual changes in the adjustment coefficients by age group during the study period.
Next, we assessed the equity of the geographic distribution of physicians. The Gini coefficient was used as the indicator of equity, and has been widely used in similar analyses.2 ,4 ,16–18 This coefficient measures the degree of departure from a uniform distribution known as the Lorenz curve, and takes a value between 0 (indicating perfect equality) and 1 (indicating perfect inequality). The Lorenz curve for the SMAs was plotted based on the number of physicians per 100 000 population.
We then examined the time-based trends in the number of SMAs with a low physician supply. SMAs were categorised into quartiles according to the number of physicians per 100 000 raw population or 100 000 healthcare demand-adjusted population in 2000, and the SMAs in the first quartiles were specified as having a low physician supply. We examined the changes in the proportions of SMAs that fulfilled this criterion throughout the study period.
Finally, we divided SMAs into four groups according to two criteria: whether they were rural or urban, and whether they had a lower or higher initial physician supply at the start of the study period. Using an approach described in an earlier study,14 the degree of urbanisation was determined using the population density in 2000 as a proxy variable. We divided the SMAs according to the median value of the population density in 2000 to obtain two groups: SMAs with population densities above the median value were designated urban areas, whereas SMAs with population densities below the median value were designated rural areas. Similarly, the initial physician supply was calculated using the number of physicians per 100 000 population in 2000. We divided the SMAs according to the median values of the initial physician supply to obtain two groups: SMAs with initial physician densities above the median value were designated as having a higher initial physician supply, whereas SMAs with initial physician densities below the median value were designated as having a lower initial physician supply. On the basis of a combination of these two criteria, the SMAs were divided into four groups: Group 1 comprised urban SMAs with a higher initial physician supply, Group 2 comprised rural SMAs with a higher initial physician supply, Group 3 comprised rural areas with a lower initial physician supply and Group 4 comprised urban areas with a lower initial physician supply. The changes in physician numbers were compared among these groups. All analyses were performed using R statistical software (V.3.2.2).
Results
As shown in table 1, the adjustment coefficients for the age groups ranged from 0.22 (15–24 years) to 3.33 (80 years or older). The adjustment coefficient of the elderly population (65 years or older) was approximately four times that of the younger population (10–39 years). The results of robustness testing indicated that our adjustment coefficient was consistent with the results of the alternative coefficient based on medical consultation rates, with a high level of correlation (correlation coefficient: 0.99) between the primary adjustment coefficients and medical consultation rates by age group. Furthermore, our coefficient also appeared robust to time-based changes from 2000 to 2014 (data not shown).
Adjustment coefficients of healthcare demand by age group based on health expenditure per capita
Table 2 shows the temporal trends in the number of physicians and population from 2000 to 2014 at 2-year intervals. The number of physicians consistently increased by ∼6000–8000 every 2 years, and was 1.22 times higher in 2014 than in 2000. The raw population generally remained unchanged throughout the study period. In contrast, the healthcare demand-adjusted population was 1.23 times higher in 2014 than it was in 2000. Hence, the increase rate of the demand-adjusted population slightly exceeded the increase rate of physicians.
Trends in the absolute number of physicians and population in Japan
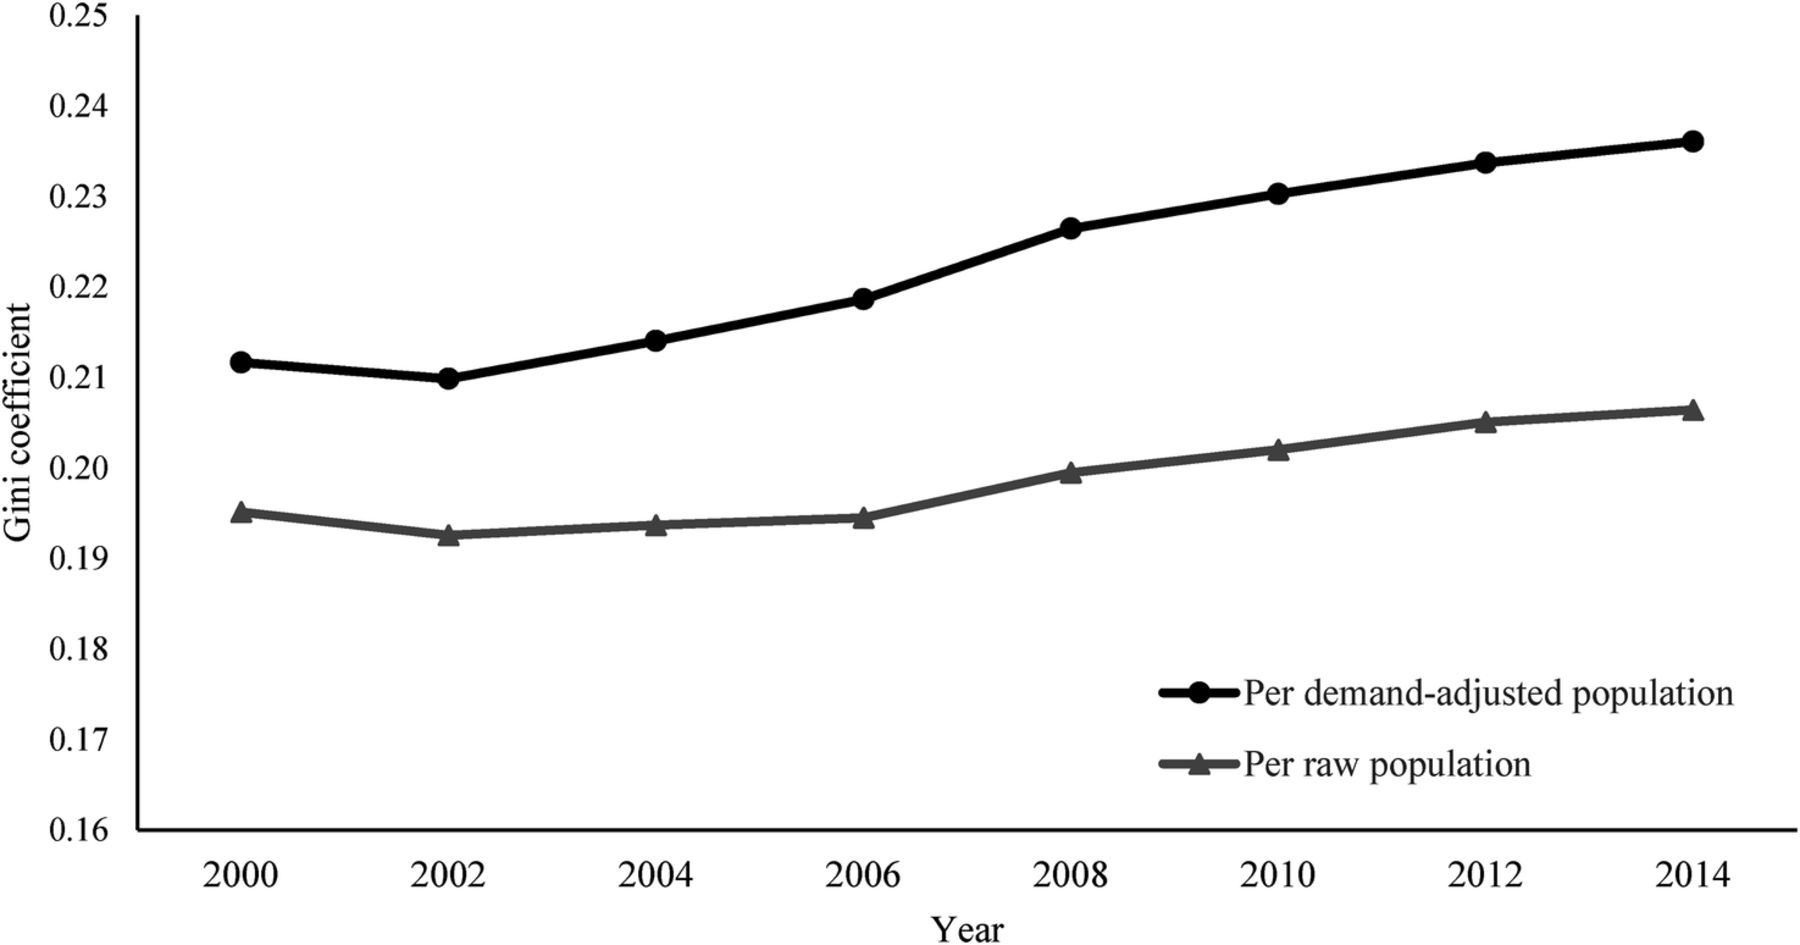
Tables 3 and 4 summarise the descriptive statistics for the 349 SMAs and the 4 groups, respectively. Table 3 shows that the mean number of physicians and demand-adjusted population had increased between 2000 and 2014. Figure 1 illustrates the temporal changes in the Gini coefficient for the number of physicians per 100 000 population (raw and demand-adjusted) at the SMA level, and indicates that the equity in physician numbers had worsened in both populations. In particular, equity had deteriorated more (a higher Gini coefficient) in the healthcare demand-adjusted population.
Descriptive statistics of the secondary medical areas (n=349)
Descriptive statistics of the four groups of secondary medical areas in 2000

Temporal changes in the Gini coefficients of the number of physicians per 100 000 population in secondary medical areas.
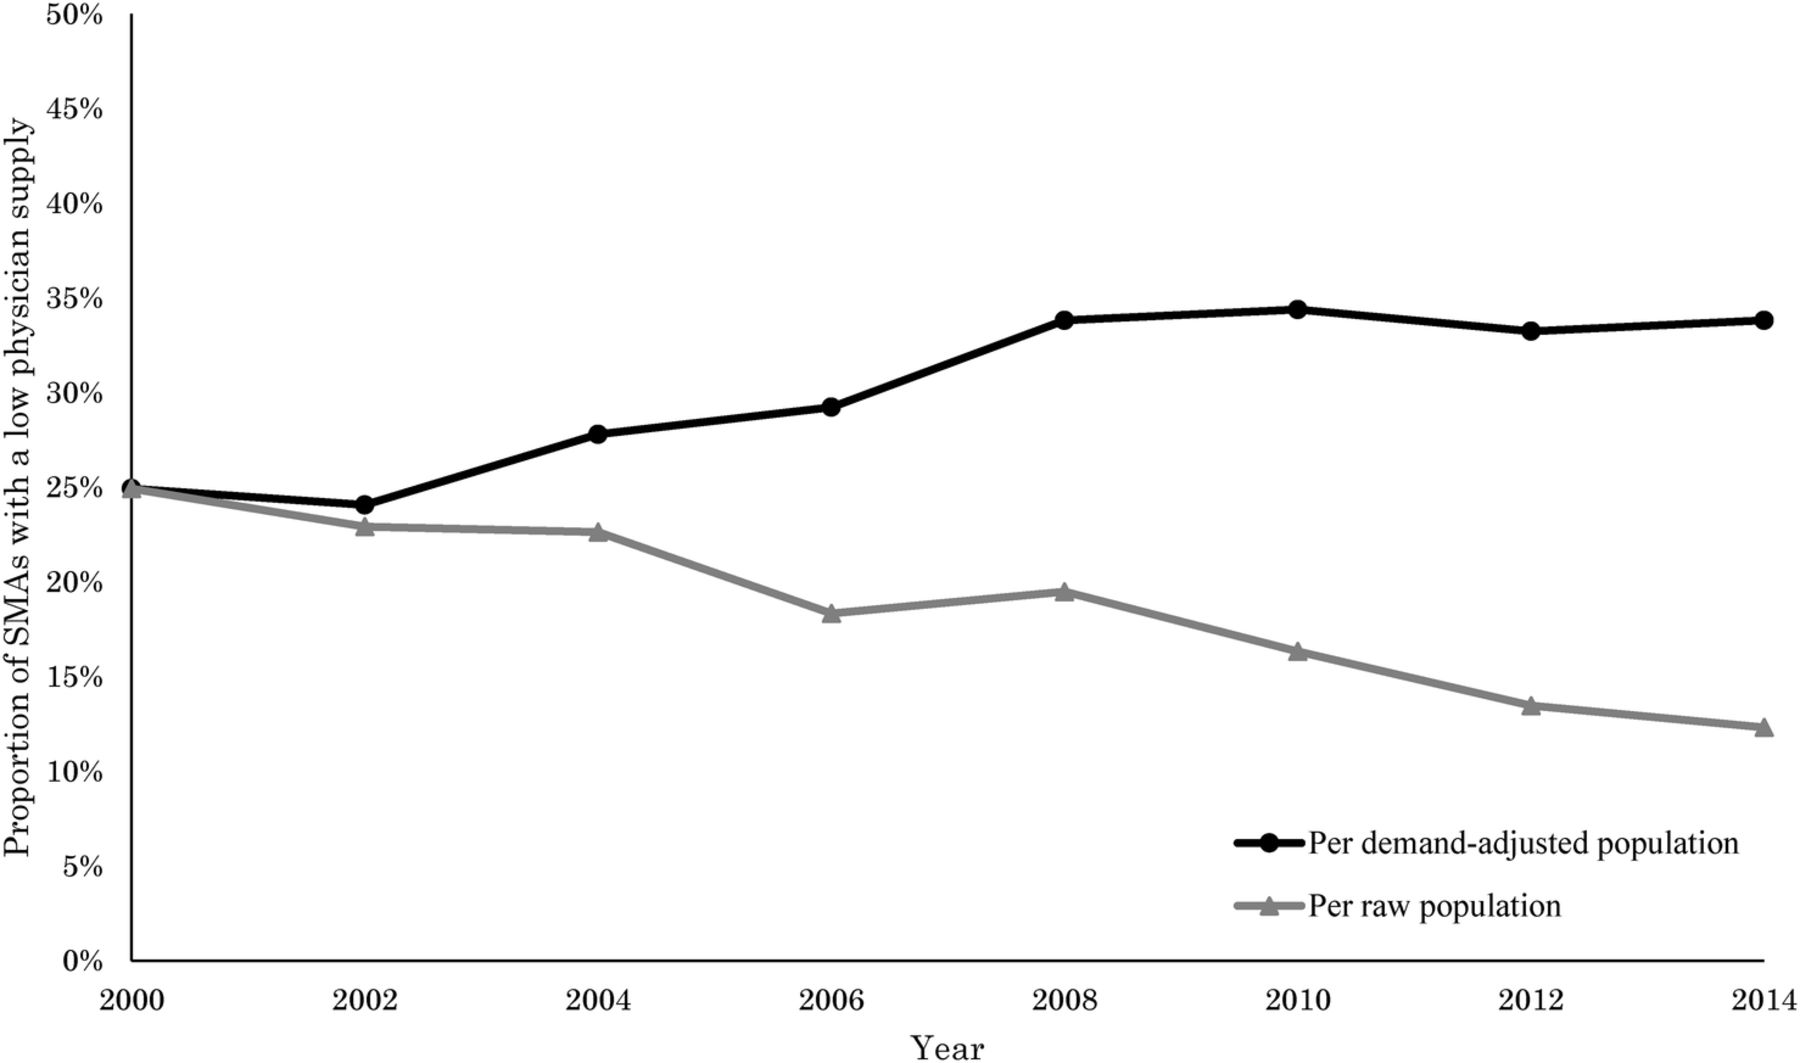
Figure 2 shows the changes in the proportion of SMAs with a low physician supply across the study period. In the raw population, the proportion consistently decreased from 24.9% to 13.2% (with a brief increase between 2006 and 2008). In contrast, the same proportion in the healthcare demand-adjusted population consistently increased from 24.9% to 35.0% (with a brief decrease between 2000 and 2002); notably, there was a relatively large increase of 4.5% between 2006 and 2008 in the demand-adjusted population.
Temporal changes in the proportion of secondary medical areas (SMAs) with a low physician supply. SMAs with a low physician supply were defined as those in the first quartile according to the number of physicians per 100 000 population in 2000; the y-axis shows the proportion of SMAs defined according to this criterion to all 349 SMAs.
Table 5 presents the changes in the absolute numbers of physicians and physicians per 100 000 population in Groups 1–4 between 2000 and 2014. There were 100 SMAs in Group 1, 75 SMAs in Group 2, 99 SMAs in Group 3 and 75 SMAs in Group 4. The absolute numbers of physicians showed considerable increases in Groups 1 and 4, whereas the increases were smaller in the other two groups. In the raw population, all groups (including the rural areas) exhibited increases in the number of physicians per 100 000 population. In contrast, the number of physicians per 100 000 healthcare demand-adjusted population was observed to decrease in all groups except Group 4.
Temporal changes in physician numbers for the four groups of secondary medical areas
Discussion
We conducted a longitudinal examination of the geographic distribution of physicians in Japan that accounted for changes in age-dependent healthcare demand in accordance with the changing age structure of the Japanese population. Our study produced two major findings: first, the equity in physician geographic distribution for the demand-adjusted population had worsened throughout the study period when analysing the time-based trends of the Gini coefficient and the number of SMAs with a low physician supply. Second, the number of physicians per 100 000 healthcare demand-adjusted population decreased in all types of areas except for urban areas with a lower initial physician supply.
Although the number of physicians per population has been widely used as an indicator of physician supply, it does not account for intrapopulation variations in healthcare demand. Healthcare demand differs among the age strata because elderly people tend to use more healthcare. Since Japan is undergoing unprecedented population ageing, changes in age structure and healthcare demand should be considered when examining the geographic distribution of physicians.
Notably, the changes in the number of physicians per raw population in each group were markedly different from the changes in the demand-adjusted population. The number of physicians per 100 000 raw population had seemingly increased in all types of areas, especially in the urban groups: there was an increase of 22.9% in Group 1 and 34.5% in Group 4. However, after adjusting healthcare demand, the number decreased by 1.3% in Group 1, and increased by 3.5% in Group 4. Furthermore, decreases were also observed in the rural groups, where the number decreased by 4.4% in Group 2 and by 7.6% in Group 3. The disparity in results indicates that it is necessary to adjust healthcare demand when analysing physician supply. Furthermore, this adjustment will become increasingly important in the future as the age structure of the Japanese population continues to change.
Despite the consistent nationwide increase in the absolute number of physicians, the equity of physician's distribution has not improved. It has been previously proposed that increasing the overall number of physicians may resolve uneven physician distribution as competitive forces play a major role in determining distribution patterns.19 ,20 However, studies in Japan have reported that increases in overall physician numbers have not been able to improve the regional disparity in physician supply.4 ,9 ,21 Similarly, our results indicate that this disparity has not been resolved in recent years. In fact, the problem appears to have worsened when physician supply was analysed in the healthcare demand-adjusted population. We surmise that equity in physician supply will continue to worsen without the prompt development and implementation of appropriate measures.
The number of SMAs with a low physician supply had appeared to decrease throughout the study period in the raw population, but adjusting for age-dependent healthcare demand revealed that these SMAs had actually increased. We posit that these conflicting results may be attributed to the higher increase rate of the demand-adjusted population relative to the increase rate of physicians. An earlier study found that physician supply had increased in SMAs with small populations due to the larger effects of reductions in population size.4 However, our study was able to detect reductions in the number of physicians in SMAs with similarly small populations when healthcare demand was adjusted. Although population numbers have been decreasing in rural areas, their demand for healthcare is growing due to the rising proportion of elderly persons.
Although physician supply had appeared to increase in Group 1 (urban SMAs with a higher initial physician supply), our study showed that the supply had actually decreased after healthcare demand was adjusted. This discovery is interesting in that it contradicts the convention that physician supply tends to increase in urban areas, and indicates that healthcare demand has rapidly increased in these regions. Many countries are experiencing population ageing; the OECD has reported an increase of 23.8% in elderly populations in urban areas from 2001 to 2011, whereas the increase was lower in rural areas at 18.2%.22 It is therefore evident that physician shortages are not limited to rural areas, and should also be actively addressed as an urban issue. On the other hand, our study also found that physician supply had increased in Group 4 (urban SMAs with a lower initial physician supply) after adjusting healthcare demand. Many SMAs in Group 4 are composed of suburban areas with large populations and relatively small numbers of physicians. Despite the increase in physician supply in Group 4, the number of physicians per 100 000 demand-adjusted population was almost half that of Group 1 in 2014.
Our findings are also important in the context of the study setting: Japan has gained worldwide attention as it addresses the challenges of a super-aged society.23 Although the adjustment methodology itself may have international applications, our results are not generalisable to other countries in their current form. Nevertheless, these results have substantial implications on the importance of demand adjustment on physician supply. Owing to the lengthy physician training periods and declining birth rate in Japan, it will be difficult to quickly increase the number of physicians if needed. We therefore propose that there is a need for major reform of the healthcare delivery system that does not rely on increasing physician numbers. Possible measures include establishing and enhancing the roles of medical teams to improve physician productivity or promoting the usage of information and communications technology, such as telemedicine.
Since 2007, the Japanese government has implemented several measures aimed at improving the geographic distribution and availability of physicians in rural areas. For example, all prefectures in Japan have established a regional medical support centre tasked with resolving the inequities in physician geographic distribution and incentivising the move of physicians to less urban areas. These centres usually provide banking services and career development support for young physicians working in areas with an insufficient physician supply. In addition, the government has expanded the ‘Chiikiwaku’ system, which sets regional quotas for medical school students and grants scholarships with stipulations on future rural practice. These efforts are fairly recent, and their effects on physician supply remain unclear.24
Several studies have previously attempted to account for healthcare demand through the use of variables such as patient age, sex and health status.11 ,12 ,25 In this study, we elected to use health expenditure per capita as the adjustment coefficient to represent healthcare demand. This indicator was chosen based on the assumption that expenditure per capita is reflective of the general workload of healthcare providers across regions and provider types.11 The Nuffield Trust—a charitable trust in the UK that also predicts future health expenditure—has reported a relationship between healthcare demand and health expenditure.26 In addition, Japan's healthcare system is characterised by universal health coverage, and hospital reimbursements for medical services are uniform throughout the nation.27 Hence, health expenditure provides a standardised indicator that reflects the vast majority of healthcare services (with the exception of cosmetic, advanced or experimental care not covered under insurance), and generally indicates the same workload regardless of where patients receive healthcare services. Furthermore, we consider that medical health expenditure per capita more accurately reflects the degree of workload than medical consultation rates because the former accounts for variations in patient health status.
These findings should be interpreted in the context of several limitations. First, this was a retrospective study and, as such, does not provide estimates on future physician supply and healthcare demand. Although future physician supply estimates are beyond the scope of this study, they should be addressed in future research. Second, it is possible that a small number of physicians who work in Japanese clinics and hospitals do not participate in the National Physician Census, which may introduce a degree of sampling bias. However, since all physicians in Japan are legally required to participate in the census, the number of non-participating physicians is likely to be too small to have a discernible effect on our results. Third, it is possible that individual health expenditure may not reflect the degree of physician workload. On the other hand, at a macro level, using health expenditure is better than medical consultation rates because the latter are unadjusted and therefore completely unweighted for physician workload. Fourth, SMAs may be divided into groups using various other criteria. In this study, we adopted a simple approach based on an earlier study,14 and were able to obtain distinctly different results among the groups. Fifth, the long-term generalisability of our adjustment coefficient may be susceptible to changes in population structure. However, our study showed that the coefficient remained essentially unchanged from 2000 to 2014, and it is not likely to undergo major changes in the near future. Finally, the adjustment coefficient in its current form cannot be applied to studies in other countries, but the adjustment method may have applications outside of Japan.
Conclusions
The number of physicians per 100 000 raw population had seemingly increased in urban and rural areas in Japan. After healthcare demand was adjusted, however, physician supply was observed to decrease in all types of areas except for urban areas with a lower initial physician supply. In addition, physician distribution had consistently become less equitable in recent years. These results indicate that failure to adjust healthcare demand will produce misleading results when examining physician supply, and that there is a need for major reform of Japan's healthcare system.
References
Footnotes
Contributors KH contributed to the study conception and design, data collection, analysis, interpretation and drafting of the manuscript. TO and SK contributed to the data collection and data management. YI contributed to the study design, data acquisition and interpretation. All authors critically revised the manuscript, and approved the final version.
Funding This work was supported in part by a Health Sciences Research Grant from the Ministry of Health, Labour and Welfare of Japan (Grant number: H27-iryo-ippan-001) and a Grant-in-Aid for Scientific Research from the Japan Society for the Promotion of Science (Grant number: [A]16H02634).
Competing interests None declared.
Ethics approval Ethics committee approval was waived for this study because all of the data are publicly available online and comprise only aggregate values without any personally identifiable information.
Provenance and peer review Not commissioned; externally peer reviewed.
Data sharing statement No additional data are available.