Article Text

Abstract
Objective Multiple sclerosis (MS) is a chronic, neurodegenerative autoimmune disorder affecting the central nervous system. Relapsing–remitting MS (RRMS) is the most common clinical form of MS and affects ∼85% of cases at onset. Highly active (HA) and rapidly evolving severe (RES) RRMS are 2 forms of RRMS amenable to disease-modifying therapies (DMT). This study explored the efficacy of fingolimod relative to other DMTs for the treatment of HA and RES RRMS.
Methods A systematic literature review (SLR) was conducted to identify published randomised controlled trials in HA and RES RRMS. Identified evidence was vetted, and a Bayesian network meta-analysis (NMA) was performed to evaluate the relative efficacy of fingolimod versus dimethyl fumarate (DMF) in HA RRMS and versus natalizumab in RES RRMS.
Results For HA RRMS, the SLR identified 2 studies with relevant patient subgroup data: 1 comparing fingolimod with placebo and the other comparing DMF with placebo. 3 studies were found for RES RRMS: 1 comparing fingolimod with placebo and 2 studies comparing natalizumab with placebo. NMA results in the HA population showed a favourable numerical trend of fingolimod versus DMF assessed for annualised relapse rate (ARR) and 3-month confirmed disability progression. For the RES population, the results identified an increase of ARR and 3-month confirmed disability progression for fingolimod versus natalizumab (not statistically significant). Sparse study data and the consequently high uncertainty around the estimates restricted our ability to demonstrate statistical significance in the studied subgroups.
Conclusions Data limitations are apparent when conducting an informative indirect comparison for the HA and RES RRMS subgroups as the subgroups analyses were retrospective analyses of studies powered to indicate differences across entire study populations. Comparisons across treatments in HA or RES RRMS will be associated with high levels of uncertainty until new data are collected for these subgroups.
- Fingolimod
- Natalizumab
- Dimethyl fumarate
- Network meta-analysis
- RRMS
This is an Open Access article distributed in accordance with the Creative Commons Attribution Non Commercial (CC BY-NC 4.0) license, which permits others to distribute, remix, adapt, build upon this work non-commercially, and license their derivative works on different terms, provided the original work is properly cited and the use is non-commercial. See: http://creativecommons.org/licenses/by-nc/4.0/
Statistics from Altmetric.com
Strengths and limitations of this study
Comprehensive and robust search strategy developed to identify all relevant interventions for the treatment of relapsing–remitting MS (RRMS).
Potential bias in the analyses since the baseline characteristics of the highly active (HA) and rapidly evolving severe (RES) subgroups could not be adequately evaluated in some studies.
Accordingly, studies were only synthesised if the patient populations used the same definitions for HA and RES RRMS, which limited the impact of potential imbalances on network meta-analysis results.
The limited evidence base prohibited adjustments for potential treatment effect modifiers.
Introduction
Multiple sclerosis (MS) is a disease of the central nervous system where myelin within the brain or spinal cord becomes inflamed and is then destroyed by the immune system.1 It can be classified into three subtypes: relapsing and remitting MS (RRMS), secondary progressive MS and primary progressive MS. RRMS is the most common clinical form of MS and accounts for ∼85% of cases at onset.2 In RRMS, people have distinct attacks of symptoms which then fade away either partially or completely. Symptoms may not all be experienced at the same time but can include visual disturbance, lack of balance and dizziness, chronic fatigue, bladder problems, pain, muscle weakness or spasticity and cognitive impairment.3
Although there is still no cure for MS, research has shown major improvements in MS treatment over the past 20 years and multiple disease modifying therapies (DMT) have become available since then, including interferon-β, glatiramer acetate, teriflunomide, dimethyl fumarate (DMF), natalizumab, fingolimod and alemtuzumab.1 ,4 Many of these treatments focus on early phases of the disease, while fewer treatment options are available for patients with highly active (HA) or rapidly evolving severe (RES) RRMS. Data on populations of patients with HA and RES RRMS are the subject of the analysis. At the time of this study, HA RRMS was defined in the fingolimod label as an unchanged or increased relapse rate or ongoing severe relapses compared with the previous year despite treatment with at least one DMT,5 and RES RRMS is defined as two or more disabling relapses in the past year, and one or more gadolinium-enhancing lesions on MRI or increase in the T2 lesion load compared with previous MRI.5
With the availability of different disease-modifying therapies, there is a need to understand the relative efficacy of the available treatments in patients with HA or RES RRMS. Definitions of these RRMS subpopulations were not derived from Phase III trials but from post hoc subgroup analyses of licensing studies. A number of systematic literature reviews (SLRs) and network meta-analyses (NMAs) have been published over recent years in RRMS;6–8 however, none of them specifically focused on the relative efficacy of treatment options in patients with HA or RES RRMS. There are no published studies with head-to-head comparisons between all licensed disease-modifying therapies in HA and RES RRMS. It is therefore important to assess whether it is possible to use data from existing published studies to draw meaningful comparisons between the efficacy of DMTs in the HA and RES populations, particularly from the perspective of Health Technology Appraisal (HTA) decision-making. The objectives of this study were to conduct a SLR and to assess the feasibility of conducting a Bayesian NMA to evaluate the relative efficacy and safety of DMTs in patients with HA or RES RRMS.
Methods
Data sources
A SLR following Preferred Reporting Items for Systematic Reviews and Meta-analyses (PRISMA) guidelines was performed using a prespecified protocol.9 A previous SLR was conducted in 2010 and this review was an update of that previous work, focusing on studies post-2010 (data on file). A predefined search strategy was devised using a combination of medical subject headings (MeSH), Emtree terms (in EMBASE) and free-text terms for prespecified interventions in RRMS (see online supplementary tables S1–S3). Searches were conducted in MEDLINE, EMBASE and the Cochrane Library on 14 November 2014 with no limits on language. Proceedings of scientific meetings (American Academy of Neurology, European Committee for Treatment and Research in Multiple Sclerosis) were searched for 2013 and 2014. In addition, the European Medicines Agency, US Food and Drug Administration and the ClinicalTrials.gov register were also searched.
supplementary tables
Selection of studies
The records title and abstract were screened by two independent reviewers following specific Population, Intervention(s), Comparator(s), Outcome(s) & Study Design (PICOS) study eligibility criteria (see online supplementary table S4). A third independent reviewer provided consensus when there was disagreement on the inclusion of the title/abstract of the record. In the cases where exclusion based on the titles/abstracts was not possible, the full text was retrieved and evaluated. The screening process was repeated for included full texts using the PICOS criteria for final study inclusion. Reasons for exclusion were noted in the screening file. The review was designed to capture randomised controlled trials (RCTs) in RRMS, regardless of disease activity, but studies not reporting in HA or RES RRMS were excluded during screening for the purpose of this NMA. Only treatments recommended for reimbursement in the UK for RRMS were of interest in the SLR, with a focus on the HA and RES subgroups. As a result, natalizumab was not deemed to be a comparator of interest in the HA RRMS population because it is not reimbursed for use in this indication within the National Health Service (NHS) in England.10 It should be noted that no restrictions were placed on the trial location of the included studies. Inclusion of studies in the NMA required the study to include an arm that could form a connection to one or more other studies in the network.
Data extraction and critical appraisal
Data extraction of studies included was performed by one reviewer and checked by a second reviewer. Information on study design, selection criteria, study population/patient characteristics and interventions was extracted into a data extraction form, followed by individual study treatment effects and associated uncertainty measures for the outcomes of interest. The methodological quality of the included studies was assessed with the National Institute for Health and Care Excellence (NICE) critical assessment checklist,11 as adapted from the Centres for Reviews and Dissemination (CRD) checklist for RCTs.12 The risk of bias in each individual study was evaluated based on the following items: adequate method of randomisation, adequate allocation concealment, similarity of groups, blinding, no unexpected imbalances in drop-out, no selective reporting and appropriate use of the intention-to-treat principle. The results of the critical appraisal of included studies are presented in online supplementary table S5.
NMA feasibility assessment
The feasibility assessment was performed in three steps: (1) the possibility of constructing a network of interlinked studies, (2) study design and patient characteristics that could modify the relative treatment effect were investigated, and (3) data availability per outcome of interest was assessed. The efficacy outcomes of interest were annualised relapse rate (ARR) at 12 and 24 months, ARR at any reported time point, difference in change from baseline EDSS score at 12 or 24 months, difference in change from baseline EDSS score at any time point, and HR of 3-month and 6-month confirmed disability progression. Disability progression was selected as one of the key outcomes in this study because it has driven the health economic modelling of RRMS since the first health economic model developed in 2003 by the School of Health and Related Research (ScHARR).13
To reduce the risk of bias in an NMA, only data from studies with similar study design and patient populations should be compared. Although some variation in study or patient characteristics across studies can be expected, an NMA is only valid when no imbalances exist across comparisons in the study of patient characteristics that can act as effect modifiers.14 To assess the feasibility of a valid NMA, the network of interlinked RCTs was analysed for differences in study design, patient characteristics and outcome definitions that could potentially bias the relative treatment effects.
The similarity of studies in the HA and RES RRMS populations was assessed, by evaluating the study design, patient population and outcome definitions of studies identified in the SLR.15
Statistical analysis
The relative efficacy of the identified interventions for the treatment of HA or RES RRMS for the selected outcomes was evaluated using a Bayesian NMA. In a Bayesian analysis, credible intervals (CrIs) are used instead of CIs. CrIs assume that the true value of the point estimate is within 95% of the range, whereas CIs assume that if the analysis was replicated 100 times, 95% of the CIs would include the true value of the parameter. Trial results were reported as trial-based summary measures, that is, 3-month and 6-month confirmed disability progression at 24 months was reported as HRs and ARR at 24 months were reported as risk ratios. In these cases, we assumed a normal distribution for the continuous measure of the treatment effect. The modelling is performed in the log scale. The outputs of the analyses are summary measures, that is, HRs and risk ratios of the treatment of interest versus the comparator. A value equal to 1 translates to no difference between the competing treatments and a value lower than 1 translates to greater efficacy (lower hazard and/or a lower risk of relapse).
Non-informative prior distributions were assumed for both outcomes. In the presence of non-informative priors, CrIs can be interpreted similarly to CIs using a frequentist approach. In addition, if the 95% CrIs do not include 1, results can be considered statistically significant when using non-informative priors. Prior distributions of the relative treatment effects were assumed to be normal, with 0 mean and a variance of 10 000, while a uniform distribution with support from 0 to 5 was used as prior of the between-study SD.
For each of the outcomes, fixed-effects and random-effects models were evaluated and the better fitting model was selected based on the deviance information criterion which adds a penalty term, equal to the number of effective parameters. The fixed-effects model assumes that there is no variation in the relative treatment effects across studies for a particular pairwise comparison. The observed differences for a particular comparison among study results are solely due to chance. The general fixed-effects model for NMA can be specified as follows: where μjb is the outcome for treatment b in study j, and dbk is the fixed effect of treatment k relative to treatment b.
The random-effects model assumes that the true relative effects are exchangeable across studies and can be described as a sample from a normal/Gaussian distribution whose mean is the pooled relative effect and SD reflects the heterogeneity. The model notation of the random-effects model is as follows: where δjbk are the trial-specific effects of treatment k relative to treatment b. These trial-specific effects are drawn from a random-effects distribution with the following properties:
  .16
.16
Given the small number of studies included in the analyses (one publication per direct comparison), the fixed-effects model was chosen over the random-effects model. The posterior densities for unknown parameters were estimated using Markov chain Monte Carlo (MCMC) simulations. The results presented here were based on 80 000 iterations on two chains, with a burn-in of 20 000 iterations. Convergence was assessed by visual inspection of trace plots. The accuracy of the posterior estimates was assessed using the Monte Carlo error for each parameter (Monte Carlo error <5% of the posterior SD). All models were implemented using OpenBUGS V.3.2.2 (MRC Biostatistics Unit, Cambridge, UK) and Rstudio (R V.3.1.2) and were based on the models defined by Dias et al.16
The Bayesian NMA provided joint posterior distributions of the relative treatment effects across interventions accompanied by pairwise probabilities of one treatment being better than another for each of the outcomes. These probabilities were calculated based on the proportion of MCMC cycles in which a specific treatment estimate was better than the comparator and can be interpreted as there is an x% probability that treatment A is better than treatment B. The ranking probabilities are summarised by a median and an associated 95% CrI. Additional ranking outcomes monitored are the probability of being best (Pbest) and SUCRA. The former is calculated as the proportion of MCMC cycles which a given treatment ranks first out of all competing interventions. The SUCRA measure was calculated as surface under the cumulative ranking curve (SUCRA); SUCRA is 1 when a treatment is certain to be the best and 0 when a treatment is certain to be the worst.
Results
Search and selection results
The searches identified a total of 5781 records, of which 1070 were removed as duplicates. The PRISMA diagram of the screening process is presented in figure 1. After merging with the previous SLR from 2010, 8 records were identified that reported data either for HA RRMS (N=4) and RES RRMS (N=3) or both separately (N=1). Different subgroup definitions were used across publications; therefore, all publications with patients with borderline HA or RES RRMS were thoroughly evaluated using patient characteristics and any other details in the publications.

Study identification flow diagram. HA, highly active; NMA, network meta-analysis; RES, rapidly evolving severe; RRMS, relapsing–remitting multiple sclerosis.
Three full-text publications, one conference abstract and the European Public Assessment Report (EPAR) for DMF were identified in the SLR that presented results for patients with HA RRMS.17–21 The other EPARs did not present subgroup data for HA RRMS. Except for CARE-MS-II, all studies presented post hoc subgroup analysis of an RCT or a clinical trial programme. It should be noted that Khatri et al17 do not explicitly specify that these patients were specified to have HA RRMS. The CARE-MS-II study included patients with at least two attacks in the previous 2 years of which there was at least one in the previous year, at least one relapse while on interferon-β or glatiramer after at least 6 months of treatment and an Expanded Disability Status Scale (EDSS) score of 5.0 or less.21 This population was deemed to be borderline HA RRMS, and it was decided to include this study in the SLR.
In addition, four publications were identified in the SLR for RES RRMS,19 ,22–25 supplemented by a non-published subgroup analysis in RES RRMS which was provided by the company.23 Note that one publication presented data for the HA and RES RRMS subgroups.19 Two publications were identified presenting post hoc subgroup analyses of the AFFIRM study in an HA RRMS publication.24 ,25 The inclusion criteria for the subgroup were, however, in line with the RES RRMS definition as presented earlier. Furthermore, Edan et al22 included patients with aggressive relapsing MS, defined as two or more relapses in the past 12 months or EDSS increases by two or more points (unconfirmed at 3 months but assessed outside a relapse) and one or more gadolinium-enhancing lesions on MRI. This population definition was deemed similar enough to RES RRMS to be included in the SLR.
Feasibility of NMA
Network availability
The first step in assessing the feasibility of an NMA is to examine the evidence base and to determine whether a network of studies can be constructed. Treatment arms should be classified under exclusive categories similar enough to group together in the NMA. Separate networks were constructed for HA RRMS and RES RRMS, linking studies to each other through common comparators.
In the HA RRMS network, fingolimod could be linked to DMF using placebo as the common comparator (figure 2). Both studies reported ARR and 3-month confirmed disability progression at 24 months. CARE-MS-II could not be linked to the network for lacking a common comparator,21 and TRANSFORMS could not be linked for measuring outcomes at 12 months instead of 24 months in the other studies.17 As a result, these studies could not be included in the NMA. Furthermore, Devonshire et al19 reported subgroup data of the FREEDOMS study, which was superseded by the results of Bergvall et al,20 who reported subgroup data for FREEDOMS and FREEDOMS II.

Feasible networks for (A) HA RRMS, (B) RES RRMS. BID, two times a day; DMF, dimethyl fumarate; EPAR, European Public Assessment Report; HA, highly active; IV, intravenous; RES, rapidly evolving severe; RRMS, relapsing–remitting multiple sclerosis.
For RES RRMS, fingolimod was linked to natalizumab through placebo as the common comparator (figure 2). Both studies reported ARR, 3-month confirmed disability progression and 6-month confirmed disability progression at 24 months. The study by Edan et al22 could not be connected to the network because it lacked a common comparator and reports results at 3 months instead of 24 months as reported in the other studies. As with the HA RRMS network, the publication by Devonshire et al19 reported subgroup data of the FREEDOMS study only and was superseded by the combined subgroup data of FREEDOMS and FREEDOMS II as provided by the company.23
Study and patient characteristics
The studies included were all post hoc subgroup analyses of double-blind, parallel-group, multicentre phase III RCTs. The subgroup analysis for natalizumab reported on one RCT (AFFIRM), whereas fingolimod and DMF were supported by pooled analysis of two studies (FREEDOMS/FREEDOMS II and DEFINE/CONFIRM, respectively).26–29 The studies were all conducted over a 24-month duration and the subgroup analyses were reported at the end of the study. The subgroup definitions were similar across studies with regard to treatment experience, relapses and MRI findings (table 1). Details on the critical appraisal of studies are presented in online supplementary table S5. Many items of the risk of bias assessment were not well reported and therefore the risk of bias of the included subgroup analyses is unclear. Owing to the small number of studies in each network, it was not possible to create funnel plots to assess publication bias.
Key study characteristics for all included studies in the NMA (only arms of interest)
Patient population characteristics were not always reported for the HA and RES RRMS subgroups (see online supplementary tables S6). The DMF EPAR did not report any patient characteristics of the subgroup with high disease activity, and the subgroup analysis of AFFIRM only reported the number of relapses in the year prior to study entry. Although no major differences are expected due to the similarity of subgroup definitions, the lack of reported patient characteristics made it difficult to assess the distribution of potential effect modifiers in the network.
NMA results
While limited networks could be constructed for HA and RES RRMS, the lack of reported patient characteristics made it difficult to assess the risk of bias in the post hoc subgroup analyses and to evaluate the distribution of effect modifiers. Nonetheless, the subgroup definitions were very similar in terms of the required number of relapses, MRI findings and treatment experiences. The subgroup definitions were discussed with a clinical expert to validate the inclusion of studies in each network. As a result, an NMA was deemed feasible but should be interpreted with caution due to the low number of studies and lack of reported baseline characteristics.
Given the geometry of both networks with a low number of studies and no closed loops (figure 2), it was not possible to evaluate whether direct and indirect evidence were in agreement in closed loops. The individual study results are presented in table 2.
Individual study results for all outcomes of interest in the NMA
HA RRMS
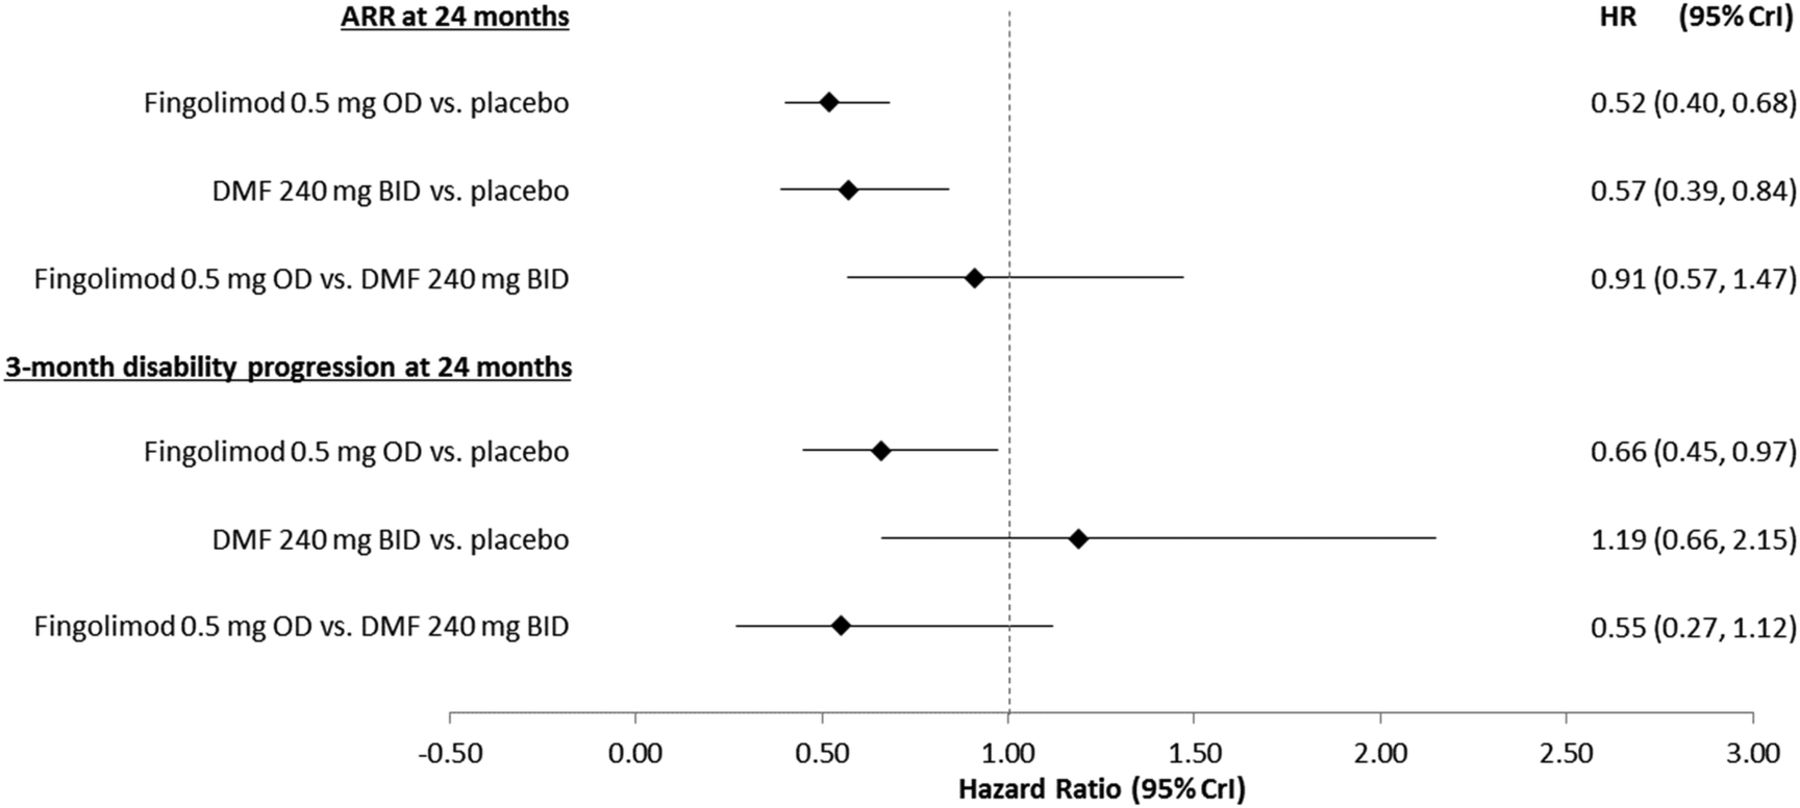
Both of the active treatments investigated were more efficacious than placebo and demonstrated lower ARR at 24 months (figure 3). The results demonstrated no statistically significant difference in ARR at 24 months between fingolimod 0.5 mg once daily and DMF 240 mg two times a day; mean rate ratio 0.91 (95% CrI 0.57, 1.47). Table 3 presents the median rank (and 95% CrI) and the Pbest and SUCRA values. Fingolimod 0.5 mg once daily has a 64.0% Pbest, followed by DMF 240 mg two times a day and placebo. The SUCRA values provided identical results regarding ranking, placing fingolimod 0.5 in first rank (82%) and DMF 240 mg two times a day in second rank (67.9%).
Estimated ranking of interventions according to different outcomes

NMA results for HA RRMS. ARR, annualised relapse rate; BID, two times a day; CrI, credible interval; DMF, dimethyl fumarate; HA, highly active; NMA, network meta-analysis; OD, once daily; RRMS, relapsing–remitting multiple sclerosis.
While fingolimod was able to demonstrate a statistically significant improvement in 3-month confirmed disability progression at 24 months over placebo, the difference between DMF and placebo was not statistically significant (figure 3). The HA subgroups were unable to demonstrate statistically significant differences in 3-month confirmed disability progression for the comparison of fingolimod and DMF. The estimated HR was found 0.55 (95% CrI 0.27, 1.12) in favour of fingolimod. Fingolimod 0.5 mg once daily showed a 94.0% Pbest and ranked first among DMF 240 mg two times a day and placebo in the analysis for 3-month confirmed disability progression, with a SUCRA of 96.7%.
RES RRMS
Both active treatments demonstrated a statistically significant improvement in ARR versus placebo at 24 months. No statistically significant difference was found for the comparison of fingolimod 0.5 mg once daily and natalizumab 300 mg regarding ARR at 24 months; the mean rate ratio was estimated to be 1.72 (95% CrI 0.84, 3.53). All pairwise treatment effects can be found in figure 4. There was a significant overlap between therapies with respect to the relative ranking and Pbest across treatments for this outcome.

NMA results for RES RRMS. ARR, annualised relapse rate; CrI, credible interval; NMA, network meta-analysis; RES, rapidly evolving severe; OD, once daily; RRMS, relapsing–remitting multiple sclerosis.
Similar findings were identified for 3-month confirmed disability progression at 24 months, where the comparison between fingolimod and natalizumab was not deemed statistically significant (figure 4). Similarly to ARRs, there is significant overlap in the CrI when ranking these therapies. SUCRA values were in accordance with the results of Pbest.
The pattern of results was identical for 6-month confirmed disability progression at 24 months showing no statistically significant difference between fingolimod 0.5 mg once daily and natalizumab 300 mg yet wider CrIs; HR of 1.86 (95% CrI 0.49, 7.12). Again, there were significant overlaps in the median rank CrI between therapies; however, SUCRA values were quite similar to the probabilities of being the best treatment for this outcome.
Discussion
Key findings and implications
In the absence of RCTs comparing all interventions of interest, an NMA is an alternative to obtain relative efficacy estimates. The evidence identified from the SLR and the feasibility analysis performed revealed the scarcity of available subgroup data in MS clinical trials, resulting in limited data to be synthesised in an NMA for the subgroups of interest (HA and RES). Despite the scarcity of data and the lack of information on patient and study design characteristics, small networks were constructed for each subgroup, providing analyses for the key outcomes of ARR at 24 months, 3-month confirmed disability progression at 24 months and 6-month confirmed disability progression at 24 months (only for the RES RRMS subgroup).
The NMA results regarding the HA subgroup demonstrated no statistically significant difference between fingolimod and DMF on ARR and disability progression; mean rate ratio of 0.91 (95% CrI 0.57, 1.47) and HR of 0.55 (95% CrI 0.21, 1.12), respectively.
For the RES subgroup, no statistically significant difference was found for the comparison of fingolimod with natalizumab for ARR and disability progression (3-month and 6-month confirmed); mean rate ratio of 1.72 (95% CrI 0.84, 3.52) and HR of 1.62 (95% CrI 0.51, 5.13) for 3-month confirmed disability progression and 1.86 (95% CrI 0.49, 7.12) for 6-month confirmed disability progression, respectively.
Given the limited evidence base, the results of the analyses should be interpreted with caution. It should also be noted that all included studies were post hoc subgroup analyses of large randomised trials, which were not powered to detect a statistically significant difference between interventions in the HA or RES RRMS subgroups.
Strengths and limitations
The first strength of this analysis was the comprehensive and robust search strategy which was developed to identify all relevant interventions for the treatment of RRMS. The evidence base was subsequently tailored to the HA and RES subgroups, causing potential bias to the analyses performed, since the baseline characteristics of the included studies could not be adequately evaluated. Therefore, a thorough assessment of the similarity of subgroup definitions was performed prior to the full analysis. Not all publications used the same definition of HA and RES RRMS; therefore, all studies with borderline HA or RES RRMS populations or subgroups were reviewed by a clinical expert. Studies were only synthesised in the NMA if the subgroup definitions were similar.
Although it is possible to adjust for potential treatment effect modifiers by performing meta-regression or sensitivity analysis excluding studies with differences in effect modifiers, the limited evidence base in the current analysis did not allow for such analyses. Furthermore, studies were only synthesised if the patient populations were similar, that is, using the same definitions for HA and RES RRMS. This limited the impact of potential imbalances on the results of the NMA. Although the studies were deemed similar enough to be synthesised in an NMA, residual confounding may still exist in the aggregated data. Although subgroup data have been considered in the evaluation of DMTs by the NICE Health Technology Assessment groups (eg, alemtuzumab30), these data are not publicly available, and could thus not be used in the NMA. However, the results of the NMA for the HA RRMS population were the same as those reported by the manufacturer in the 2014 Scottish Medicines Consortium (SMC) submission for fingolimod,31 indicating that new data for these subgroups have not been published recently.
Conclusion
The lack of data and resulting high level of uncertainty around the NMA estimates of comparative treatment effectiveness for patients with HA or RES RRMS provides a challenge to Health Technology Assessment groups appraising the evidence and for the strength of the recommendations in clinical guidelines.32 An NMA can offer point estimates for inclusion in economic models but these estimates will be associated with high levels of uncertainty which would be further compounded if considered as a basis for HTA decision-making. Until there is a major change in the available data for the treatments used in these indications, such as additional studies of the DMTs of interest in HA and RES RRMS, it will be difficult for HTA assessment groups to make reimbursement decisions on behalf of patients with HA and RES RRMS and the healthcare professionals who support them.
Acknowledgments
The authors thank Julien Gagnon and Amina Udechuku, also employees of Mapi, for helping with the submission process.
References
Footnotes
Contributors The study design and protocol were developed by ZF, JJ and MB in collaboration with FA and NA. ZF, JJ, MB, FA and NA collected the data and conducted the SLR. EH and KP performed the feasibility study and the network meta-analysis. The manuscript was written by EH, KP, JJ, MB and NA. All authors have been involved in reviewing the study outcomes and have approved the final version of the manuscript.
Funding The study and manuscript were funded by Novartis.
Competing interests FA and NA are employees of Novartis. EH, KP, ZF, JJ and MB are employees of Mapi, and served as paid consultants to Novartis to conduct the systematic literature review and preparation of this manuscript. All authors have been involved in the review of the systematic literature review, the model results and the manuscript.
Patient consent Obtained.
Provenance and peer review Not commissioned; externally peer reviewed.
Data sharing statement No additional data are available.