Article Text

Abstract
Objectives To clarify the relationship between social deprivation and age as two factors associated with emergency admissions to hospital.
Design Emergency admissions for 12 months were analysed for patients in the NHS NEW Devon CCG. Social deprivation was measured by the Index of Multiple Deprivation (IMD). Logistic regression models estimated the separate and combined effects of social deprivation and age on the risk of emergency admissions for people aged under and over 65.
Setting East Devon, UK—area of the NEW Devon CCG.
Population 765 861 patients in the CCG database.
Main outcome measure Emergency admission to any English hospital.
Results Age (p<0.001) and social deprivation (p<0.001) were significantly associated with emergency admission to hospital, but there was a significant interaction between age and social deprivation (p<0.001). From the third quintile of age upwards, age progressively overtakes deprivation and age has a dominant effect on emergency admissions over the age of 65. The effect of age was J-shaped in all deprivation groups, increasing exponentially after age 40. For patients under 65, age and social deprivation had similar risks for emergency admissions, the differences in risk between the top and bottom quintiles of IMD and age being ∼1.5 and 0.9 percentage points. In patients over 65, age had a much greater effect on the risk of admissions than social deprivation, the differences in risk between the top and bottom quintiles of IMD and age being ∼2.8 and 18.7 percentage points.
Conclusions Risk curves for all social groups have similar shapes, implying a common biological pattern for ageing in any social group. Over age 65, the biological effects of ageing outweigh the social effects of deprivation. Our model enables CCGs to anticipate and plan for emergency admissions to hospital. These findings provide a new logic for allocating resources to different populations.
- SOCIAL MEDICINE
- ACCIDENT & EMERGENCY MEDICINE
- GERIATRIC MEDICINE
This is an Open Access article distributed in accordance with the Creative Commons Attribution Non Commercial (CC BY-NC 4.0) license, which permits others to distribute, remix, adapt, build upon this work non-commercially, and license their derivative works on different terms, provided the original work is properly cited and the use is non-commercial. See: http://creativecommons.org/licenses/by-nc/4.0/
Statistics from Altmetric.com
Strengths and limitations of this study
The use of a well-defined all-age population.
The lack of recall and respondent bias.
The model examines age and deprivation in isolation of other potentially important factors such as lifestyle, morbidity and medications and so does not provide a useful risk prediction tool for individual patients.
The model does not account for repeated hospital admissions or the time at which an admission occurs.
Using postcodes for the application of the deprivation (IMD) quintiles to individuals means that a minority of individuals will experience a different level of deprivation in the overall postcode area score.
Background
Emergency admissions to hospital are a serious problem in developed countries worldwide, as are any readmissions which follow them. Emergency admissions have many negative features: they are worrying for elderly patients who face a high risk of death within 6 months,1 they stress general practices, community services and hospital services. They cost the paying agency (patient, insurance company or commissioning organisation) considerably, and in England, they are increasing in number. Finally, if the ‘post-hospital syndrome’2 is confirmed, then hospital admission itself becomes harmful.
Social deprivation
The relationship between social deprivation and illness has been repeatedly shown3 ,4 and summarised.5 Social deprivation has also long been associated with hospital admissions.6–8 In psychiatry,9 a non-linear relationship between social deprivation and psychiatric admissions to hospital has been reported. Social deprivation measured through social factors is significantly associated with morbidity, frailty10 and medical vulnerability,11 which are expressed through emergency admissions.
The Index of Multiple Deprivation (IMD) is a standardised, UK-wide, system of categorising areas by social deprivation. It was developed by the University of Oxford and is produced by the UK Department for Communities and Local Government.12 The system allows comparisons between areas and between all four nations within the UK.13 The index has seven domains of deprivation: income, employment, health and disability, education, crime, barriers to housing and services, and living-environment.
The UK Government distributed data from the UK IMD to every NHS commissioning group for each local area.12 The NEW Devon CCG obtained these data for small geographical areas. A ‘lower super output area’ is a group of postcodes consisting of between 400 and 1000 households.14
Age
In England as a whole, emergency admissions are rising15 and there is a public policy statement from the English Department of Health (2006) seeking to reduce them.16
It has been long known17 that the over 85s were the fastest growing subgroup in England and are predicted to double in number by 2030.18 This population group has high rates of hospital admission and age is a risk factor for emergency admission.19 An emergency admission rate of 420 admissions per thousand in the registered over-85 population has been reported in Scotland20 and in Devon.21
Sheikh and Alves22 investigated the effects of age and social deprivation on admissions to hospital for anaphylaxis in England and found that rurality and lack of deprivation, that is, affluence, and not age, were the most important factors. Cournane et al23 found, in a single hospital in Ireland, that although deprivation was positively correlated with admission incidence for elderly people, the rate at which this increased with increasing deprivation was less than predicted. Hippisley-Cox and Coupland24 include age and deprivation (Townsend score) in their QAdmissions model and show that both significantly affect emergency admissions.
What is not known is how these two risk factors (social deprivation and age) for emergency hospital admissions compare and inter-relate at all ages.
In the UK NHS, people register with a general practice of their choice and can change practices, but can only be registered with one practice at a time. The Northern, Eastern and Western Devon NHS Clinical Commissioning Group (NEW Devon CCG) is one of the largest of the 211 CCGs in England. It holds a list of registered patients, their ages, addresses and postcodes and can search this database of demographic information on the local NHS population. Devon has the fourth lowest use among counties in England of emergency bed days at 1.41 beds per person for its over-65 population.25
In the NHS in 2012/2013, information about admissions to every hospital in England was coordinated by the NHS Centre for Health and Social Information and was reported to each local NHS Commissioning Group. Thus, all hospital emergency admissions, including community hospitals and psychiatric admissions, anywhere in England for Devon residents, were reported to the NEW Devon CCG. This is the commissioning organisation, paying hospitals on average £1844 per emergency admission in 2013 (personal communication New Devon CCG, 2014).
Aims
Our aims were: (1) to examine the effect of social deprivation and age separately and combined on emergency hospital admissions; (2) to compare the effects of the two factors under and over the age of 65; and (3) to aid planning and resource allocation in the NHS.
Methods
Population
The study population was people of all ages registered with each of 104 (100%) general practices in the NEW Devon CCG. The NEW Devon CCG holds a computerised database for all these registered individuals which was searched by one of us (TC). The data are the property of NEW Devon CCG and were made available to the research team with strict anonymity, so no personally identifiable information was disclosed. Ethics approval was therefore not required. The population was 765 861 on 15 June 2012. In the South West of England, 98% of the population is registered with the NHS.26
The postcode address of each individual in the defined population was linked with the relevant IMD score using the 2010 iteration of the IMD. We noted the mean IMD score for our population and took the mean of all the lower super output areas in England12 ,14 as the national comparator.
Searches were all undertaken on patients registered with general practices who had an emergency admission to hospital during the 12-month period, 15 June 2012–14 June 2013. These dates were chosen as the NEW Devon CCG obtained a download from the central NHS on the 15th day of each month. Emergency admissions are defined according to the NHS definition and include any emergency activity including zero length of stay activity, but exclude maternity admissions which are classed as inpatient non-elective activity.
The population was classified by quintiles of age and national quintiles of IMD for England. Admission rates per thousand registered population were calculated for each subgroup.
Statistical methods
We built a mathematical model to explore the impact of social deprivation and age on risk of emergency admissions using a series of logistic regression models with age and deprivation represented by polynomial functions.
First, we examined the relationship between deprivation and probability of emergency admissions in isolation of other factors, by fitting an unadjusted logistic model.
Second, we considered the bivariate relationship between age and probability of emergency admissions by fitting a quadratic model, without adjustment for deprivation. In the age and deprivation models, the explanatory variables were first centred by subtraction of the sample means to reduce the possible effect of multicollinearity.27
Third, we examined the interaction between deprivation and age. To do this, we fitted a combined model in which IMD score rank was categorised into quintiles for our population and a quadratic function was specified for age. Differential effects of age by IMD rank quintile were assessed through the inclusion of appropriate interaction terms in the models. For each model, estimated probabilities of emergency admission were generated using the expit function and plotted graphically to illustrate the shapes of the relationships with age and/or deprivation.
To assess if age has a stronger effect than social deprivation in older patients, we fitted separate logistic models for patients aged under 65 and 65 or over. In each model, age and deprivation were categorised into quintiles specific to that age-specific subpopulation. Effect sizes for age and deprivation were calculated as the difference in probability of emergency admission between the top and bottom quintiles in each subpopulation.
We fitted models to males and females separately to assess the extent to which the observed age-related associations could be explained by gender imbalance at the oldest ages. We also estimated the relative effect sizes for age and social deprivation in males and females separately.
All statistical analyses were conducted using the R Statistical Software (Core Team. R: a language and environment for statistical computing. Vienna, Austria: R Foundation for Statistical Computing, 2013. URL http://www.R-project.org/). The choice of polynomial functions for age and deprivation was informed through generalised additive logit modelling (see online supplementary appendixA for details).
supplementary appendix
Results
The study population of 765 861 had 140 968 (18.4%) people under the age of 18, and 175 686 (22.9%) aged 65 or more, of whom 26 265 (3.4%) were aged 85 or more.
People left the study population through death and outward migration. The total number lost to follow-up were 32 453 (4.2%). For 0.3% of the population, postcodes and hence deprivation scores were not available.
The characteristics of the population classified into population quintiles of age and national (for England) quintiles of social deprivation, to allow comparison to the national population, are shown in table 1. The mean IMD score was 17.26, compared with 21.67 for England (higher figures indicate greater deprivation). There is a significant difference between the Devon and national populations (t-test, p<0.001) and relatively more of the Devon population are in the middle three quintiles. From age 20 onwards, the numbers of people in the less deprived quintile tended to increase with age, while the numbers in the most deprived quintile decreased with age.
Summary of population, classified by age quintiles for the NEW Devon population and English quintiles of social deprivation related to emergency admissions in the study period
Emergency admissions to hospital numbered 65 168 which equated to 85.09 admissions per thousand patients registered. Table 1 shows the emergency admissions for each age and deprivation grouping in the following 12 months. The 175 686 people aged 65 or more formed 22.9% of the registered population and generated 49% of all emergency admissions.
In the population as a whole, the relationship between social deprivation and risk of emergency admission to hospital was broadly linear, with emergency admissions increasing with increasing IMD (p<0.001; figure 1).

Relationship between deprivation score and probability of emergency hospital admission. The output of the quadratic model showing the calculated probability of emergency hospital admission occurring in the following year by Index of Multiple Deprivation (IMD) score for the entire study population. A high IMD score indicates a high level of deprivation. Dotted lines show 95% CIs.
The overall risk of emergency admission in the following year was close to 5% for the least deprived groups and approached 10% for the most deprived subgroups of the population.
In addition to having a higher overall probability of emergency hospital admissions, the over 65 age group was differently affected by deprivation (figure 2). The under 65s showed a modest increase with deprivation which levelled off above an IMD score of 50. The over 65s showed a greater increase and do not reach a plateau.

Relationship between deprivation score and probability of emergency admission to hospital for patients over and under 65 years. The output of the quadratic model showing the calculated probability of emergency hospital admission occurring in the following year with each Index of Multiple Deprivation score. The study population is divided into those under 65 years and those who are 65 years old and over. Dotted lines show 95% CIs.
The relationship between age and the occurrence of an emergency admission was non-linear and J-shaped (p<0.001; figure 3). The risk of admission declined during childhood from a peak in the first year or two of life to flatten out during early adulthood, remaining close to 3% between ages 20 and 40. The estimated probability of admissions increased exponentially after age 40, reaching 6.6% at age 65 and exceeding 30% by age 95.

Relationship between age and probability of emergency hospital. The output of the quadratic model showing the calculated probability of emergency hospital admission occurring in the following year at each age in years for the entire study population. Dotted lines show 95% CIs.
The J-shaped risk curve was apparent for both genders (see online supplementary appendix) and there was no statistical difference in emergency admissions between the two genders.
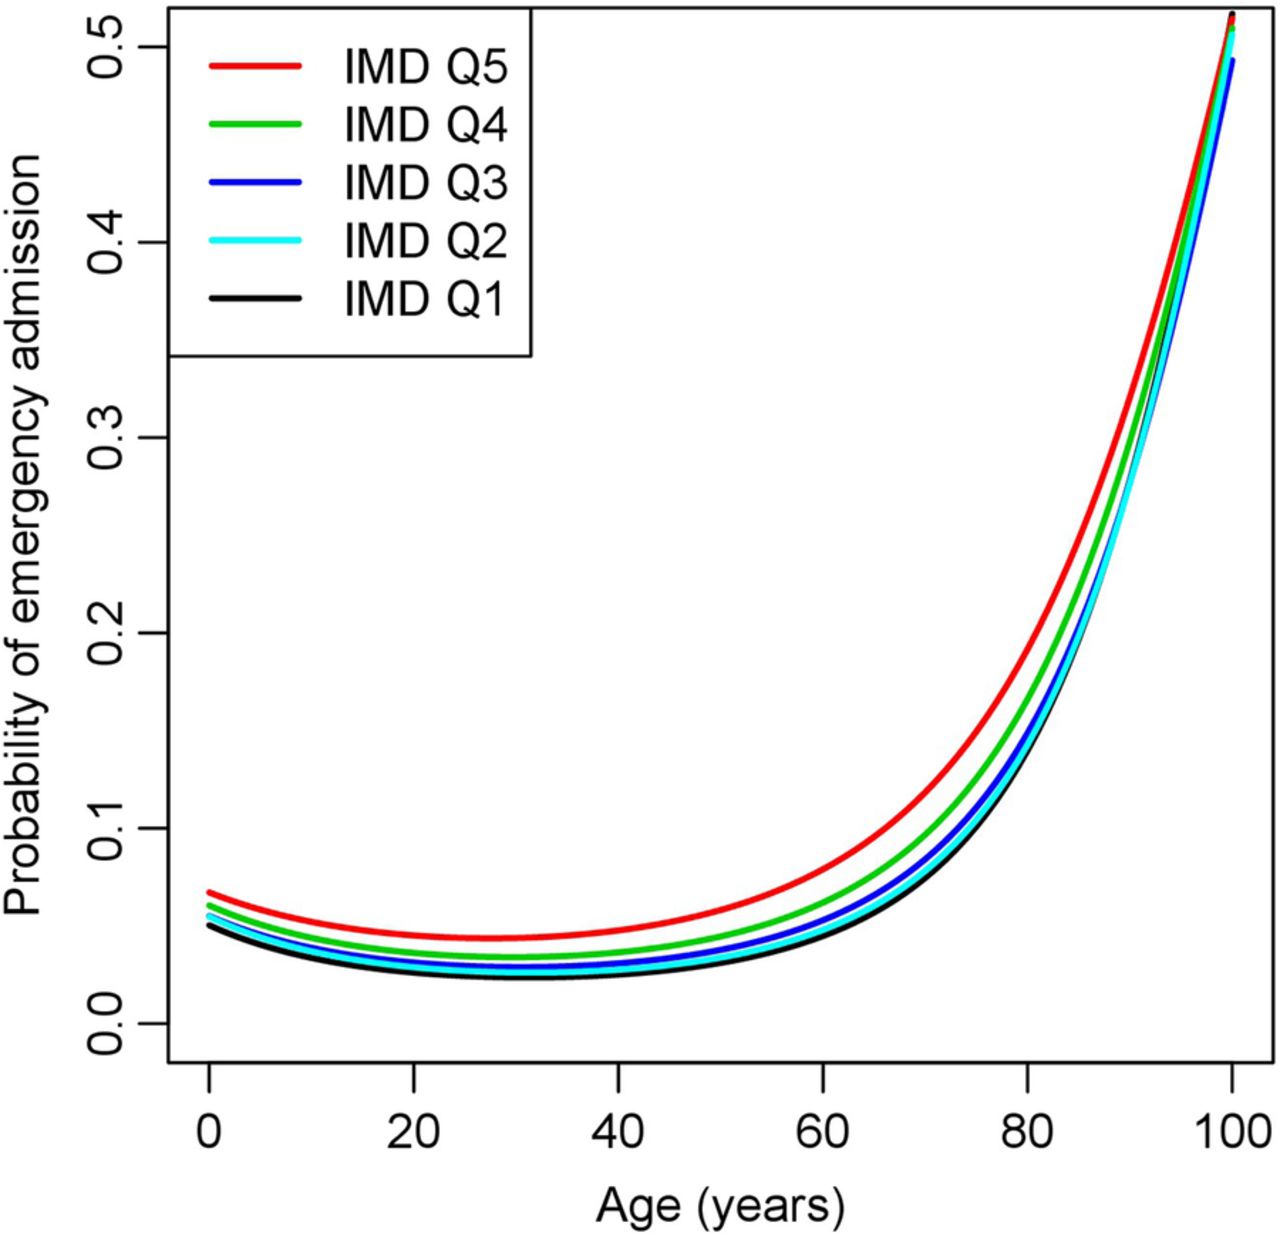
Fitting a combined model for emergency admissions, with deprivation categorised into quintiles for our population and age specified as a quadratic polynomial function, provided evidence of a significant interaction between age and deprivation (p<0.001; table 1; figure 4). The risk of emergency admissions was consistently higher in the more deprived subgroups, but the gap between the deprivation specific risk curves widened between the ages of 40 and 70. Above the age of 70, the risk curves for the different deprivation quintiles grew closer together.

Relationship between age and probability of emergency admission to hospital for each quintile of deprivation. The output of the quadratic model showing the calculated probability of emergency hospital admission occurring in the following year for each age of life for the study population divided into quintiles by Index of Multiple Deprivation score where 5 is the most and 1 the least deprived. CIs not shown to avoid confusion.
Within the subpopulation of patients aged under 65, age and social deprivation had similar magnitudes of effect on the risk of admissions. The differences in risk of admissions between the top and bottom quintiles of deprivation and age were 1.47 and 0.89 percentage points, respectively (figure 5).

The probability of emergency hospital admission divided into quintiles by age and deprivation for patients aged under 65. The study population was split at age 65 years then divided separately into quintiles of age and of deprivation.
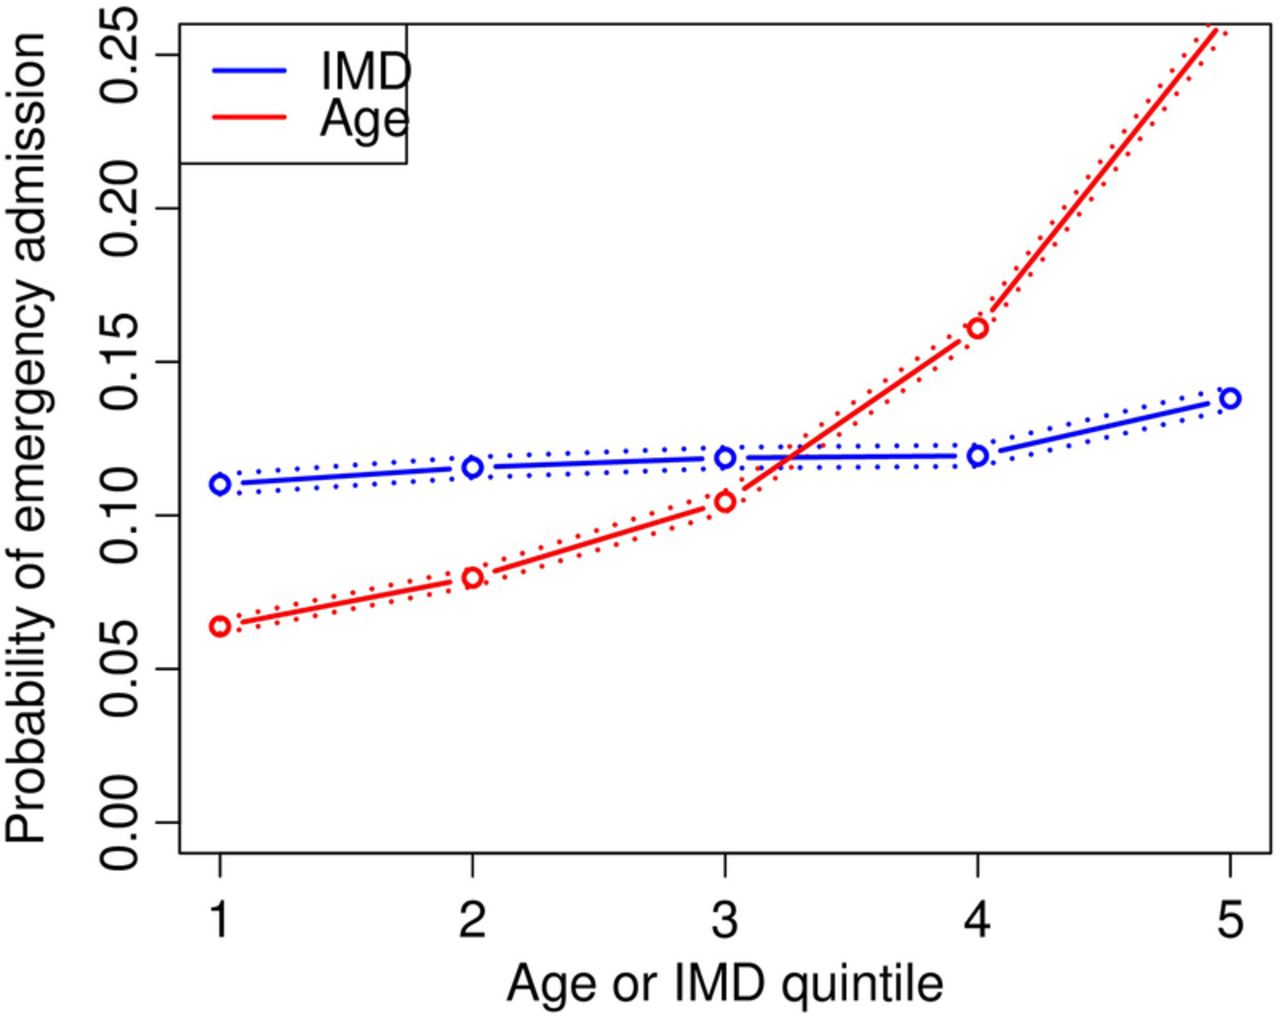
For patients aged 65 or over, age had a much stronger effect size than deprivation. The differences in the risk of admissions between the top and bottom quintile of IMD and age were 2.8 and 18.71 percentage points, respectively (figure 6). Similar patterns of effect sizes were seen for males and females (see online supplementary appendix).

The probability of emergency hospital admission divided into quintiles by age and deprivation for patients aged 65 or over. The study population was split at age 65 years then divided separately into quintiles of age and of deprivation.
Discussion
Limitations
Since this study was undertaken in only one county in England, the method needs replication in other geographical areas with differing levels of social deprivation and age structure. Anyone not registered with a Devon general practice was omitted. Using local areas for the application of the IMD scores to individuals has the limitation that a minority of individuals will experience a different level of deprivation in the overall postcode area score. This occurs in both directions in different areas and is implicit in the method. Population variation is inevitable in cohort studies, and here varied over 12 months by follow-up losses through death and migration. These people then had a reduced period of observation. Since we knew the number of emergency admissions, but had attrition from the population of 4.29%, the rates per thousand registered population appear slightly lower than the absolute true values. Other factors associated with emergency admission, including individual factors (ethnicity and lifestyle), and variations between local services and hospitals, were not studied. This analysis relates to only two of the most important predictors and their combined effect for emergency admissions to hospitals.
Strengths
In Devon, 3.4% of the whole population is already aged 85 or more. The over-65 population currently forms 22.9% of the Devon population and the over-65 population for England is predicted to be 22.2% in 2032.28 Devon's population today models England's in the future. Retention of 95.8% of the study population over 12 months is a strength. Older people are more likely to be in the less deprived quintiles for IMD for our population and for England as a whole,29 again showing the representativeness of our population.
Only 0.3% of the population deprivation scores were not available. English NHS hospitals are paid per emergency admission, derive about 40% of their income from them, and are incentivised to claim, aiding accurate returns.30 There are strengths in undertaking this work in the NHS as a defined, all-age population of 765 861 was available, with reports of all admissions to any English NHS hospital. Wiseman and Baker7 have emphasised that there is substantial variation between general practices. A strength of this study is that we were able to obtain data from every single practice in the area of the NEW Devon CCG.
Analysis
Other studies have shown that social deprivation6–9 and age19–21 are risk factors for emergency hospital admissions. A study of emergency admissions to a single hospital in Ireland23 recently showed that increasing deprivation is positively correlated with emergency hospital admissions in the over 65s, but that the ratio of admissions for over 65s to total admissions actually decreased with increasing deprivation, mainly due to higher numbers of emergency admissions among under 65s from deprived areas. The study was carried out in a different health system and although admissions were counted over 13 years, a single time-point measure of population and deprivation was used. In addition, the deprivation measure used is for a larger area than the individual postcode area for IMD. We have confirmed that deprivation significantly increases emergency admissions to hospital, even in the slightly more affluent population of East Devon. Importantly, we have for the first time shown the inter-relationship of age and deprivation at all ages.
Our principal new finding is that age is a dominant factor at age 65 and that in every one of the quintiles of social deprivation a similar J-shaped curve exists, implying a common biological factor with ageing. Over age 65, the biological effects of ageing outweigh the social effects of deprivation, although social deprivation still has a significant effect.
Age and social deprivation are significantly associated with emergency hospital admission, but the two factors impact differently at different ages. The 23% of the population aged over 65 generated 49% of all emergency admissions. The demographic prediction that the 85-and-over age group in England will double by 203018 underlines these findings for all countries/areas with ageing populations.
Implications
Our model makes it possible to quantify the effect of social deprivation by estimating the age-equivalent effect of social deprivation on the risk of admission at different ages. At age 60, the risk of admission in the most deprived social group equates to the risk of emergency admission at age 71.5 in the least deprived group (age-equivalent effect=11.5 years) (figure 4). The most deprived in the oldest age quintile have about 1.3 times (2.8 percentage points) greater probability of admission than those in the most affluent quintile (figure 6).
The NHS has for years tried to allocate resources fairly and, in the current NHS system, medical care is commissioned by Clinical Commissioning Groups (CCGs) which pay hospitals for each admission. The average cost to the NHS in 2013 was £1844 per emergency admission. How the CCGs receive funds is critical. The current formula does take age and social deprivation into account but not in a way which reflects the proportionate influence of these two key factors, nor the fact that they inter-relate.
As far as generalisablity is concerned, since every CCG in England has precise data for the age and social deprivation of the local population, our model makes it possible for them to anticipate and plan emergency admissions. As it is not adjusted for other factors related to age and deprivation (such as multimorbidity or obesity, respectively), the occurrence of these is included in the model.
Our findings provide a new logic for calculating the resource which should be made available to each CCG since, for the first time, the relative weight of social deprivation and age can be reflected. This method can be applied to any population using relevant local data and offers the NHS a more logical way of planning and allocating resources.
Acknowledgments
The authors thank Christine Wright, PhD, and Miss Eleanor White, BSc, for their editorial and administrative support.
References
Footnotes
Contributors DPG conceived the idea of the article and wrote the first draft. WH contributed ideas, led on all statistical analyses and wrote sections of the article. TC searched the database and is the guarantor of the data. KS-L contributed to the data analysis, writing and editing of the article. PE provided clinical input and contributed to the writing and editing of the manuscript. All five authors read and checked the final manuscript and agreed submission for publication.
Funding This research received no specific grant from any funding agency in the public, commercial or not-for-profit sectors.
Competing interests The St Leonard's Practice Exeter, Devon is in contract with the Devon and Cornwall area team of NHS England. This Practice is within the area of the NEW Devon Commissioning Group and uses data from the Devon Predictive Model. WH was supported by the National Institute for Health Research (NIHR) Collaboration for Leadership in Applied Health Research and Care (CLAHRC) for the South West Peninsula. TC is a whole-time employee of the NEW Devon Clinical Commissioning Group. He is a director of a private company Gnosis Logica which advises on predictive modelling.
Disclaimer The views expressed in this publication are those of the authors and not necessarily those of the NHS, the NIHR or the Department of Health.
Provenance and peer review Not commissioned; externally peer reviewed.
Data sharing statement These data are the property of the CCG and are not available for disclosure.