Article Text

Abstract
Introduction Overweight and obesity is a worldwide public health problem among children and adolescents. However, the magnitude of effect, as well as hierarchy of exercise interventions (aerobic, strength training or both), on selected measures of adiposity is not well established despite numerous trials on this issue. The primary purposes of this study are to use the network meta-analytical approach to determine the effects and hierarchy of exercise interventions on selected measures of adiposity in overweight and obese children and adolescents.
Methods and analysis Randomised exercise intervention trials >4 weeks, available in any language up to 31 August 2017 and which include direct and/or indirect evidence, will be included. Studies will be located by searching seven electronic databases, cross-referencing and expert review. Dual selection and abstraction of data will occur. The primary outcomes will be changes in body mass index (in kg/m2), fat mass and percent body fat. Risk of bias will be assessed using the Cochrane Risk of Bias assessment instrument while confidence in the cumulative evidence will be assessed using the Grading of Recommendations Assessment, Development and Evaluation instrument for network meta-analysis. Network meta-analysis will be performed using multivariate random-effects meta-regression models. The surface under the cumulative ranking curve will be used to provide a hierarchy of exercise treatments (aerobic, strength or both).
Ethics and dissemination This study does not require ethics approval. Findings will be presented at a professional conference and published in a peer-reviewed journal.
PROSPERO registration number CRD42017073103.
- exercise
- overweight
- obesity
- children
- adolescents
- network meta-analysis
This is an Open Access article distributed in accordance with the Creative Commons Attribution Non Commercial (CC BY-NC 4.0) license, which permits others to distribute, remix, adapt, build upon this work non-commercially, and license their derivative works on different terms, provided the original work is properly cited and the use is non-commercial. See: http://creativecommons.org/licenses/by-nc/4.0/
Statistics from Altmetric.com
Strengths and limitations of this study
To the best of the investigative team’s knowledge, this is the first systematic review to use the network meta-analytical approach to determine the effects as well as hierarchy of exercise interventions (aerobic, strength training or both) on body mass index in kg/m2, fat mass and percent body fat in overweight and obese children and adolescents.
The results of this systematic review with network meta-analysis should be useful to practitioners and policy-makers for making informed decisions about exercise in the treatment of overweight and obesity in children and adolescents.
The results of this systematic review with network meta-analysis should be useful to researchers with respect to the conduct and reporting of future research on this topic.
Common to most meta-analyses, the results may yield significant heterogeneity which cannot be explained.
Like any aggregate data meta-analysis, the possibility of ecological fallacy exists, that is, that group averages are not reflective of an individual’s values.
Introduction
Rationale
Overweight and obesity in children and adolescents is a major public health problem worldwide. Between 1980 and 2013, the worldwide prevalence of overweight and obesity in children and adolescents increased by 6.9%, from 16.9% to 23.8%, in boys and by 6.4%, from 16.2% to 22.6%, in girls from developed countries.1 For developing countries, increases of 4.8%, from 8.1% to 12.9% for boys and 5%, from 8.4% to 13.4% in girls, were reported.1
The negative outcomes associated with obesity in children and adolescents are both immediate and long term.2 For immediacy, a population-based study of children and adolescents 5–17 years of age found that approximately 70% of obese youth had a minimum of one cardiovascular disease risk factor (high cholesterol, high blood pressure, etc).3 Obese children and adolescents are also more likely to be diagnosed with prediabetes,4 as well as being at an increased risk for bone and joint difficulties, sleep apnoea, and social and psychological issues such as stigmatisation, poor self-esteem and poorer health-related quality of life.5 6 Long-term, childhood and adolescent overweight and obesity has been demonstrated to track into adulthood,7–11 thus placing overweight and/or obese adults at a greater risk for cardiovascular disease, type 2 diabetes, stroke, several types of cancer and osteoarthritis.2
One promising intervention in the treatment of overweight and obesity is exercise. However, previous randomised trials that were limited to or included overweight and obese children and adolescents have led to conflicting results,12–58 with some reporting statistically significant reductions in adiposity (body mass index (BMI)) as a primary outcome12 13 16 17 22 27 28 31 41 51–56 59–63 and others reporting no change.14 15 18–21 23–26 29 30 32–40 42–50 57 58 62 64 65 When limited to overweight and obese male and female children and adolescents,12 14 17–20 22–26 28 31 33 36 38–41 45–57 only 18 (45.0%) have reported statistically significant reductions in BMI.12 17 22 28 31 41 50–58 While this may lead one to the general conclusion that exercise does little to reduce BMI in overweight and obese children and adolescents, this would be short-sighted since it relies on the vote-counting approach,66 an approach that has been shown to be less valid than the meta-analytical approach.66 67
Previous systematic reviews with meta-analyses that have focused on the effects of exercise as an independent intervention on BMI as a primary outcome in male and female children and adolescents have reported conflicting findings with five reporting a significant improvement in BMI68–72 and five others reporting no statistically significant improvement.73–77 However, 9 of the 10 suffer from one or more of the following limitations: (1) inclusion of a small number of studies with exercise as the only intervention,71 73–75 (2) inclusion of non-randomised trials,68 74 (3) inclusion of children and adolescents who were not overweight or obese.70 72 74 76 77 Relevant to this study, all 10 suffer from reliance on pairwise versus network meta-analyses, the latter of which incorporates both direct and indirect evidence. In addition, there was an absence of an established hierarchy for determining which types of exercise (aerobic, strength training or both) might be best for improving BMI based on both direct and indirect evidence.68–77 To partially address this issue as well as demonstrate feasibility, the investigative team has recently used the network meta-analytical approach to examine the effects of exercise (aerobic, strength training or both) on BMI z-score in overweight and obese children and adolescents.78 79 Statistically significant reductions in BMI z-score were found for aerobic exercise and combined aerobic and strength exercise, but not strength training alone (mean, 95% CI, aerobic, −0.10, –0.15 to −0.05; aerobic and strength, −0.11,–0.19 to −0.03; strength, 0.04,–0.07 to 0.15).79 Combined aerobic and strength training was ranked best, followed by aerobic exercise and then strength training.79 Consistency in evidence and risk of bias did not differ between direct and indirect studies.79 It was concluded that combined aerobic exercise and strength training as well as aerobic exercise alone are associated with reductions in BMI z-score.79 The lack of effect on BMI z-score in the strength training studies may have been the result of increases in lean muscle mass. However, since BMI in kg/m2 continues to be the most frequently assessed and reported measure of adiposity in both the clinical and public health setting, such an examination using the network meta-analytical approach is needed. In addition, since all types of BMI measures as well as body weight do not capture changes in body composition (fat mass, percent body fat, etc), the inclusion of such outcomes, as previously suggested,79 is also necessary.
Objectives
The primary objectives of the current study are to conduct a systematic review with network meta-analysis of randomised trials to (1) determine the effects of exercise (aerobic, strength training or both) on adiposity (BMI in kg/m2, fat mass, percent body fat) in overweight and obese children and adolescents, and (2) establish a hierarchy of exercise interventions (aerobic, strength training or both) for treating adiposity (BMI in kg/m2, fat mass, percent body fat) in overweight and obese children and adolescents.
Methods
Overview
This study will follow the guidelines from the Preferred Reporting Items for Systematic Reviews and Meta-Analysis extension statement for network meta-analyses of healthcare interventions.80
Eligibility criteria
The inclusion criteria for this proposed network meta-analysis will be as follows: (1) direct evidence from randomised trials that compare two or more exercise interventions (aerobic, strength training, both) or indirect evidence from randomised controlled trials that compare an exercise intervention group to a comparative control group (non-intervention, attention control, usual care, wait-list control, placebo), (2) exercise-only intervention (aerobic, strength training or both), (3) studies lasting ≥4 weeks, (4) male and/or female children and adolescents 2–18 years of age, (5) participants overweight or obese, as defined by the authors, (6) studies published in any language up to 31 August 2017, (7) data available for BMI in kg/m2, fat mass or percent body fat.
Studies will be limited to randomised trials because it is the only way to control for confounders that are not known or measured as well as the observation that non-randomised controlled trials tend to overestimate the effects of healthcare interventions.81 82 Indirect evidence studies will be limited to randomised controlled trials with at least one exercise arm that participates in either aerobic, strength training, or a combination of aerobic and strength training exercise. Direct evidence studies will be limited to randomised trials that include at least two of the following exercise arms: (1) aerobic, (2) strength training, (3) aerobic and strength training exercise.
For the purposes of this study, exercise, aerobic exercise and strength training will be defined according to the 2008 Physical Activity Guidelines for Americans,83 that is, movement which is ‘planned, structured, and repetitive and purposive in the sense that the improvement or maintenance of one or more components of physical fitness is the objective’,83 84 aerobic exercise as ‘exercise that primarily uses the aerobic energy-producing systems, can improve the capacity and efficiency of these systems, and is effective for improving cardiorespiratory endurance’,83 and strength training as ‘exercise training primarily designed to increase skeletal muscle strength, power, endurance, and mass’.83 Four weeks was chosen as the lower cut point for intervention length based on previous research demonstrating improvements in adiposity over this period of time in 11-year-olds.21
Participants will be limited to overweight and obese children and adolescents, as defined by the original study authors, because it has been shown that this population is at an increased risk for premature morbidity and mortality throughout their lifetime.85
While some research has suggested that studies yielding statistically significant and positive results are more likely to be published in English-language versus non-English-language journals,86 other research has shown this to not be the case.87 Given the former, studies from both English-language and non-English-language articles will be included with the latter translated into English by the second author using the freely available web-based Babelfish and Bing translators. For those studies that cannot be translated using Babelfish and/or Bing, professional translation services will be used.
BMI in kg/m2 was included as one of the three primary adiposity outcomes because it is the most commonly used and understood variable by practitioners as well as others and can be easily measured from body weight and height. However, because BMI is an indirect measure of adiposity, fat mass and percent body fat will be included because they are more direct measures of adiposity. The inclusion of fat mass and percent body fat may be especially relevant for studies that include strength training given that decreases in adiposity as measured by BMI may be offset by increases in muscle mass, a secondary outcome that will be included.
Information sources
The following seven electronic databases will be searched: (1) PubMed, (2) Web of Science, (3) Cochrane Central Register of Controlled Trials, (4) Cumulative Index to Nursing and Allied Health Literature, (5) Sport Discus, (6) Translating Research into Practice and (7) ProQuest Dissertations and Theses. In addition to electronic database searches, cross-referencing will be conducted by examining the reference lists of previous review articles as well as each included study for potential articles that meet the inclusion criteria. On completion of initial searches, the third author will examine the reference list for thoroughness and completeness. Suggested studies will then be retrieved to see if they meet all inclusion criteria.
Search strategy
Search strategies specific to each database will be developed by the investigative team. Major keywords, or forms of keywords to include will be ‘random’, ‘children’, ‘adolescents’, ‘overweight’, ‘obese’, ‘exercise,’ ‘physical fitness’, ‘body composition’, ‘fat mass’, ‘body fat’, ‘body composition’, ‘body mass index’, ‘adiposity’. A copy of a preliminary search strategy using PubMed, including limits, can be found in the online supplementary file. This search strategy will be adapted for other database searches. All database searches and article retrieval will be conducted by the second author with oversight from the first author.
Supplementary file 1
Study records
Study selection
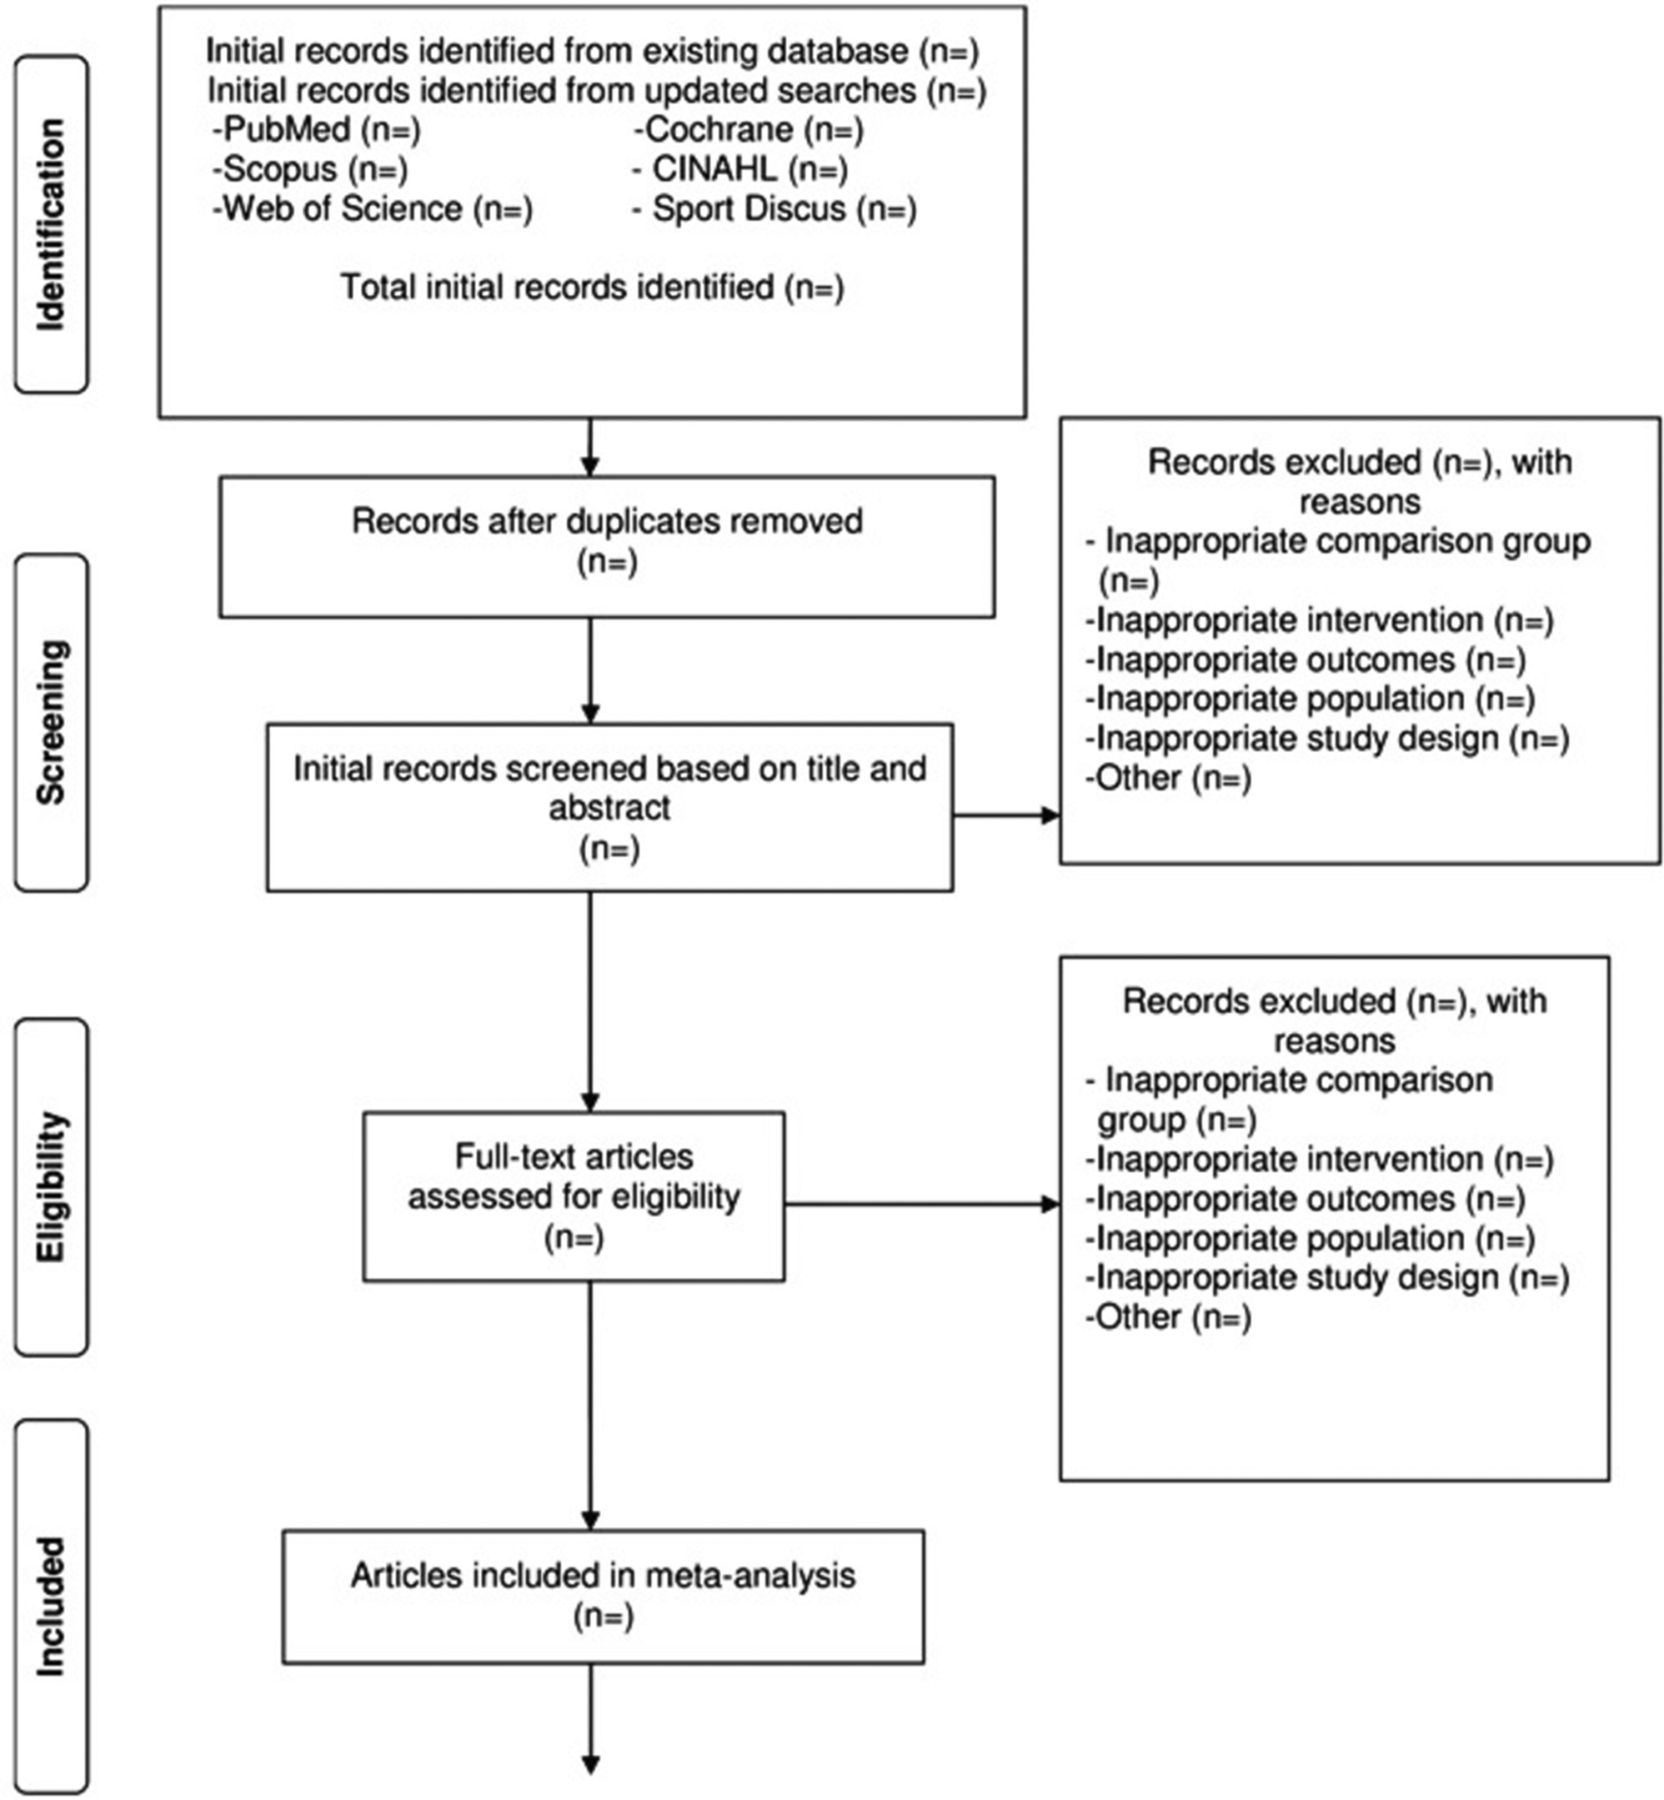
All studies to be screened will be imported into EndNote (V.X8; Thomson-Reuters; 2016, New York, USA) and duplicates removed electronically and then manually by the second author. A copy of the database will then be provided to the first author for duplicate screening. To minimise selection bias, the first and second authors will select all studies, independent of each other. They will then review their selections for accuracy and consistency. The full report for each article will be retrieved for all titles and abstracts that appear to meet the inclusion criteria as well as those where uncertainty exists. Multiple reports for the same study will be addressed by including the most recently published article and drawing from prior reports, assuming the same methods and sample sizes are reported. Based on previous research suggesting neither a clinically nor statistically significant effect on results, blinding to journal titles, study authors or institutions of the authors will not be employed during the screening and data abstraction processes.88 Reasons for excluded studies will be recorded using the following categories: (1) inappropriate population, (2) inappropriate intervention, (3) inappropriate comparison(s), (4) inappropriate outcome(s), (5) inappropriate study design, (6) other. On the conclusion of screening, the first and second authors will meet and review their selections. Cohen’s κ statistic will be used to measure interselection agreement.89 Any discrepancies will be resolved by consensus. If consensus cannot be reached, the third author will serve as an arbitrator. After selecting the final number of studies to include, the overall precision of the searches will be computed by dividing the number of included studies by the total number of studies screened after removing duplicates.90 The number needed-to-read (NNR) will then be calculated as the reciprocal of the precision.90 A flow diagram that describes the search procedure will be included as well as supplementary file a reference list of all excluded studies, including the reason(s) for exclusion. Figure 1 illustrates the proposed structure for the flow diagram.

![[SP1.jpg]](https://bmjopen.bmj.com/content/bmjopen/7/12/e019512/DC1/embed/inline-supplementary-material-1.jpg?download=true)
Proposed flow diagram to depict the search process.
Data abstraction
For this project, Microsoft Excel (V.2016; Microsoft Corporation, Redmond, Washington, USA) will be used to develop comprehensive electronic codebooks that will define the coding process for each of the variables coded. The codebook will be created by the first two authors with feedback from the third author. Consequently, the abstraction of data from the studies in this proposed project should require little subjective judgement on the part of the coder. The major groups of variables to code will include (1) study characteristics (author, journal, year of publication, etc), (2) participant characteristics (age, gender, height, body weight, etc) and (3) data for primary and secondary outcomes (sample sizes, baseline and postexercise means and SD, etc). Table 1 contains a preliminary list of variables that will be coded. Based on previous research by the investigative team,79 a codebook capable of including at least 242 items from each study is expected. To avoid data abstraction bias, the first two authors will independently code (dual-coding) all studies to ensure accuracy and consistency. Inter-rater agreement will be assessed using Cohen’s κ.89 Any disagreement in the items coded will be discussed until mutual agreement is reached. If agreement cannot be reached, the third author will serve as an arbitrator.
Covariates to examine using simple meta-regression
Outcomes and prioritisation
The primary outcomes in this study will be changes in BMI in kg/m2, fat mass, and percent body fat in overweight and obese children and adolescents. Secondary outcomes will include body weight, lean body mass, waist circumference, waist-to-hip ratio, energy intake, energy expenditure, physical activity level, maximum oxygen consumption (relative and absolute), muscular strength, resting systolic and diastolic blood pressures, total cholesterol, high-density lipoprotein cholesterol, ratio of total cholesterol to high-density lipoprotein cholesterol, non-high-density lipoprotein cholesterol, low-density lipoprotein cholesterol, triglycerides, glycosylated haemoglobin, fasting and non-fasting glucose and insulin.
Risk of bias assessment in individual studies
Risk of bias for included studies will be assessed using the Cochrane Risk of Bias Instrument.91 Assessment is based on judgements of low, high or unclear risk of bias across six defined domains: (1) sequence generation, (2) allocation sequence concealment, (3) blinding of participants and personnel, (4) blinding of outcome assessors, (5) incomplete outcome data and (6) selective outcome reporting. A seventh domain, whether participants were exercising regularly, as defined by the original study authors, will also be assessed using the same approach as for the other six domains. As previously recommended, study-level results will be reported for each domain according to risk of bias (low, high or unclear) while the percentage of low, high or unclear results across each domain will also be reported.91 This risk of bias approach has been recommended over the use of study quality rating scales given the lack of empirical evidence to support the latter.82 92 93 Assessment for risk of bias will be limited to the primary outcomes of interest, that is, changes in BMI in kg/m2, fat mass and percent body fat. All studies will be classified as high risk of bias with respect to the category ‘blinding of participants and personnel’ given that it’s virtually impossible to blind participants to group assignment in exercise intervention protocols. Based on previous research, no study will be excluded based on risk of bias results.94
Data synthesis
Calculation of effect sizes
The primary outcomes for this study will be changes in BMI in kg/m2, fat mass (kg), and percent body fat using the original metric. Changes for indirect comparisons will be calculated by subtracting the change outcome difference in the exercise group minus the change outcome difference in the control group. Variances will be computed using the pooled SDs of change scores in the exercise and control groups. If change score SDs are not available, they will be calculated from 95% CIs for either change outcome or treatment effect differences as well as pre-SD and post-SD values, the latter according to procedures developed by Follmann et al.95 For direct comparisons, that is, randomised trials with no control group, the same general procedures will be followed except that the control group data will be replaced with one of the exercise interventions as follows: (1) aerobic minus strength training, (2) aerobic and strength training combined minus aerobic training, (3) aerobic and strength training combined minus strength training. Ninety-five percent CI and z-α values will be calculated for each outcome from each study. For those studies that include both direct and indirect comparisons, only direct comparison data will be included since a primary purpose of the current meta-analysis is determining which exercise interventions(s) might work best for improving adiposity in children and adolescents. For studies in which adiposity outcomes are assessed at multiple intervention time points, for example, 0 weeks, 8 weeks and 16 weeks, only data from the initial and last assessment will be used. If follow-up data are available, results from such studies will also be analysed separately to determine the sustainability of changes in adiposity. If any cross-over trials are included, treatment effects will be calculated by using all assessments from the intervention and control periods and analysing them similar to a parallel group trial.96 While the possibility of a unit-of-analysis error exists as well as studies being underweighted versus overweighted, this method is believed to be better than alternative approaches, for example, limiting data from the first assessment point or trying to impute SDs, especially given the primary and secondary outcomes included and expected distribution of findings.96
Secondary outcomes (body weight, lean body mass, waist circumference, waist-to-hip ratio, energy intake, energy expenditure, maximum oxygen consumption (relative and absolute), resting systolic and diastolic blood pressures, total cholesterol, high-density lipoprotein cholesterol, ratio of total cholesterol to high-density lipoprotein cholesterol, non-high-density lipoprotein cholesterol, low-density lipoprotein cholesterol, triglycerides, glycosylated haemoglobin, fasting and non-fasting glucose and insulin) will be handled using the same approach as for primary outcomes. However, given the different metrics expected and the inability to convert between them, changes in physical activity levels and muscular strength will be calculated using the standardised mean difference effect size, adjusted for small sample sizes.97
Pooled estimates for changes in outcomes
Network (geometry) plots for each outcome will be used to provide a visual representation of the evidence base with nodes (circles) weighted by the number of participants randomised to each treatment and edges (lines) weighted by the number of studies evaluating each pair of treatments.98 99 Contribution plots for each outcome will be used to determine the most dominant comparisons for each network estimate as well as for the entire network.98 The weights applied will be a function of the variance of the direct treatment effect and the network structure, the result being a percent contribution of each direct comparison to each network estimate.98
Network meta-analysis will be performed using multivariate random-effects meta-regression models that can be performed within a frequentist setting, allows for the inclusion of potential covariates, and correctly accounts for the correlations from multiarm trials.100 101 A two-tailed α value <0.05 and non-overlapping 95% CI will be considered to represent statistically significant changes. Separate network meta-analysis models will be used to examine for changes in each primary and secondary outcome. Potential covariates will be examined by (1) conducting simple meta-regression for statistically significant associations between covariates and changes in primary outcomes (BMI in kg/m2, fat mass, percent fat), (2) examining for multicollinearity between covariates (r>0.80) and (3) building a multiple meta-regression model. A list of potential covariates to examine using simple meta-regression is shown in table 1. While we will include all methods used to assess adiposity, we will also conduct sensitivity analyses to see if results differ according to method of assessment, for example, fat mass assessed using whole body MRI versus bioelectrical impedance. Secondary outcomes (energy intake and expenditure, physical activity level, muscular strength) will be handled using the same approach. Transitivity, that is, similarity in the distribution of potential effect modifiers across the different pairwise comparisons for each outcome102 will include those listed in table 1. Inconsistency, that is differences in effect estimates between direct and indirect results for the same comparison,103 will be checked by assessing differences in treatment effects between direct and indirect effect estimates as well as differences between trials with different designs, for example, two-arm versus multiarm trials.101 103 104 However, the probability of inconsistency is considered small given recent research demonstrating that inconsistency was detected in only 2%–14% of tested loops, depending on the effect measure and heterogeneity estimation method.105 106 Finally, prediction intervals will be used to enhance interpretation of results with respect to the magnitude of heterogeneity as well as provide an estimate of expected results in a future study.107–109 For network meta-analysis, degrees of freedom (df) will be set to the number of studies–the number of comparisons–1.109
Meta-biases
Small-study effects (publication bias, etc) will be assessed using comparison-adjusted funnel plots.98 In the absence of small-study effects, the comparison-adjusted funnel plot should be symmetrical around the zero line.
Confidence in cumulative evidence
Quality analysis of specific pairwise effect estimates in the network meta-analysis will be evaluated using a recently developed modification of the Grading of Recommendations Assessment, Development and Evaluation for network meta-analysis across five domains: (1) study limitations, (2) indirectness, (3) inconsistency, (4) imprecision and (5) small-study effects.110 Assessment will be conducted using the same procedures as for study selection and data abstraction.
To establish a hierarchy of exercise interventions for selected outcomes in the current meta-analysis, ranking analysis, that is, the ability to rank all interventions for a single outcome under study, for example changes in BMI in kg/m2, will be used based on probabilities. However, because the ranking of treatments based exclusively on the probability of each treatment being the best should be avoided given that it does not account for the uncertainty in the relative treatment effects and the possibility for assigning higher ranks for treatments in which little evidence is available, separate rankograms and cumulative ranking probability plots will be used to present ranking probabilities along with their uncertainty for changes in primary and secondary outcomes.98 111 The surface under the cumulative ranking curve (SUCRA), a transformation of the mean rank, will be used to establish a hierarchy of exercise interventions (aerobic, strength, both) while accounting for the location and variance of all treatment effects.98 111 Larger SUCRA values indicate better ranks for the treatment.98 111 Interpretation of all rankings will be approached from the perspective of absolute and relative treatment effects.99
Software used for statistical analysis
All data will be analysed using Stata (V.14.1; Stata/SE for Windows, Stata Corporation, College Station, Texas, USA), Microsoft Excel (V.2016; Microsoft Corporation, Redmond, Washington, USA), and two add-ins for Excel, SSC-Stat (V.2.18; SSC-Stat, V.3.0.; Statistical Services Center; 2007; University of Reading, UK) and EZAnalyze (V.3.0; TA Poynton; 2007).
Amendments to protocol
None to date. If this protocol is amended, the date of each amendment, a description of the change, as well as a rationale for the change, will be provided.
References
- 1.↵
- 2.↵
- 3.↵
- 4.↵
- 5.↵
- 6.↵
- 7.↵
- 8.↵
- 9.↵
- 10.↵
- 11.↵
- 12.↵
- 13.↵
- 14.↵
- 15.↵
- 16.↵
- 17.↵
- 18.↵
- 19.↵
- 20.↵
- 21.↵
- 22.↵
- 23.↵
- 24.↵
- 25.↵
- 26.↵
- 27.↵
- 28.↵
- 29.↵
- 30.↵
- 31.↵
- 32.↵
- 33.↵
- 34.↵
- 35.↵
- 36.↵
- 37.↵
- 38.↵
- 39.↵
- 40.↵
- 41.↵
- 42.↵
- 43.↵
- 44.↵
- 45.↵
- 46.↵
- 47.↵
- 48.↵
- 49.↵
- 50.↵
- 51.↵
- 52.↵
- 53.↵
- 54.↵
- 55.↵
- 56.↵
- 57.↵
- 58.↵
- 59.↵
- 60.↵
- 61.↵
- 62.↵
- 63.↵
- 64.↵
- 65.↵
- 66.↵
- 67.↵
- 68.↵
- 69.↵
- 70.↵
- 71.↵
- 72.↵
- 73.↵
- 74.↵
- 75.↵
- 76.↵
- 77.↵
- 78.↵
- 79.↵
- 80.↵
- 81.↵
- 82.↵
- 83.↵
- 84.↵
- 85.↵
- 86.↵
- 87.↵
- 88.↵
- 89.↵
- 90.↵
- 91.↵
- 92.↵
- 93.↵
- 94.↵
- 95.↵
- 96.↵
- 97.↵
- 98.↵
- 99.↵
- 100.↵
- 101.↵
- 102.↵
- 103.↵
- 104.↵
- 105.↵
- 106.↵
- 107.↵
- 108.↵
- 109.↵
- 110.↵
- 111.↵
Footnotes
Contributors GAK is the guarantor. GAK, KSK and RRP drafted the manuscript. All authors contributed to the development of the data sources to search for relevant literature, including search strategy, selection criteria, data extraction criteria and risk of bias assessment strategy. GAK provided statistical expertise while RRP provided content expertise on exercise and adiposity in overweight and obese children and adolescents. All authors read, provided feedback and approved the final manuscript.
Funding This study is funded by the American Heart Association, Grant #17GRNT33630158 (GA Kelley, Principal Investigator). The content of this manuscript is solely the responsibility of the authors and does not necessarily represent the official views of the American Heart Association.
Competing interests None declared.
Provenance and peer review Not commissioned; externally peer reviewed.