Article Text

Abstract
Objective To determine the utility of International Classification of Diseases (ICD) codes in investigating trends in ST-segment elevation myocardial infarction (STEMI) and non-ST-segment elevation myocardial infarction (NSTEMI) using person-linked electronic hospitalisation data in England and Western Australia (WA).
Methods All hospital admissions with myocardial infarction (MI) as the principal diagnosis were identified from 2000 to 2013 from both jurisdictions. Fourth-digit ICD-10 codes were used to delineate all MI types—STEMI, NSTEMI, unspecified and subsequent MI. The annual frequency of each MI type was calculated as a proportion of all MI admissions. For all MI and each MI type, age-standardised rates were calculated and age-adjusted Poisson regression models used to estimate annual percentage changes in rates.
Results In 2000, STEMI accounted for 49% of all MI admissions in England and 59% in WA, decreasing to 35% and 25% respectively by 2013. Less than 10% of admissions were recorded as NSTEMI in England throughout the study period, whereas by 2013, 70% of admissions were NSTEMI in WA. Unspecified MI comprised 60% of all MI admissions in England by 2013, compared with <1% in WA. Trends in age-standardised rates differed for all MI (England, −2.7%/year; WA, +1.7%/year), underpinned by differing age-adjusted trends in NSTEMI (England, −6.1%/year; WA, +10.2%/year).
Conclusion Differences between the proportion and trends for MI types in English and WA data were observed. These were consistent with the coding standards in each country. This has important implications for using electronic hospital data for monitoring MI and identifying MI types for outcome studies.
- myocardial infarction
- cardiac epidemiology
This is an Open Access article distributed in accordance with the Creative Commons Attribution Non Commercial (CC BY-NC 4.0) license, which permits others to distribute, remix, adapt, build upon this work non-commercially, and license their derivative works on different terms, provided the original work is properly cited and the use is non-commercial. See: http://creativecommons.org/licenses/by-nc/4.0/
Statistics from Altmetric.com
Strengths and limitations of this study
This study uses whole-population electronic hospital data from England and Western Australia (WA) which allowed for identification of all myocardial infarction (MI) hospitalisations in both jurisdictions.
Data from WA were used because national Australian data are unlinked, and would therefore have overestimated rates and potentially influenced trends. We used proportions and age-standardised rates to make comparisons in MI type and limit the impact of different population size and structure between the jurisdictions.
We were unable to validate the recording of ST-segment elevation MI and non-ST-segment elevation MI in electronic records against clinical data. However we closely investigated the International Classification of Diseases codes and standards in each jurisdiction which could potentially influence the type of MI recorded.
Introduction
Coronary heart disease (CHD) remains a leading cause of morbidity and mortality in developed countries despite sustained long-term improvements in incidence and case fatality in recent decades.1 Population-level studies have historically analysed myocardial infarction (MI) as a single entity, often using routinely collected electronic hospital admission data.2 Since the late 1990s, MI has been classified clinically as either the more severe ST-segment elevation MI (STEMI) or non-ST-segment elevation MI (NSTEMI). For monitoring and epidemiological studies, it is important to differentiate MI type because of different risk stratification, acute management and outcomes for patients diagnosed with STEMI and NSTEMI.3
Administrative data, such as electronic hospital records, are increasingly used in many countries for health research and monitoring of trends in disease including MI and CHD. However it is unclear whether the two clinical MI diagnoses can be accurately identified in such datasets. Research has been impeded by the lack of specific International Classification of Diseases (ICD) codes for STEMI and NSTEMI in the WHO version of ICD-10.4 This has been further complicated by the inclusion of ICD codes for unspecified and subsequent MI in ICD manuals, and different coding standards across jurisdictions. Reports of opposing trends in hospitalisation rates for STEMI and NSTEMI and the use of increasingly sensitive troponin assays have also complicated interpretation of data from electronic hospital records.5 6
Studies using electronic hospital data in England and Australia have shown differences in trends in national hospitalisation rates for all MI. Rates have continued to decline in England,7 whereas MI rates have plateaued nationally in Australia and Western Australia (WA) since the early 2000s.8 9 We are now conducting an international collaborative study of comparative population-level CHD trends between England and Australia. It includes investigation into possible reasons for the observed differences in MI trends and the potential utility of these data sources for investigating MI type. We thus undertook a comparative analysis of trends in proportions and hospitalisation rates of each MI type between English and WA person-linked hospital data from 2000 to 2013.
Methods
Data sources
Person-linked hospitalisation data for all CHD hospital admissions for the English and WA populations were available as part of a larger study comparing trends in CHD subgroups between England and Australia. For the current report, person-linked English hospitalisation data were available from the Hospital Episodes Statistics (HES) dataset which includes all National Health Service hospital admissions for MI. The HES data were supplied by the English Health and Social Care Information Centre and were linked by the Oxford Record Linkage Study team. As national Australian data are unlinked, we elected to use our person-linked WA dataset. This was obtained from the WA Data Linkage System and linked by the WA Data Linkage Branch using probabilistic matching. This dataset contains all MI hospital admissions for the population of WA.
ICD versions and MI codes
Hospital admissions in England have been coded using the WHO version of ICD-10 since April 1995, and an Australian Modification (ICD-10-AM) has been in use in most Australian states since July 1998 and in WA, since July 1999. The I21 code refers to an acute MI and is most commonly used in epidemiological studies. There has been no specific fourth-digit ICD-10 code for STEMI or NSTEMI in the WHO version, although a reference to ‘MI with non-ST elevation’ was added to the I21.4 code in 2015.4 An update in 2004 to ICD-10-AM in Australia contained changes to I21 code descriptors, with ‘transmural infarction or STEMI’ and ‘subendocardial infarction or NSTEMI’ included with the relevant codes.10 The ICD-10 codes for MI at the fourth-digit level are described in detail in online supplementary table 1.
Supplementary file 1
The study period of 2000–2013 coincides with the use of STEMI and NSTEMI in clinical practice, and the gradual implementation of coding standards and guidelines for these specific diagnoses in electronic hospital data (online supplementary Methods). The National Clinical Coding Standards used in England during this period required that an MI be coded as unspecified unless transmural or subendocardial damage were recorded (even if STEMI or NSTEMI were detailed in the medical notes).11 12 In contrast, since 2004 the Australian Coding Standards indicate that the fourth-digit codes for STEMI and NSTEMI can be used if recorded in the medical notes, irrespective of whether the severity of myocardial damage is noted.
The WHO ICD-10 manual states that the code I22.x ‘…should be assigned for infarction of any myocardial site, occurring within 4 weeks (28 days) from onset of a previous infarction.’4 In Australia, coding standards are consistent with this descriptor. In contrast, English coders had been instructed to assign I22 for an admission if there was documentation of any previous MI in the patient’s medical record, no matter when the preceding MI occurred. This standard was modified in 201212 so that an MI occurring more than 4 weeks after an acute MI is now classified as I21, thus, becoming congruent with the coding standard in Australia.
Case identification
For the current analysis, all hospital records coded as I21 or I22 in the principal diagnosis field were identified for people aged 35–84 years from both datasets. We defined STEMI as I21.0–I21.3, NSTEMI as I21.4, unspecified MI as I21.9 and subsequent MI as I22. All interhospital transfers were accounted for by identifying contiguous series of admissions. For example, if a patient was discharged from one hospital and admitted to another within 1 day, both admissions were classified as part of the same hospital stay and counted once. We also created 28-day episodes for each MI type, where any MI readmission occurring within 28 days of an index MI was classified as part of the index episode. This was to determine whether any observed differences in proportions and trends in each MI type were impacted by jurisdictional differences in early discharge and readmission practices. Our analysis showed proportions and trends in each MI type were consistent with the main results of the study (data not shown).
Statistical analysis
MI type is presented separately for England and WA as proportions of all MI admissions in each year. Age- and sex-standardised hospitalisation rates were calculated using the direct method for all MI, and for each MI type, separately for each jurisdiction. The numerator was the number of admissions for each MI type per year, and the denominator was the sex/5-year age group population number for each of England and WA, respectively. NSTEMI and unspecified MI are often analysed as a combined group in administrative data studies,13 14 therefore, we also calculated proportions and rates for NSTEMI/unspecified MI combined to allow comparison with published data. Rates were standardised by sex and 5-year age group using the 2013 European Standard Population as the standard. Age- and sex-adjusted trends were estimated from Poisson regression models which included 5-year age group, sex and calendar year (continuous). Statistical analyses were undertaken using SAS V.9.4.
Results
From 2000 to 2013, there were 931 057 hospitalisations for all MI in England. In 2000, 49% of all MI admissions were for STEMI, decreasing to 35% by 2013 (figure 1). NSTEMI comprised less than 10% throughout most of the period, apart from a small increase through the mid-2000s. In contrast, unspecified MI increased from nearly one-third of all MI admissions in 2000 to make up 60% by 2013. Records coded as subsequent MI increased from 13% to 21% of all admissions in 2011, but decreased to <1% in the last year of the study period.

Types of MI as a proportion of all MI admissions, from (A) linked English hospitalisation data and (B) linked Western Australian hospitalisation data. MI, myocardial infarction; NSTEMI, non-ST-segment elevation myocardial infarction; STEMI, ST-segment elevation myocardial infarction.
In WA for the same period, there were 41 113 hospital admissions for all MI. STEMI accounted for 59% in 2000, decreasing to 25% of MI admissions by 2013 (figure 1). In contrast, NSTEMI increased from 24% to 73% of all MI admissions by 2013. Unspecified MI was only a small proportion of cases throughout the study period, decreasing from 16% in 2000, to 1% by 2013. Subsequent MI was rarely coded in WA data (~1% of admissions annually).
NSTEMI and unspecified MI in combination accounted for 37% of all MI admissions in England and WA in 2000, increasing to 63% and 75% respectively by 2013. In both England and WA data, the proportion of cases coded as STEMI was higher in men than women, with lower proportions of unspecified MI in men than women in both data sources (online supplementary figure 1). Trends in the proportion of each MI type were similar between men and women.
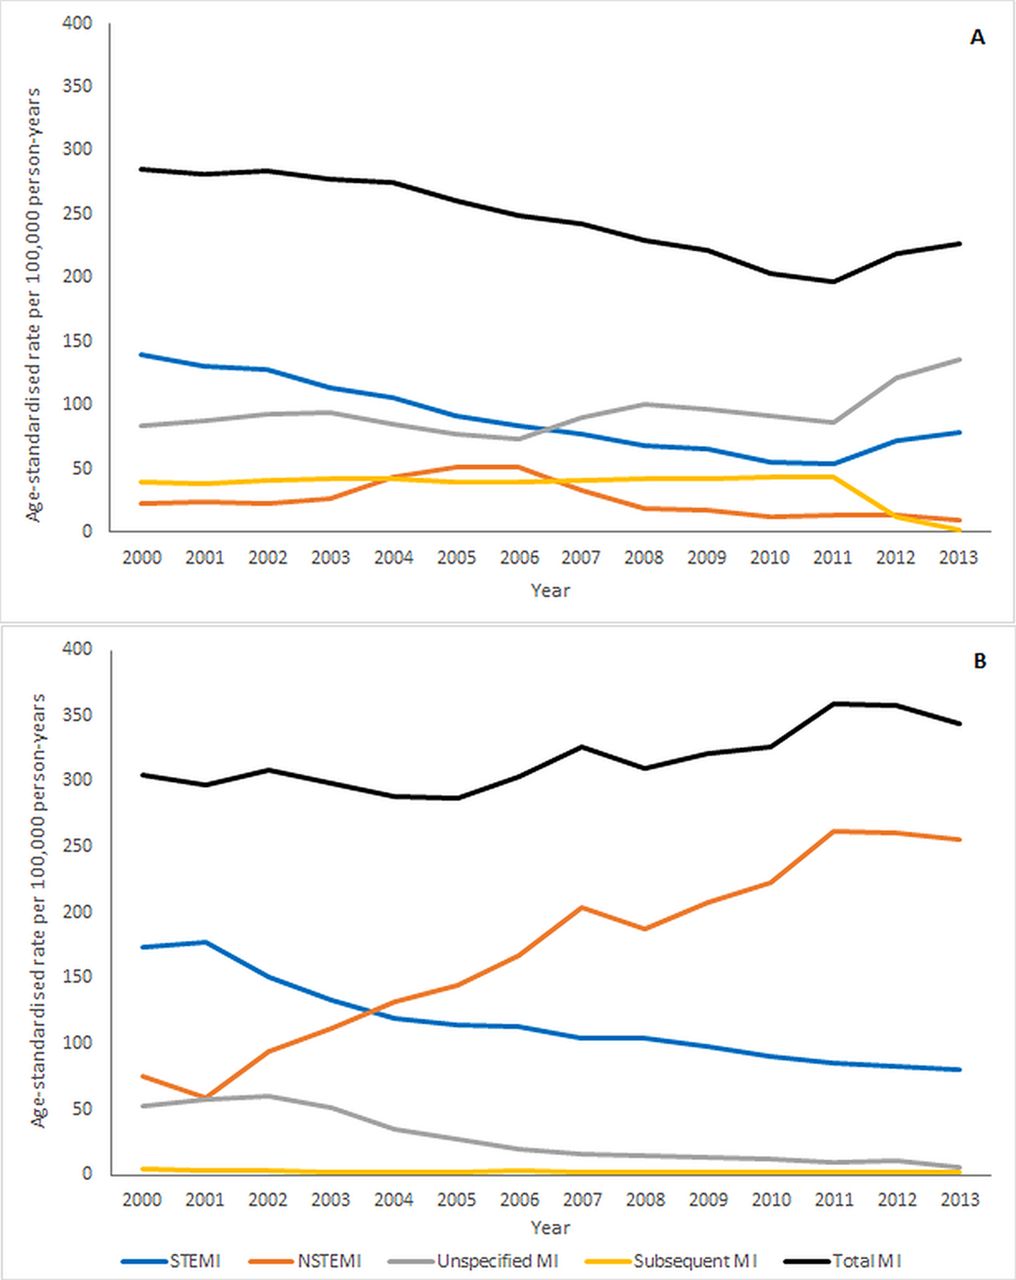
Age- and sex-standardised rates of all MI admissions were similar between the two data sources in the first years of the study period (figure 2). However temporal trends differed, with all MI declining in England and increasing slightly in WA (table 1). Rates of STEMI were higher in WA than England at the beginning of the period (173/100 000 vs 139/100 000 person-years), however, rates declined in both jurisdictions to ~80/100 000 in 2013. The significant increase in NSTEMI and decline in unspecified MI rates in WA was converse to that seen in the English data. Rates of subsequent MI were <5/100 000 person-years throughout the period in WA, in contrast to an average of ~40/100 000 person-years in England. The age- and sex-adjusted average change in subsequent MI rates in England was −4.6%/year (95% CI −4.5% to −4.7%) for the overall study period. However, when the period was restricted to 2000 to 2011, the trend was marginally upward (+0.9%/year, 95% CI +0.7% to +1.0%). Similarly for unspecified MI, there was an attenuation of the upward trend in rates when the period was restricted (+0.6%/year, 95% CI +0.5% to +0.7%, 2000–2011). There was a sharp downturn in rates of subsequent MI in England in 2012, declining from 43/100 000 person-years to 1/100 000 person-years by 2013, with concomitant increases in STEMI and unspecified MI rates.
Age- and sex-adjusted trends in all MI, and MI types, in England and Western Australia, based on International Classification of Diseases coding

Age- and sex-standardised rates of all MI, and MI types, based on International Classification of Diseases codes, from (A) linked English national hospitalisation data and (B) linked Western Australian hospitalisation data. MI, myocardial infarction; NSTEMI, non-ST-segment elevation myocardial infarction; STEMI, ST-segment elevation myocardial infarction.
Discussion
We found differences in temporal trends of admissions for all MI and some MI types identified from English and WA whole-population electronic hospital data from 2000 to 2013. In England, rates of total MI declined while there was a slight increase in rates in WA. Using the fourth-digit ICD-10 code to identify MI types produced low rates and proportions of NSTEMI admissions in English data, which differed significantly from WA data. Unspecified MI and subsequent MI have been more frequently coded in England compared with WA. In contrast, the proportion of admissions and age- and sex-adjusted trends in rates of STEMI are similar between the two data sources despite differences in coding standards.
Identification of STEMI and NSTEMI using ICD-10 codes
The proportion of all MI admissions comprised of STEMI and decline in rates was similar in both jurisdictions and consistent with trends in other studies.6 In contrast, there was a very low proportion and no upward trend in rates of NSTEMI admissions in England. This is inconsistent with registry studies, including the Myocardial Ischaemia National Audit Project in England, where the overall proportion of NSTEMI cases in 2003–2010 was 51%.15 The increasing proportion of NSTEMI and decreasing STEMI admissions in the WA data corresponds with the coding standards in place and data from clinical registries in Australia.16 The high proportion of MI admissions recorded as unspecified in the English national hospitalisation data is congruent with the English coding standards in place during the study period, which are likely to have facilitated the coding of unspecified MI instead of NSTEMI and STEMI, although the pattern in NSTEMI admissions likely indicates a greater misclassification in this group.
Aggregation of NSTEMI and unspecified MI is an approach used previously in electronic hospital data studies as a means of accounting for unspecified MI admissions.17 Previous validation of a sample of MI cases found unspecified MI to be more closely aligned with NSTEMI14 although this has not been formally tested in English and Australian data. Using this method with the English data produced a temporal pattern for NSTEMI more compatible with observed proportions and trends in WA and elsewhere. However, because of the coding standards, there is still likely misclassification of an unknown proportion of STEMI cases into this grouping, and the coding of STEMI and NSTEMI admissions as non-specific subsequent MI further complicates interpretation.
The change to coding standards in Australia in 2004, where STEMI and NSTEMI were first listed alongside the relevant I21 codes, appear to have had little impact on trends in these subtypes. The increasing and decreasing proportions of NSTEMI and STEMI cases respectively appear to pre-date the inclusion of these descriptors in the Australian version of ICD-10. In contrast, changes to the coding standards in England in 2012 appear to have contributed to a marked decline in the proportion of cases coded as subsequent MI from 2012, with most of the shift in coding towards STEMI and unspecified MI.
Despite the increasing number of studies using ICD codes to stratify MI by ST-elevation status, there is limited validation of the ICD codes which nominally indicate STEMI or NSTEMI. Additionally, coding standards and guidelines for their application relevant to the dataset are often not reported. While positive predictive value (PPV) for the recording of MI overall in electronic hospital data is reasonably high (~90% in England,18 85% in WA),19 data from the Kaiser Permanente database in the USA reported different PPV for STEMI and NSTEMI cases (79% and 91% respectively, based on ICD-9-CM codes).14 Similar differences in PPV between STEMI and NSTEMI were reported from an Australian case review using both ICD-9-CM and ICD-10-AM codes.20 Descriptors for STEMI and NSTEMI were added to the transmural and subendocardial MI codes in ICD-9-CM in the USA in 2005,21 but were rarely included in this ICD version in other jurisdictions including Australia.
Comparisons of trends
There are an increasing number of studies reporting temporal trends in rates of STEMI and NSTEMI using electronic health data. The US Kaiser Permanente study, and Irish and German national administrative data studies report consistently significant reductions in rates of STEMI since the late 1990s.14 17 22 Results from community-based studies using medical notes to classify MI types in the USA, including the Atherosclerosis Risk in Communities (ARIC) and Olmsted County studies, support these findings, and highlight reductions in STEMI as being independent of the introduction of troponin.5 6 In our study, trends in STEMI hospitalisation rates in England and WA are consistent with these reports.
Population-level trends in NSTEMI are less consistent across studies. The ARIC study found no significant change in rates of first NSTEMI from 1997 to 2008,5 in contrast to increasing rates in Olmsted County,6 Ireland17 and small increases in rates in Germany.22 The marked difference in NSTEMI rates and trends between England and WA in the current report add to these inconsistencies. Variations in troponin assay sensitivity and implementation of diagnostic guidelines for MI could contribute to these differences, and the magnitude of upward trend in NSTEMI rates in Australia appears significantly greater than in other jurisdictions. In England, variation in the actual recording of NSTEMI diagnoses at the hospital level has been reported,23 and combined with coding standards which until recently promoted recording of unspecified MI, are likely major contributors to the low NSTEMI rates in English national data.
Implications
Our results have implications for the use of ICD codes in identifying MI type from electronic hospital data. The coding standards in place in England until 2015 suggest that English electronic hospital data are unlikely to be reliable for differentiating STEMI and NSTEMI admissions. In particular, it is unlikely that the fourth-digit codes for NSTEMI can be reliably used for population-level temporal trend analyses or in follow-up studies for defined patient cohorts in England without adjudication of diagnoses from medical notes. Conversely, the large increase in NSTEMI rates and cumulative increase in all MI rates in WA differs from many studies from other countries, where trends in MI rates have continued downward, despite the effect of troponin testing.24 25 This necessitates some caution in the use of ICD-10 codes for reporting temporal trends in NSTEMI in Australia using electronic hospital data, although the proportion of MI comprised of NSTEMI in contemporary data is consistent with that in ACS registries.26
Our results are also of relevance for population monitoring of incidence and hospitalisation rates of all MI. In England there is high concordance between electronic hospital records and general practice datasets for the recording of total MI (I21, I22)27 and similarly in Australia, thus, indicating that these data remain a reliable and pragmatic means of monitoring rates of all MI in the population. In terms of identifying incidence (first-ever cases), the coding standard for subsequent MIs in place in England up until 2012 is unlikely to have ensured accurate identification of all first-ever MIs as coders would not always have had access to all hospital records and medical history for a patient. The use of linked datasets using hospital data alone or multiple sources, therefore, remains a necessary mainstay of monitoring MI incidence.
Strengths and limitations
The large number of admissions in both datasets allowed examination of each coded MI type annually over a relevant extended period. Although population sizes differ, the use of proportions and age-standardised rates allowed for comparison between the two jurisdictions. Although we were aware of the coding standards in place in each jurisdiction, there can be local differences in instructions to coders and application of standards which could affect the results. The WA results in the current study are likely to be generalisable nationally, as the coding standards described here are applied nationally, and the Australian Institute of Health and Welfare has reported national MI trends and rates of the subsequent MI code using unlinked data which support the WA results in our study.8 We were unable to validate the recording of STEMI and NSTEMI in administrative data against clinical data for the purpose of this analysis. In WA, we are currently pursuing this using a random sample of MI cases to compare medical records and ECG findings against recording of the fourth-digit ICD code for MI type in electronic hospital data. As national hospitalisation data in Australia are unlinked, WA linked data were used for the current study, thus removing double counting of events due to interhospital transfer, and allowing direct comparison with English linked data.
Conclusions
Understanding population-level trends in MI remains an important component of monitoring the effectiveness of management and prevention of CHD. Electronic health data are a pragmatic means of collecting information and reporting trends for MI. However, our results highlight the necessity for understanding coding standards when using specific codes such as MI type from administrative data, and call into question the accuracy of fourth-digit ICD codes to identify STEMI and NSTEMI for use in monitoring and follow-up studies across jurisdictions. The use of such codes should be investigated in each jurisdiction prior to widespread use for monitoring and analyses of outcomes. Changes in clinical classification and practice such as have occurred with MI are not always reflected in ICD codes or standards in a timely manner, and our results highlight the potential for wide variation in the use of such codes in different jurisdictions.
Acknowledgments
The authors wish to thank the staff at the Western Australian Data Linkage Branch, the Department of Health Inpatient Data Collections and Registrar General, and staff at Unit of Health-Care Epidemiology, Nuffield Department of Population Health, University of Oxford. LN is supported by a NHMRC Early Career Fellowship.
References
Footnotes
Contributors LN and FLW conceived the study; LN carried out the data analysis and wrote the manuscript; LN, FLW, DL, FMS, MJG and MSTH reviewed the data, provided interpretation and critical revisions, and reviewed all drafts of the manuscript.
Funding This work was supported by the National Health and Medical Research Council of Australia (NHMRC) and a Research Collaboration Award from The University of Western Australia. The Unit of Health-Care Epidemiology is supported by the NIHR Biomedical Research Centre, Oxford.
Competing interests None declared.
Ethics approval Ethical approval was obtained from the Central and South Bristol Multi-Centre Research Ethics Committee (04/Q2006/176) for the building and analysis of the English national record-linked data by the Unit of Health-Care Epidemiology. Approval for use of the WA data was obtained from the WA Department of Health and UWA Human Research Ethics Committee.
Provenance and peer review Not commissioned; externally peer reviewed.
Data sharing statement No additional data are available.