Article Text

Abstract
Objectives To develop an appropriate method of assessing visual field (VF) loss which reflects its functional consequences, this study aims to determine which method(s) of assessing VF best reflect mobility difficulty.
Setting This cross-sectional observational study took place within a single primary care setting. Participants attended a single session at a University Eye Clinic, Cambridge, UK, with data collected by a single researcher (HS), a qualified optometrist.
Participants 50 adult participants with peripheral field impairment were recruited for this study. Individuals with conditions not primarily affecting peripheral visual function, such as macular degeneration, were excluded from the study.
Primary and secondary outcome measures Participants undertook three custom and one standard binocular VF tests assessing VF to 60°, and also integrated monocular threshold 24–2 visual fields (IVF). Primary VF outcomes were average mean threshold, percentage of stimuli seen and VF area. VF outcomes were compared with self-reported mobility function assessed with the Independent Mobility Questionnaire, and time taken and patient acceptability were also considered. Receiver operating characteristic (ROC) curves determined which tests best predicted difficulty with mobility tasks.
Results Greater VF loss was associated with greater self-reported mobility difficulty with all field paradigms (R2 ⇓0.38–0.48, all P<0.001). All four binocular tests were better than the IVF at predicting difficulty with at least three mobility tasks in ROC analysis. Mean duration of the tests ranged from 1 min 26 s (±9 s) for kinetic assessment to 9 min 23 s (±24 s) for IVF.
Conclusions The binocular VF tests extending to 60° eccentricity all relate similarly to self-reported mobility function, and slightly better than integrated monocular VFs. A kinetic assessment of VF area is quicker than and as effective at predicting mobility function as static threshold assessment.
- Low Vision
- Visual Fields
- Perimetry
- Mobility Function
- Visual Impairment
- Self-reported Function
This is an Open Access article distributed in accordance with the Creative Commons Attribution Non Commercial (CC BY-NC 4.0) license, which permits others to distribute, remix, adapt, build upon this work non-commercially, and license their derivative works on different terms, provided the original work is properly cited and the use is non-commercial. See: http://creativecommons.org/licenses/by-nc/4.0/
Statistics from Altmetric.com
Strengths and limitations of this study
Rigorous and novel visual field (VF) testing on a cohort of people with VF loss.
Consideration of the patient’s perspective of VF assessment.
Use of Rasch analysed data from a validated questionnaire to reflect a broad range of mobility function.
Different VF paradigms compared with functional vision, which has not previously been reported.
Single, rather than repeated, measures of VF function are used.
Introduction
Visual field (VF) loss is an extremely important dimension of visual impairment. There are significant consequences of VF loss for functional ability,1–6 including increased difficulty with mobility,7–12 and potentially also increased risk of falling11 13–18 and of car accidents.19 However, currently available conventional VF tests are designed to detect and monitor the progression of disease, and are not optimised for reflecting the functional consequences of VF loss. Although binocular VF are known to be important in individuals with visual impairment, particularly VF beyond 30°,20 conventional VF tests only measure monocular VF of the central 30° or less.21–24
VF assessments are demanding procedures25 and many people dislike performing VF tests.25 26 An ideal functional field test would take into account the acceptability of tests to a patient, on the basis that an acceptable test and duration will provide better data.27 Patients’ opinion of vision testing is largely unreported, although it has been suggested that this is due to difficulty objectively quantifying subjective or ‘human factors’, of field assessment.25 28
One aspect of an ideal binocular functional VF test that is not clear is what test strategies are most appropriate to use. Of the studies that have previously assessed the VF binocularly, strategies including kinetic,29–33 suprathreshold strategies including the Esterman VF test,10 33–38 and threshold tests,24 39 40 have been used.
The closest current VF tests to a ‘gold standard’ for assessing functional loss are the binocular Esterman test,41 and the integrated visual field (IVF)42 although this is a monocular assessment used to produce binocular results. The Esterman test, the only standard binocular field test available, is used to determine the extent of VF in UK drivers,43 although it was not originally designed for this purpose.40 Although some studies suggest that the Esterman test is a good predictor of visual function,36 44 45 its limitations are well documented and include a substantial ceiling effect which limits the test’s applicability for people with low to moderate levels of field loss,2 10 29 37 38 44 46 47 and an inability to differentiate effectively between people with different levels of field loss.38 As an alternative, Crabb and Viswanathan42 constructed IVF from monocular field plots using software that estimates sensitivities at points of overlapping locations using a ‘best location’ algorithm.21 38 While IVF provide a rapid estimate of a patient’s binocular field without extra perimetric examination,21 23 48 they do assume that previous VF results are available which is not always the case in low vision clinics. Binocular function is derived rather than measured, and the plots used usually only assess the central 30° of VF.
The purpose of this study is to develop an optimal binocular VF test to reflect the functional consequences of VF loss by assessing threshold, suprathreshold and kinetic binocular VF paradigms examining the VF to 60° eccentricity, and existing standard Esterman and IVF. Results are compared with self-reported difficulty with mobility to determine which VF assessment paradigms best reflect functional difficulty. The VF testing experience of individuals with visual impairment is also considered to help devise optimal strategies for functional field assessment.
Methods
Participants with self-reported peripheral VF loss were recruited for this cross-sectional observational study through advertisement of the study with local voluntary agency Cam Sight, and the charities Retinitis Pigmentosa (RP) Fighting Blindness and the International Glaucoma Association. Recruiting participants with a range of ocular conditions allowed the assessment of a range of VF loss, and reflects the need of a functional field assessment to be applicable to patients with a range of visual disorders. Individuals with conditions not primarily affecting peripheral visual function, such as macular degeneration, were excluded from the study, along with those under 18 years of age and those unable to perform verbal evaluations in English. Ethical approval was granted by Anglia Ruskin University Faculty of Science and Technology Research Ethics committee. All relevant tenets of the Declaration of Helsinki were upheld. All participants gave informed consent after the nature of the study was explained. Participants attended a single session at the University Eye Clinic, Anglia Ruskin University, with data collected between 3 July 2015 and 4 March 2016 by a single researcher (HS), a qualified optometrist.
Part 1 of the Independent Mobility Questionnaire (IMQ)29 49 was used to assess self-perceived ability in mobility. Participants were asked to report if they encountered difficulty in each of 35 mobility situations (Box 1) to obtain a binary response (Yes/No), and then to rate the level the difficulty they experienced on a 5-point Likert scale. Respondents could indicate that a mobility task was not applicable to them, which was scored as missing data.
Thity-five mobility situations from Part 1 of the Independent Mobility Questionnaire IMQ.29 49
How difficult is it for you to undertake the following tasks independently/without assistance (but with the aid of any mobility aids as required)
Walking in familiar areas
Walking in unfamiliar areas
Moving about: at home
Moving about: at work
Moving about: in the classroom
Moving about: in stores
Moving about: outdoors
Moving about: in crowded situations
Walking at night
Using public transportation
Detecting ascending stairwells
Detecting descending stairwells
Walking up steps
Walking down steps
Stepping onto curbs
Stepping off curbs
Walking through doorways
Walking in high glare areas
Adjusting to lighting changed during the day: indoor to outdoor
Adjusting to lighting changed during the day: outdoor to indoor
Adjusting to lighting changed at night: indoor to streetlights
Adjusting to lighting changed at night: streetlights to indoor
Walking in dimly lit indoor areas
Being aware of another person’s presence
Avoiding bumping into: people
Avoiding bumping into: walls
Avoiding bumping into: head height objects
Avoiding bumping into: shoulder height objects
Avoiding bumping into: waist height objects
Avoiding bumping into: knee height objects
Avoiding bumping into: low lying objects
Avoiding tripping over uneven travel surfaces
Moving around in social gatherings
Finding restrooms in public places
Seeing cars at intersec
Participants were also asked to report whether they had fallen in the last 12 months, defined as an event which results in a person coming to rest inadvertently on the ground, floor or other lower level.50
High contrast distance visual acuity with habitual distance spectacle correction was assessed binocularly and scored by letter51 using a 3 m internally illuminated Early Treatment Diabetic Retinopathy Study (EDTRS) chart.52 If the largest letters could not be read at 3 m, the chart was moved 50% closer to the participant to 1.5 and 0.75 m. Participants with acuity that was not measureable were assigned an acuity of 3.00 logarithm of the minimum angle of resolution (logMAR).53 Contrast sensitivity was measured binocularly with habitual distance spectacle correction using a Pelli-Robson Chart54 at 1 m scored on a by letter basis.55 Participants with no measurable CS function were assigned a score of 0.00 logarithm of the contrast sensitivity (logCS).53
Five VF assessments were performed using the Octopus 900 perimeter56 and the Humphrey Field Analyser.57 VF test order was randomised, and regular breaks were provided. In all assessments, participants responded to seeing a VF stimulus by pressing a response button. The duration of all assessments was noted. The standard size III Goldmann white stimulus was used throughout. Participants fixated on the standard orange central point target (Humphrey Field Analyser, HFA) or green cross target (Octopus 900). When participants had difficulty seeing the target or maintaining binocular fixation, a 6° ring target was used on the Octopus, and an adaption to the fixation target on the HFA that slotted into the fixation target hole to provide a black 2 mm high-contrast pericentral ring around the fixation spot were used.
The three tests conducted on the Octopus 900 perimeter were as follows, using the ‘binocular’ setting in all cases:
Binocular threshold
A custom test point pattern was used, assessing the binocular field to 60° from fixation with 52 points spaced every 7.5° in the central 30°, and 36 points spaced every 15° in the peripheral 30°–60°. Full aperture trial lenses were used in adult half-eye trial frames with lens centration distances corrected for near for assessment of the central 30°. The peripheral 30°–60° field was assessed without correction to minimise the possibility of lens and frame artefacts. The ‘low vision’ test strategy was used: stimuli are presented using a 4-2-1 dB bracketing test method starting at 0 dB (4000asb) in order to arrive quickly at the expected threshold level in subjects with impaired VF. The absolute thresholds achieved at each test location were used to calculate the mean threshold.39 42
Binocular suprathreshold
The same custom test pattern as for binocular threshold assessment was used. Each point was assessed with a stimulus of 10 dB intensity. The number of points seen from the total of 88 was used to calculate a percentage score.
Binocular kinetic
A white III-4e (10 dB) target was presented kinetically at an angular velocity of 5°/s. Vectors were presented from 60° eccentricity and moved centrally in 12 meridians spaced every 30°. This assessment was completed without refractive correction. The solid angle (deg2) subtended by the isopter was determined automatically using the Eye Suite software.55 The perimeter corrected results for reaction time bias.
The two tests conducted on the HFA were as follows:
Integrated monocular threshold fields (IVF)
The central 24–2 threshold test with Swedish interactive thresholding algorithm (SITA)-Fast strategy was used to assess monocular VF. Full aperture trial lenses provided refractive correction. IVF scores were calculated using the best location algorithm.21 23 24 37 38 42 47 58–60
Esterman
The binocular Esterman VF test examines 120 test points out to 80° eccentricity using a suprathreshold paradigm with a stimulus intensity of 10 dB. This assessment was completed without refractive correction. The number of points seen was used to calculate the percentage Esterman Efficiency score.
Participants were asked to rank the field tests in order from 1 to 5 based on how acceptable they felt the tests were, and also to rank the perceived usefulness of results presented. Participants were also invited to make further comments relating to acceptability and output of the tests, and qualitative themes were evaluated from this data.
Analysis
Interval data were derived from the ordinal IMQ responses by the use of Rasch analysis.61 The Rasch model, a probabilistic logistic model, is a paradigm for the analysis and scoring of questionnaires that can be used to produce interval level data from ordinal responses, and in turn improves sensitivity to change in function62 and correlations with other variables,62 63 allows the use of robust parametric statistics on the data,63 and provides more accurate measurements of perceived function.64 In the Rasch model, items and respondents are scaled according to responses to a group of items.61 65 The underlying construct being assessed is used to define the relative difficulty of each item. On the same linear scale of the construct, respondents are ordered from least to most ability, and items are ordered from most to least difficult.
Rasch analysis derives person and item measures in logits from raw ordinal data. Person measures are an estimate of a person’s underlying ability based on their performance on a set of items that measure a single trait. The item measure is the Rasch estimate of item difficulty.
Person measures were derived using all 35 items, which have been found to constitute a unidimensional scale in people with peripheral field loss due to RP29 and glaucoma.49 Higher person measures indicate greater perceived ability.
The reliability indices were assessed in terms of person separation statistics, which provide an indication of the instrument’s ability to discriminate between respondents: person separation and person reliability should be greater than the suggested minima of 2.0 and 0.80, respectively.66 Further, item separation statistics provide an indication of how reliably ordered the items are in terms of difficulty: item separation and item reliability should be in excess of suggested minima of 3.0 and 0.90.66 Targeting, or the difference between mean item and person measures, should ideally be less than 1.0 logit.67 68
Additionally, the fit of individual items to a unidimensional construct is assessed. It is considered that items with infit and outfit mean square (Mn Sq) values within a range of 0.5–1.5 contribute usefully to a scale.68 Items with Mn Sq values greater than two have the potential to damage the integrity of the scale.69
Mann-Whitney U tests compared visual function in participants who had reported a fall in the previous 12 months and those who had not. Continuous clinical function variables were compared with self-reported mobility function in non-parametric two-tailed Spearman’s rho bivariate correlations.
For the binary responses to the 35 mobility tasks of the IMQ, difficulty was compared with different VF test scores using receiver operating characteristic (ROC) analysis to evaluate how effective the tests were at selecting participants with perceived mobility difficulty (sensitivity) and without perceived mobility difficulty (specificity). Sensitivity and specificity were determined for all possible cut-off values for the VF scores and plotted as ROC curves. An area under the ROC curve of 1 indicates a perfect diagnostic procedure, whereas 0.5 indicates a poor procedure. A statistical technique appropriate where two measures are applied to the same set of participants70 was used to compare areas under the ROC curves and establish if any VF test was statistically significantly better at predicting perceived difficulty.
Results
Table 1 shows the characteristics of the 50 participants who were recruited to the study: all completed the study. Sample size is consistent with previous similar studies.1 29 34 42 Person measures for the IMQ are shown. Other parameters derived from the Rasch analysis include person separation of 3.43 (reliability 0.92), indicating that individuals can be reliably ordered by the instrument in terms of their level of perceived ability. Item separation is 2.95 (reliability 0.90), slightly less than the minimum ideal value of 3, and indicating the instrument might not be able to reliably order items in terms of their difficulty. Targeting (−1.23±1.64 logits) is close to the ideal of within ±1 logits of the mean item difficulty.7 In terms of item fit, as a representation of how well the questions fitted a unidimensional construct, there were three mis-fitting items with fits in the range 1.5–2.0 Mn Sq. These fits do not diminish the validity of the measures and can be considered acceptable,71 and so all items are considered in the analysis. Item fits are also comparable to other Rasch analyses of this instrument, with three items with slight mis-fit also found for samples with RP29 72 and glaucoma.49 Reliability statistics indicate adequate VF reliability for the majority of the sample. Fixation losses for the monocular threshold tests suggest reliable results, with only 18% of participants losing fixation more than 20% during both assessments. Ninety per cent of false positive and false negative statistics from binocular threshold data were less than 20%. This figure is similar to statistics obtained from Esterman (86%) and binocular suprathreshold results (78%) results.
Descriptive statistics of the variables assessed (n=50)
Table 2 shows the relationships between the parameters assessed and the outcome measures of self-reported mobility function and fall history. Greater VF loss is significantly associated with greater self-reported difficulty regardless of the method of field assessment, although the relationship is a little weaker for the IVF score. Fifty-six per cent of the sample reported falling at least once in the previous 12 months, but none of the clinical function variables significantly associate with falls history (table 2).
Relationship between the variables assessed, and self-reported mobility function and falls history. Mann-Whitney U values are provided for falls data and Spearman’s rho bivariate correlations are provided for the IMQ score
The ability of the VF tests to discriminate between people with and without difficulty with mobility tasks was reasonable (area under the curve >0.7) for at least one VF test for all except 2 of the 35 questions (figure 1). Statistically significant differences in the areas under the ROC curves were seen (indicated by * in figure 1), in that binocular threshold and suprathreshold assessments were better than the IVF at predicting difficulty walking in familiar areas, walking in unfamiliar areas, walking at home, walking in crowded areas, avoiding bumping into knee height objects and finding public toilets. The binocular threshold assessment was also better than the IVF at predicting difficulty avoiding bumping into people, while the Esterman was found to better predict difficulty walking in high glare when compared with the IVF. All three custom tests and the Esterman assessment were better than the IVF at predicting difficulty avoiding bumping into waist height objects, and at predicting difficulty avoiding bumping into low lying objects.

Graphical representation of areas under receiver operating characteristic (ROC) curves for the different visual field tests. The questions to which the numbers on the X-axis refer are given in box 1. Indicates a visual field assessment with a statistically significant greater area under the curve (AUC) than an alternative assessment (P≤0.05). All other comparisons were non-significant.
The length of time taken to undertake each VF assessment is shown in figure 2. The quickest test was the kinetic which took a mean of 1 min 26 s (±9 s), while the mean duration of the longest test, the IVF, was 9 min 23 s (±24 s).
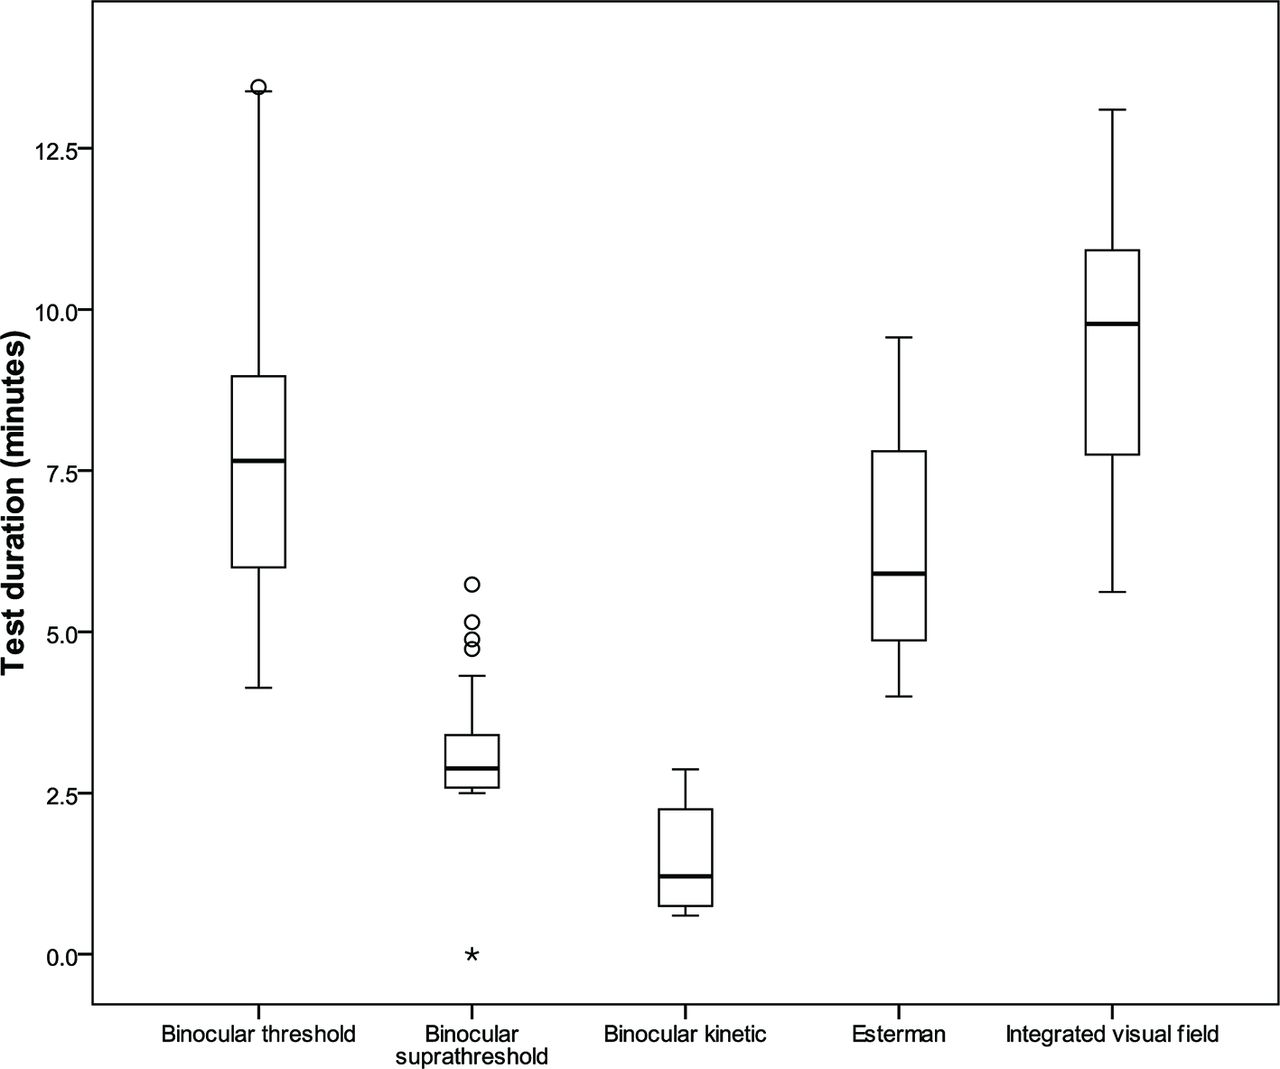
Test durations of each of the five visual field assessments. *indicates an outlier.
In terms of the participants’ view of how they found the tests to undertake, the most favoured assessment was the kinetic (figure 3), while the IVF was ranked the least favourite test by over 60% of participants. In addition to ranking the tests, participants also made comments on the different test strategies, and common themes are considered here. Three participants (6%) commented that shorter tests were preferred, the kinetic assessment in particular. Participants found the kinetic assessment pleasant, less stressful and encouraging, with three participants commenting on being reassured by knowing that a light would be seen eventually. Seven participants (14%) suggested that the kinetic assessment was more fun and engaging than the static tests, and one remarked on the assessment’s novelty value. However, six participants (12%) expressed concern that the test was too basic or too short, and that the accuracy of results would be compromised by the test’s rapidity. Participants were happy to conduct a longer test if they knew that results would be more beneficial to the practitioner. Eleven participants (22%) indicated preference for binocular tests, which were reported as more comfortable and less tiring than monocular assessments. Five participants (10%) preferred the uniformly bright lights on the binocular suprathreshold assessment; however, four (8%) found the bright lights at the start of the binocular threshold assessment encouraging.

Participants’ ranking of visual field tests acceptability. IVF, integrated visual field.
All participants in the study reported previous experience of VF testing, although 28% had not seen their VF results before (table 1). All perceived values are being shown their VF. In terms of VF outputs, 48% of participants preferred the grey scale plots from the binocular threshold analysis, and individuals remarked on the greater level of detail provided on a grey scale plot compared with others. The kinetic plot was most favoured by 37% of participants, with preference expressed for plots that indicated greater levels of residual field. Four participants commented on the usefulness of having their peripheral field represented, with one participant suggesting that the monocular threshold plots were an inaccurate depiction that overestimated the extent of their VF. The Esterman output was the least favoured by 38% of participants. Three participants commented on the size of points on suprathreshold outputs, and expressed difficulty viewing the results.
Discussion
Five different VF assessments were compared with self-reported difficulty with mobility, in order to determine which VF paradigms are suitable for use as a functional VF assessment. There are four principal findings of this study. First, the paradigm used to assess the VF (threshold or suprathreshold static, or kinetic) makes little difference to the relationship with function: so long as the test is performed binocularly and includes assessment of eccentricities to 60°, the VF outcome measure reflects self-reported mobility function well, in terms of both correlation between VF score and mobility function, and in terms of ability of VF scores to discriminate between individuals who do and do not have difficulty with specific mobility tasks. Second, tests that are quicker to perform (binocular suprathreshold, binocular kinetic, Esterman; figure 2) relate just as well to self-reported mobility function as tests that take longer (binocular threshold; table 1). Functional information is not lost by using kinetic or suprathreshold techniques when compared with the diagnostic gold standard of measuring static thresholds. Third, quicker tests are also more acceptable to patients (figure 3), especially the binocular suprathreshold and kinetic paradigms. Finally, although all participants had experience of VF assessments, over a quarter did not recall being shown their VF results before. All participants in this study found value in seeing their VF results, and clinicians are encouraged to explain VF results with respect to likely functional difficulties where possible.
A strength of this study is that although some previous studies45 73–75 have compared different methods of quantifying the VF and their relationship with functional vision, we are not aware of any previous studies that have compared different paradigms of VF assessment with functional vision, nor that have taken the patient’s perspective into consideration. Rigorous and novel VF testing on a cohort of people with VF loss has been used, along with Rasch analysed data from a validated questionnaire to reflect a broad range of mobility function.
One possible limitation of the study is that we rely on self-report of mobility difficulties rather than directly measuring visual performance on, for example, a mobility circuit.12 31 Another potential limitation is that single responses have been used in the kinetic paradigm. Responses to kinetic stimuli can be variable,76 and repeated presentations might be necessary to confirm responses, and reduce the impact of outlying responses.77
The findings are consistent with previous studies, in that we find that the IVF relates to mobility function.58 78 Contrary to other studies, however,38 42 the IVF appears to be less effective at relating to self-related mobility function when compared with the Esterman assessment. This may be due to the difference in the degree of VF loss between the sample groups. The average Esterman scores in the current study (56.4%) are less than the average scores (87.4%37 and 86.7%41 reported in other studies, and would suggest that the present sample has a greater degree of VF loss. Contrary to some previous studies, no significant correlations were found here between measures of clinical function and fall history. VF loss has been shown to increase the risk of falling in some studies,6 11 13–18 but not in others.79 80 Variation in findings reflects the multifactorial nature of falls, and also suggests limitations in retrospective reporting of falls.81
Participants with a range of ocular conditions affecting peripheral vision (but predominantly glaucoma and RP) and a range of severity of VF loss were used in this study. Results would be expected to be generalisable to people with mild to severe peripheral field loss, but not necessarily to those with visual impairment affecting central visual function, such as macular degeneration.
In conclusion, a binocular VF test that does not ignore the peripheral 30°–60° of the field is effective for reflecting functional difficulty, regardless of the whether a threshold, suprathreshold or kinetic assessment paradigm is employed. A shorter duration VF test such as the binocular kinetic assessment used in this study is favoured by patients, and this study did not find significantly different effectiveness for this method compared with more time-consuming tests in predicting perceived disability in patients with peripheral field loss. To further explore the potential of a binocular kinetic assessment as a functional field test, future work needs to explore the repeatability of responses, the necessity for repeated presentations, and the assessment’s ability to discriminate between individuals with normal and abnormal fields using control subjects.
References
- 1.↵
- 2.↵
- 3.↵
- 4.↵
- 5.↵
- 6.↵
- 7.↵
- 8.↵
- 9.↵
- 10.↵
- 11.↵
- 12.↵
- 13.↵
- 14.↵
- 15.↵
- 16.↵
- 17.↵
- 18.↵
- 19.↵
- 20.↵
- 21.↵
- 22.↵
- 23.↵
- 24.↵
- 25.↵
- 26.↵
- 27.↵
- 28.↵
- 29.↵
- 30.↵
- 31.↵
- 32.↵
- 33.↵
- 34.↵
- 35.↵
- 36.↵
- 37.↵
- 38.↵
- 39.↵
- 40.↵
- 41.↵
- 42.↵
- 43.↵
- 44.↵
- 45.↵
- 46.↵
- 47.↵
- 48.↵
- 49.↵
- 50.↵
- 51.↵
- 52.↵
- 53.↵
- 54.↵
- 55.↵
- 56.↵
- 57.↵
- 58.↵
- 59.↵
- 60.↵
- 61.↵
- 62.↵
- 63.↵
- 64.↵
- 65.↵
- 66.↵
- 67.↵
- 68.↵
- 69.↵
- 70.↵
- 71.↵
- 72.↵
- 73.↵
- 74.↵
- 75.↵
- 76.↵
- 77.↵
- 78.↵
- 79.↵
- 80.↵
- 81.↵
- 82.
Footnotes
Contributors All authors made substantial contributions to the design of the work. HS acquired the data for the study. All authors contributed to the analysis and interpretation of the data, drafting the manuscript and critical revision of the article. All authors gave final approval for the manuscript to be published and agree to be accountable for all aspects of the work.
Funding This work was supported by a College of Optometrists’ Postgraduate Research Scholarship.
Competing interests None declared.
Ethics approval Anglia Ruskin University Ethics Committee.
Provenance and peer review Not commissioned; externally peer reviewed.
Data sharing statement Data are available from FigShare, doi: 10.6084/m9.figshare.5484109.v1.